. 2020 Aug 27;11(9):1008.
doi: 10.3390/genes11091008.

Deciphering the Forebrain Disorder in a Chicken Model of Cerebral Hernia

Affiliations

Deciphering the Forebrain Disorder in a Chicken Model of Cerebral Hernia

Yingfeng Tao et al. Genes (Basel). .

Abstract

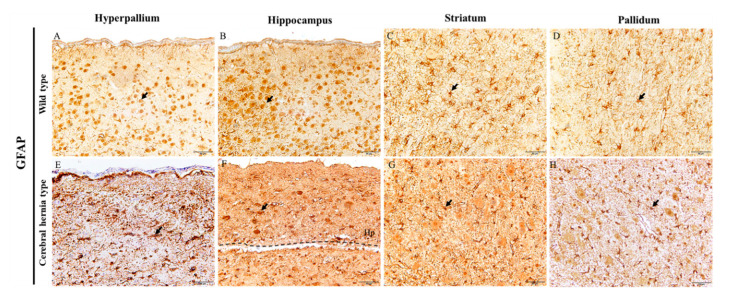
Cerebral hernia in crested chicken has been characterized as the protrusion of cerebral hemispheres into the unsealed skull for hundreds of years, since Charles Darwin. The development of deformed forebrain (telencephalon) of cerebral hernia remains largely unknown. Here, the unsealed frontal skull combined with misplaced sphenoid bone was observed and potentially associated with brain protuberance. The shifted pallidum, elongated hippocampus, expanded mesopallium and nidopallium, and reduced hyperpallium were observed in seven regions of the malformed telencephalon. The neurons were detected with nuclear pyknosis and decreased density. Astrocytes showed uneven distribution and disordered protuberances in hyperpallium and hippocampus. Transcriptome analyses of chicken telencephalon (cerebral hernia vs. control) revealed 547 differentially expressed genes (DEGs), mainly related to nervous system development, and immune system processes, including astrocyte marker gene GFAP, and neuron and astrocyte developmental gene S100A6. The upregulation of GFAP and S100A6 genes in abnormal telencephalon was correlated with reduced DNA methylation levels in the promoter regions. The morphological, cellular, and molecular variations in the shape, regional specification, and cellular states of malformed telencephalon potentially participate in brain plasticity and previously reported behavior changes. Chickens with cerebral hernia might be an interesting and valuable disease model to further explore the recognition, diagnosis, and therapy of cerebral hernia development of crested chickens and other species.

Keywords: DNA methylation; astrocyte; brain; cerebral hernia; chicken; neuron; sphenoid bone; telencephalon.


Conflict of interest statement

The authors declare no competing interests.

Figures

Figure 1
Figure 1
Anatomy and morphology of cerebral hernia type and wild type chickens. (A,B) The appearance of chickens with cerebral hernia (cerebral hernia type) (A) and without cerebral hernia (wild type) (B). (C,D) The differences of frontal bone between cerebral hernia type and wild type at P28 are shown in the lateral view (C) and dorsal view (D), respectively (left, cerebral hernia type; right, wild type). (E,F) The external morphology of brain in cerebral hernia type and wild type chickens at P28 from the dorsal (E) and lateral view (F), respectively (left, cerebral hernia type; right, wild type). (G) The diagram revealed abnormal development of the sphenoid bone and membranous frontal bone in the cerebral hernia type chickens (misplaced sphenoid bone is denoted in red, and the membranous frontal bone is denoted in blue region and with a black arrow). (H) The diagram showed the morphology of the sphenoid bone and frontal bone in wild type chickens (sphenoid bone is denoted in red, and frontal bone is indicated by a black arrow). Cb, cerebellum; Telenc, telencephalon; TeO, optic tectum.
Figure 2
Figure 2
Comparison of the telencephalon in cerebral hernia type and wild type chickens using Nissl stain. (A,B) The telencephalon encircled by the blue dotted line is divided into seven regions by marking the boundaries for each region with a red dotted line in wild type chickens (A) and cerebral hernia type chickens (B). Scale bars = 500 µm. (C,D) The sagittal sections of telencephalon in H region are presented in wild type chickens (C) and cerebral hernia type chickens (D). (E,F) The sagittal sections of telencephalon in Hp region are presented in wild type chickens (E) and cerebral hernia type chickens (F). (G,H) The sagittal sections of telencephalon in M region are presented in wild type chickens (G) and cerebral hernia type chickens (H). (I,J) The sagittal sections of telencephalon in N region are presented in wild type chickens (I) and cerebral hernia type chickens (J). (K,L) The sagittal sections of telencephalon in St region are presented in wild type chickens (K) and cerebral hernia type chickens (L). (M,N) The sagittal sections of telencephalon in A region are presented in wild type chickens (M) and cerebral hernia type chickens (N). (O,P) The sagittal sections of telencephalon in P region are presented in wild type chickens (O) and cerebral hernia type chickens (P). The neurons are marked with black arrows and open arrows indicating lower and higher magnification, respectively in (CP). The blood vessels are indicated with yellow arrows in (CP). The Hp region in cerebral hernia type chickens is located above the black dotted line (F). Scale bars = 50 µm. (Q) Quantitative analysis of the density of neurons in the telencephalon showed the decreased tendency in all seven regions in cerebral hernia type chickens. (R) The number of neurons in the telencephalon is increased in M and N, but decreased in H and Hp. (S) Quantitative analysis of the brain parenchyma areas demonstrating enlargement of M, N, and P regions, and reduced size of H and Hp regions in cerebral hernia vs. wild type chickens. H, hyperpallium; Hp, hippocampus; M, mesopallium; N, nidopallium; St, striatum; A, arcopallium; P, pallium. Data are presented as mean SEM (from three independent samples per group). (n = 3); * p< 0.05, ** p< 0.01 (Student’s t-test).
Figure 3
Figure 3
Identification of histological features of telencephalon in cerebral hernia and wild type chickens based on hematoxylin and eosin staining. (AN) The H, Hp, M, N, St, P, and A regions are represented in figure (A,E), (B,F), (C,G), (D,H), (I,M), (J,L), and (K,N) in wild type and cerebral hernia type chickens, respectively. The state of cells and blood vessels are marked with black and yellow arrows, respectively. The Hp region in cerebral hernia type is located above the black dotted line in image F. Scale bars = 50 µm.
Figure 4
Figure 4
Transcriptomic annotation of telencephalon derived from chicken with or without cerebral hernia. (A) The differentially expressed transcripts in the telencephalon of wild type and cerebral hernia type chickens are grouped into upregulated and downregulated transcripts, which are marked with red and green dots, respectively. The criteria set up for the enrichment are |fold change| > 1.5 and p < 0.05. (B) The top 30 enriched GO terms for the differentially expressed transcripts in the telencephalon between wild type and cerebral hernia type chickens are listed as biological process (green), cellular components (yellow), and molecular function (blue). The criterion set up for the enrichment is p < 0.05. (C) The top 20 enriched KEGG pathways for the differentially expressed transcripts are listed and presented as the number of genes (indicated by the spot size) with significance (indicated p-value of the pathway with the spot color). (D) An mRNA–mRNA interaction network is constructed using the potential candidate genes involved in brain, nervous system, and blood–brain barrier (BBB) development. The upregulated and downregulated genes are denoted in red and green, respectively. (E) Expressions of randomly selected DEGs involved in brain and nervous system development are validated by qRT-PCR. The gene expression trends of COL3A1, S100A10, THBS4, and GFAP are consistent with the tendency of RNA sequencing results. The qRT-PCR data are presented from six independent samples per group as mean SEM (n = 6); * p < 0.05, ** p < 0.01 (Student’s t-test).
Figure 5
Figure 5
Abnormal neurons and dendrites are identified with NeuN and MAP2 antibodies by using immunohistochemistry in the telencephalon of chickens with and without cerebral hernia. (AH) The positive signals of NeuN are detected in the neurons of H, Hp, St, and P regions of the telencephalon of wild type (AD) and cerebral hernia type (EH) chickens, respectively. In the telencephalon of chickens with cerebral hernia, the number of neurons is sparse with shrinking of the neuron body and nucleus pyknosis in H and Hp regions (E,F). The neurons in the St and P regions had intensely stained signals (G,H). The Hp region in cerebral hernia is located above the black dotted line in image F. (IP) The positive signals of MAP2 are identified in the H, Hp, St, and P regions of the telencephalon of wild type (IL) and cerebral hernia (MP) chickens, respectively. The dendrites are well developed in wild type chickens, while in cerebral hernia chickens, the dendrites are atrophied in the H, Hp, St, and P regions. The neurons and blood vessels are indicated with black and yellow arrows, respectively. Scale bars = 50 µm (all panels).
Figure 6
Figure 6
Immunohistochemistry of GFAP indicates abnormal astrocytes in telencephalon of chickens with cerebral hernia. (AD) The astrocytes detected with GFAP antibodies are present with clear protuberances and even distribution in the H, Hp, St, and P regions of wild type chicken telencephalon, respectively. (EH) The GFAP positive signals are localized in astrocytes in the H, Hp, St, and P regions of telencephalon in cerebral hernia type chickens, respectively. (E) The astrocytes are aggregated at some point in the H region. (F) The astrocytes are irregularly distributed in the Hp region. (G) Compared to wild type chickens, the astrocytes had intensely stained signals in the St region. (H) The protuberances of astrocytes are shrunken and blurred in the P region. Scale bars = 50 µm (all panels).
Figure 7
Figure 7
Methylation levels of GFAP and S100A6 in promoter regions are decreased in telencephalon of cerebral hernia type chickens compared with wild type chickens. (A,B) Cytosine methylation profiles of GFAP promoter sequences in telencephalon of wild type (A) and cerebral hernia type (B) chickens, respectively. The cytosine methylation profiles were detailed as wild type 1 (rows 1, 2, 3, 4, 12, and 13), wild type 2 (rows 5, 6, 7, 9, 10, and 14), wild type 3 (rows 8, 11, 15, 16, 17, and 18), Cerebral hernia type 1 (rows 2, 3, 4, 5, 7, and 13), Cerebral hernia type 2 (rows 6, 8, 10, 11, 14, and 17) and Cerebral hernia type 3 (rows 1, 9, 12, 15, 16, and 18). (C,D) Cytosine methylation profiles of S100A6 promoter sequences in telencephalon of wild type (C) and cerebral hernia type (D) chickens. The cytosine methylation profiles were detailed as wild type 1 (rows 1, 2, 4, 5, 12, and 14), wild type 2 (rows 3, 6, 8, 9, 13, and 17), wild type 3 (rows 7, 10, 11, 15, 16, and 18), Cerebral hernia type 1 (rows 1, 3, 7, 11, 14, and 15), Cerebral hernia type 2 (rows 2, 6, 8, 9, 13, and 16) and Cerebral hernia type 3 (rows 4, 5, 10, 12, 17, and 18). (E,F) Quantitative analysis results for methylation of GFAP and S100A6 promoter sequences between wild type (E) and cerebral hernia type (F) chicken telencephalon, respectively. The methylation levels are both decreased in the GFAP and S100A6 promoter sequences in telencephalon of chickens with cerebral hernia. (G,H) The methylation levels of GFAP (G) and S100A6 (H) promoter regions at each CpG sites are shown by polyline diagram between wild-type and cerebral hernia-type chickens. For the above results, T vector cloning is obtained from three repeated samples, and six positive clones are selected for each biological sample (18 positive clones from three independent samples for each group) to calculate the percentage of methylation. The 18 methylation maps of each group are shown in A, B, C, and D.

Similar articles

Cited by

References

    1. Yoshimura K., Kinoshita K., Mizutani M., Matsuda Y., Saito N. Inheritance and developmental pattern of cerebral hernia in the crested polish chicken. J. Exp. Zool. Part B Mol. Dev. Evol. 2012;318:613–620. doi: 10.1002/jez.b.22464. - DOI - PubMed
    1. Frahm H.D., Rehkamper G. Allometric comparison of the brain and brain structures in the white crested polish chicken with uncrested domestic chicken breeds. Brain Behav. Evol. 1998;52:292–307. doi: 10.1159/000006574. - DOI - PubMed
    1. Fisher R.A. Crest and hernia in fowls due to a single gene without dominance. Science. 1934;80:288–289. doi: 10.1126/science.80.2074.288. - DOI - PubMed
    1. The variation of animals and plants under domestication. Br. Foreign Med. Chir. Rev. 1868;42:143–166. - PMC - PubMed
    1. Wang Y., Gao Y., Imsland F., Gu X., Feng C., Liu R., Song C., Tixier-Boichard M., Gourichon D., Li Q., et al. The crest phenotype in chicken is associated with ectopic expression of hoxc8 in cranial skin. PLoS ONE. 2012;7:e34012. doi: 10.1371/journal.pone.0034012. - DOI - PMC - PubMed

Publication types

LinkOut - more resources