

Evaluation of Hemodialysis Arteriovenous Bruit by Deep Learning
- PMID: 32867220
- PMCID: PMC7506665
- DOI: 10.3390/s20174852
Evaluation of Hemodialysis Arteriovenous Bruit by Deep Learning
Abstract
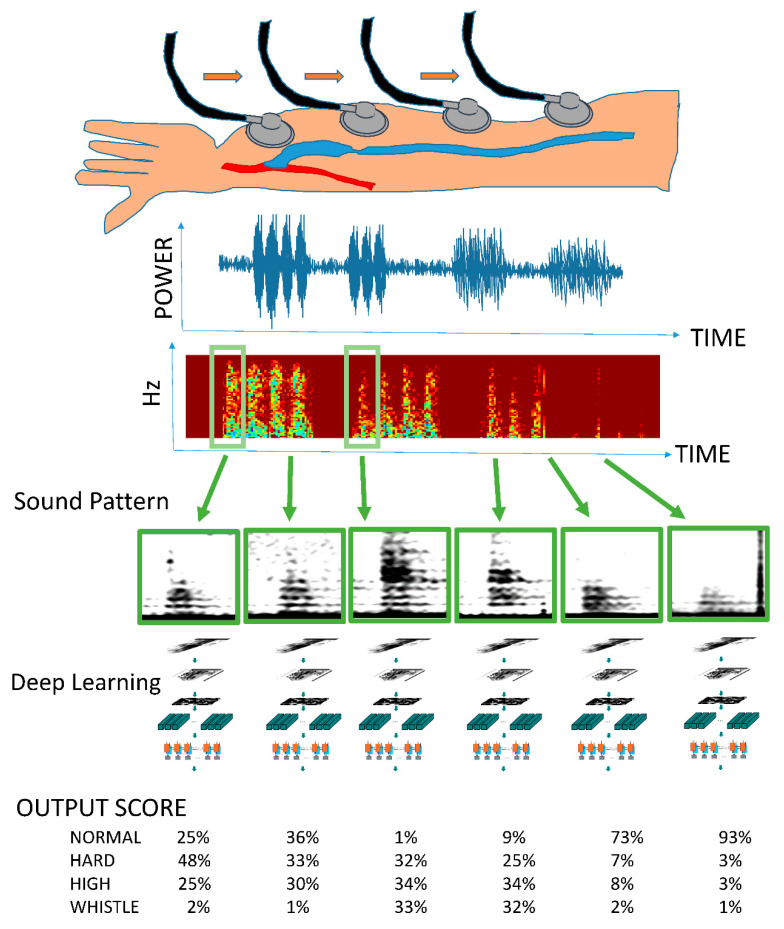
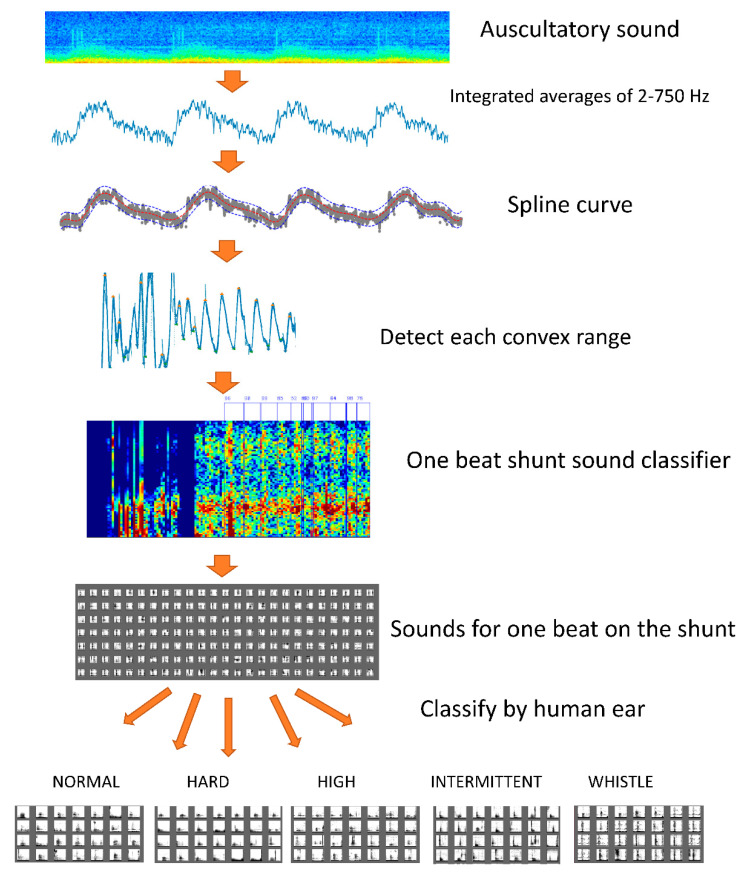
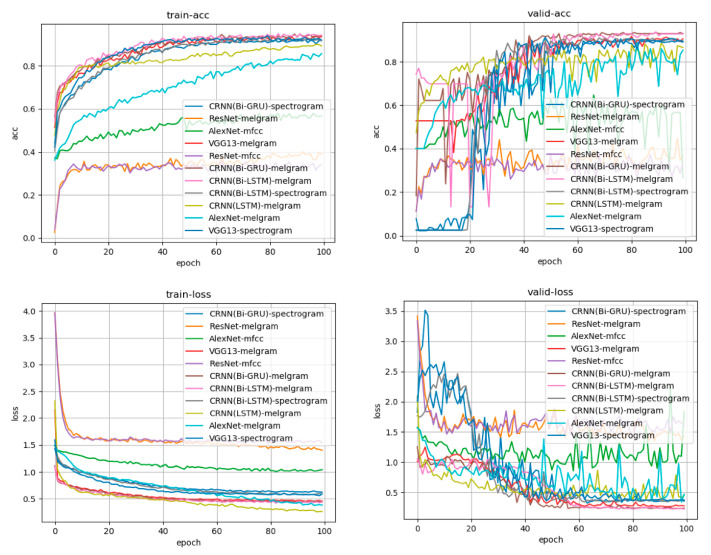
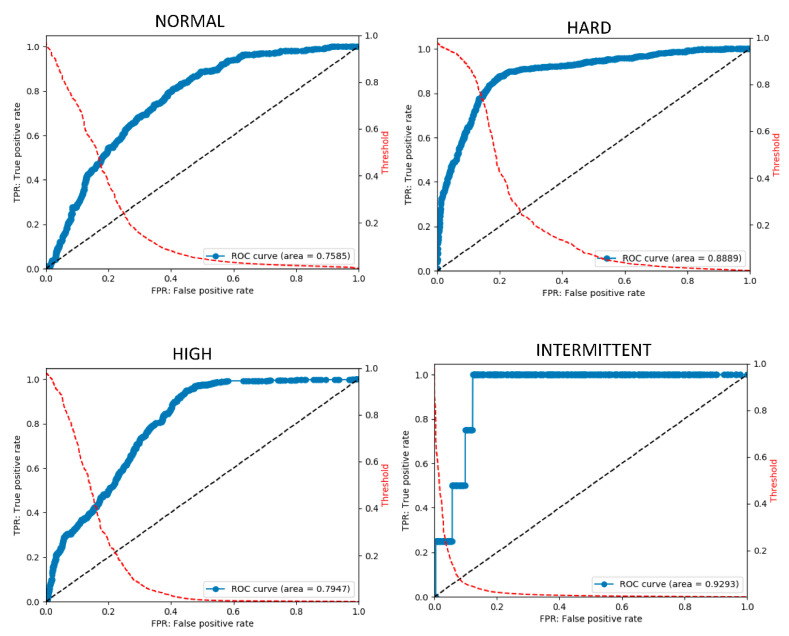
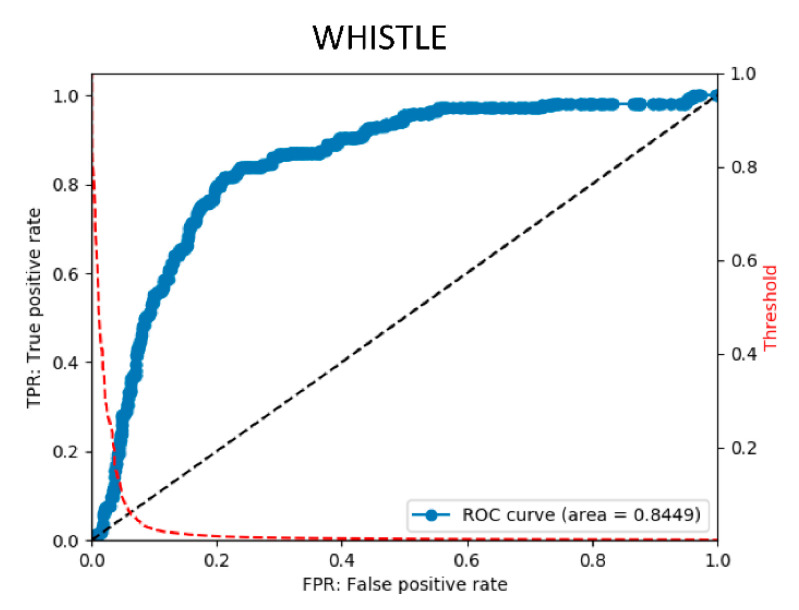
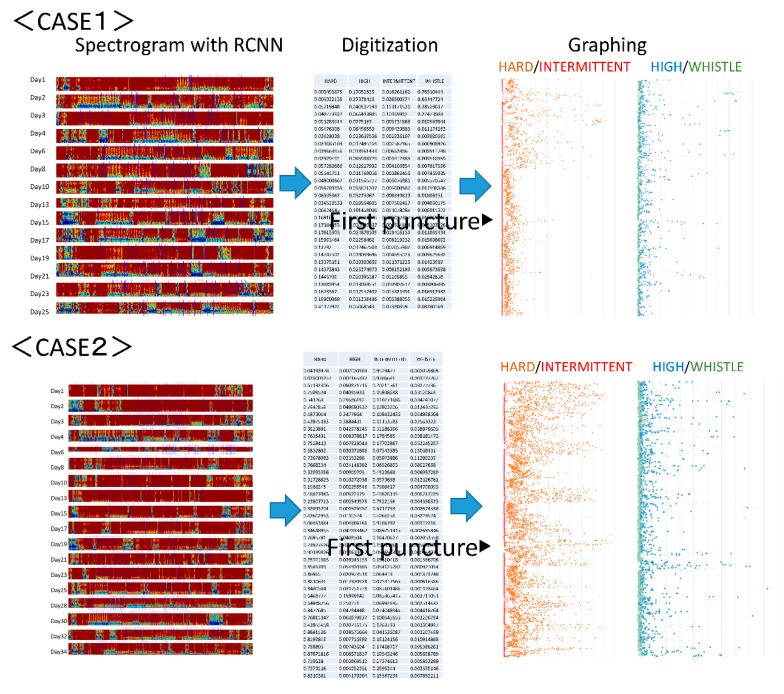
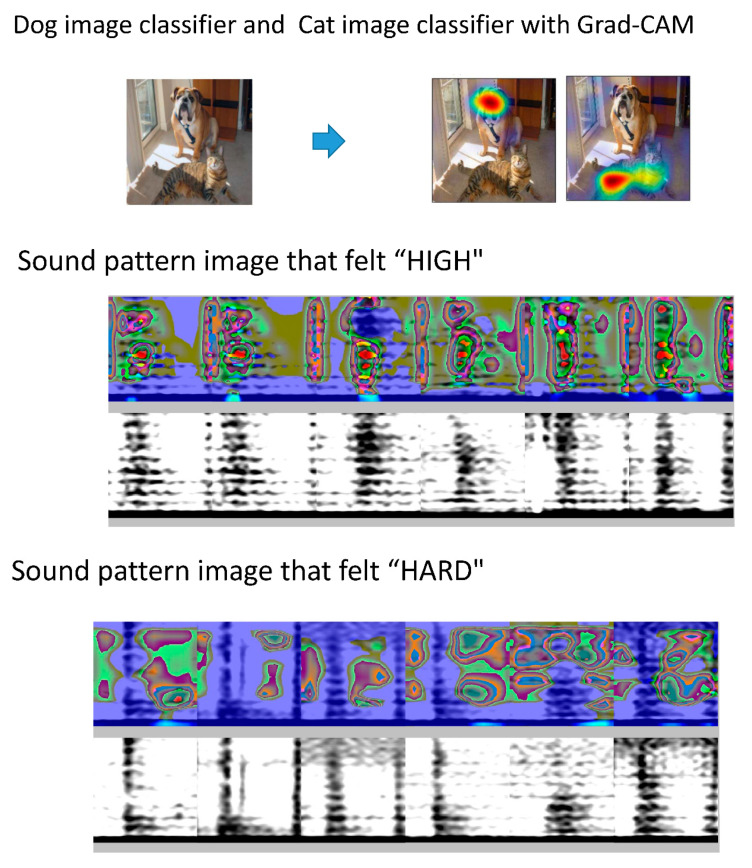
Physical findings of auscultation cannot be quantified at the arteriovenous fistula examination site during daily dialysis treatment. Consequently, minute changes over time cannot be recorded based only on subjective observations. In this study, we sought to supplement the daily arteriovenous fistula consultation for hemodialysis patients by recording the sounds made by the arteriovenous fistula and evaluating the sounds using deep learning methods to provide an objective index. We sampled arteriovenous fistula auscultation sounds (192 kHz, 24 bits) recorded over 1 min from 20 patients. We also extracted arteriovenous fistula sounds for each heartbeat without environmental sound by using a convolutional neural network (CNN) model, which was made by comparing these sound patterns with 5000 environmental sounds. The extracted single-heartbeat arteriovenous fistula sounds were sent to a spectrogram and scored using a CNN learning model with bidirectional long short-term memory, in which the degree of arteriovenous fistula stenosis was assigned to one of five sound types (i.e., normal, hard, high, intermittent, and whistling). After 100 training epochs, the method exhibited an accuracy rate of 70-93%. According to the receiver operating characteristic (ROC) curve, the area under the ROC curves (AUC) was 0.75-0.92. The analysis of arteriovenous fistula sound using deep learning has the potential to be used as an objective index in daily medical care.
Keywords: arteriovenous fistula; artificial intelligence; auscultation; convolutional neural network; deep learning; hemodialysis patient; shunt sound.
Conflict of interest statement
The authors declare no conflict of interest.
Figures
Similar articles
-
Feasibility of Deep Learning-Based Analysis of Auscultation for Screening Significant Stenosis of Native Arteriovenous Fistula for Hemodialysis Requiring Angioplasty.Korean J Radiol. 2022 Oct;23(10):949-958. doi: 10.3348/kjr.2022.0364. Korean J Radiol. 2022. PMID: 36174999 Free PMC article.
-
Prediction of Arteriovenous Access Dysfunction by Mel Spectrogram-based Deep Learning Model.Int J Med Sci. 2024 Aug 19;21(12):2252-2260. doi: 10.7150/ijms.98421. eCollection 2024. Int J Med Sci. 2024. PMID: 39310268 Free PMC article.
-
Evaluation of arteriovenous fistula for hemodialysis with a new generation digital stethoscope: a pilot study.Int Urol Nephrol. 2024 May;56(5):1763-1771. doi: 10.1007/s11255-023-03895-5. Epub 2023 Dec 13. Int Urol Nephrol. 2024. PMID: 38093038
-
Physical examination of the hemodialysis arteriovenous fistula to detect early dysfunction.J Vasc Access. 2019 Jan;20(1):7-11. doi: 10.1177/1129729818768183. Epub 2018 Apr 9. J Vasc Access. 2019. PMID: 29627998 Review.
-
Deep Learning Methods for Heart Sounds Classification: A Systematic Review.Entropy (Basel). 2021 May 26;23(6):667. doi: 10.3390/e23060667. Entropy (Basel). 2021. PMID: 34073201 Free PMC article. Review.
Cited by
-
Arteriovenous Fistula Flow Dysfunction Surveillance: Early Detection Using Pulse Radar Sensor and Machine Learning Classification.Biosensors (Basel). 2021 Aug 26;11(9):297. doi: 10.3390/bios11090297. Biosensors (Basel). 2021. PMID: 34562887 Free PMC article.
-
Classification of arteriovenous fistula sounds using a convolutional block attention module and long short-term memory neural network.Front Physiol. 2024 Dec 24;15:1397317. doi: 10.3389/fphys.2024.1397317. eCollection 2024. Front Physiol. 2024. PMID: 39777357 Free PMC article.
-
Quantification and Visualization of Reliable Hemodynamics Evaluation Based on Non-Contact Arteriovenous Fistula Measurement.Sensors (Basel). 2022 Apr 2;22(7):2745. doi: 10.3390/s22072745. Sensors (Basel). 2022. PMID: 35408356 Free PMC article.
-
An effective AI model for automatically detecting arteriovenous fistula stenosis.Sci Rep. 2023 Oct 17;13(1):17659. doi: 10.1038/s41598-023-35444-6. Sci Rep. 2023. PMID: 37848465 Free PMC article.
-
Risk assessment of arteriovenous fistulas focusing on the relationships between the properties of shunted blood flow sounds and a medical/surgical history of hemodialysis patients.PLoS One. 2025 May 23;20(5):e0324747. doi: 10.1371/journal.pone.0324747. eCollection 2025. PLoS One. 2025. PMID: 40408385 Free PMC article.
References
-
- Schmidli J., Widmer M.K., Basile C., De Donato G., Gallieni M., Gibbons C.P., Haage P., Hamilton G., Hedin U., Kamper L., et al. Editor’s Choice—Vascular Access: 2018 Clinical Practice Guidelines of the European Society for Vascular Surgery (ESVS) Eur. J. Vasc. Endovasc. Surg. 2018;55:757–818. doi: 10.1016/j.ejvs.2018.02.001. - DOI - PubMed
MeSH terms
LinkOut - more resources
Full Text Sources
Medical
