. 2020 Aug 27;10(9):349.
doi: 10.3390/metabo10090349.

Identification of Potential Biomarkers in the Cervicovaginal Fluid by Metabolic Profiling for Preterm Birth

Affiliations

Identification of Potential Biomarkers in the Cervicovaginal Fluid by Metabolic Profiling for Preterm Birth

AbuZar Ansari et al. Metabolites. .

Abstract

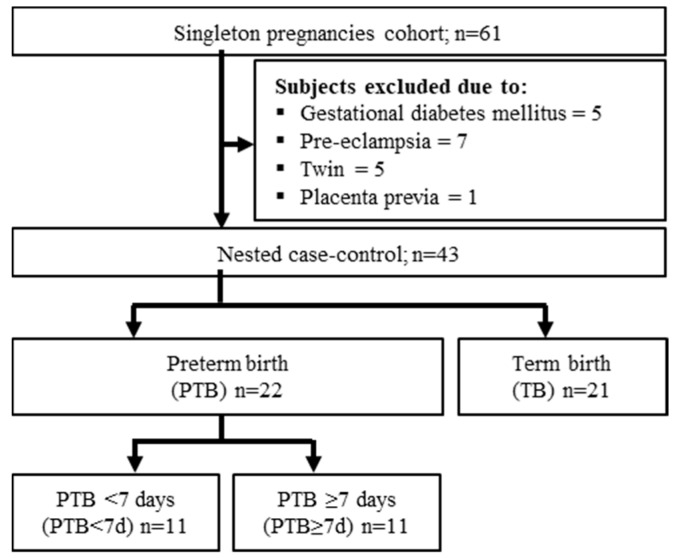
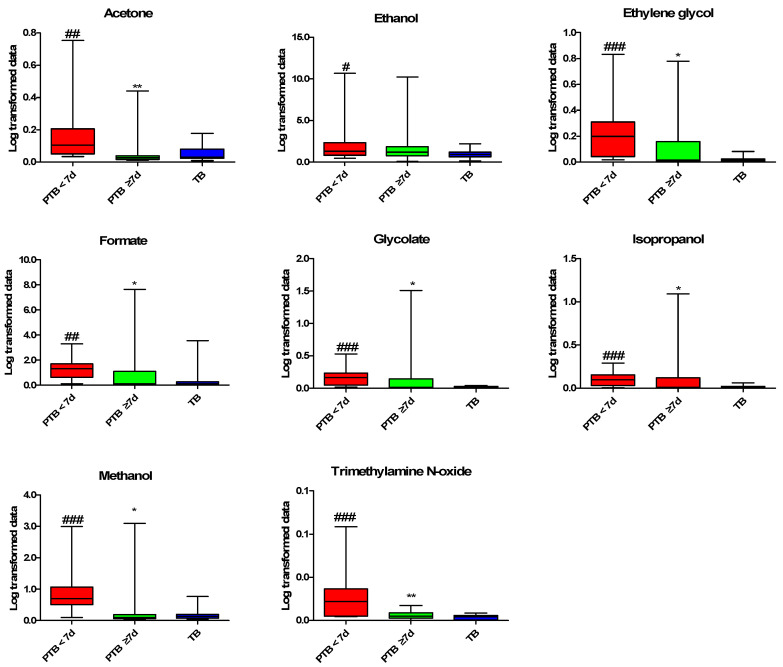
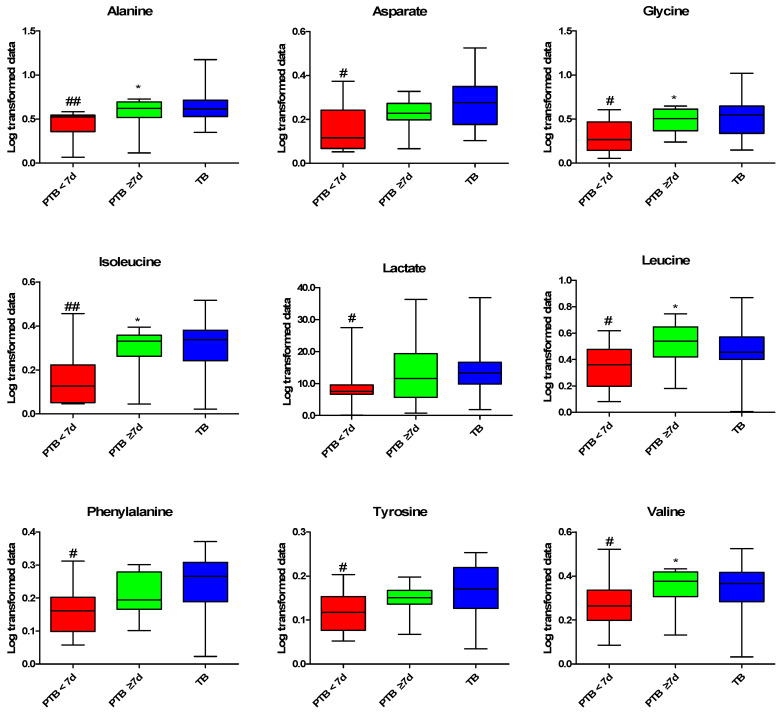
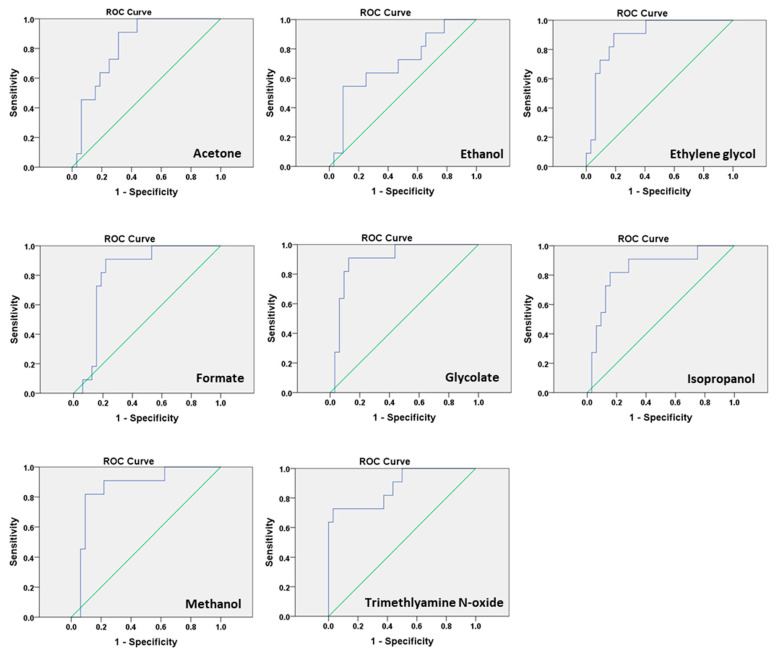
During pregnancy, dysbiosis in the vaginal microbiota directly affects the metabolic profiles, which might impact preterm birth (PTB). In this study, we performed cervicovaginal fluid (CVF) metabolic profiling using nuclear magnetic resonance (NMR) spectroscopy and identified the metabolic markers for predicting PTB. In this nested case-control study, 43 South Korean pregnant women with PTB (n = 22), and term birth (TB; n = 21) were enrolled with their demographic profiles, and CVF samples were collected by vaginal swabs. The PTB group had two subgroups based on post-CVF sampling birth: PTB less than (PTB < 7 d) and more than 7 days (PTB ≥ 7 d). We observed significant differences in the gestational age at birth (GAB), cervical length (CL), and neonatal birth weight among the groups. The principal component analysis (PCA), and partial least square discriminant analysis (PLS-DA) scatter plot showed the separation between the PTB < 7 d group, and the TB group. Out of 28 identified metabolites, acetone, ethanol, ethylene glycol, formate, glycolate, isopropanol, methanol, and trimethylamine N-oxide (TMAO) were significantly increased in the PTB group compared with the TB group. The ROC curve analysis revealed that the acetone, ethylene glycol, formate, glycolate, isopropanol, methanol, and TMAO had the best predictive values for PTB. Additionally, the correlation analysis of these metabolites showed a strong negative correlation with GAB and CL. These metabolites could be beneficial markers for the clinical application of PTB prediction.

Keywords: cervicovaginal fluid; dysbiosis; metabolite; microbiota; preterm birth.


Conflict of interest statement

The authors declare no conflict of interest.

Figures

Figure 1
Figure 1
Study flowchart for the subject selection criteria. PTB: preterm birth; TB term birth; PTB < 7 d: preterm birth less than 7 days after cervicovaginal fluid (CVF) sampling, PTB ≥ 7 d: preterm birth more than 7 days after CVF sampling.
Figure 2
Figure 2
Increased metabolites profiling in CVF samples. Kruskal–Wallis test was used for statistical analysis. The PQN Log-transformed data were used for graphical representation. Data are presented as the mean ± standard deviation, and p < 0.05 considered as significant. #: PTB < 7 d vs. TB; *: PTB < 7 d vs. PTB ≥ 7 d. # p < 0.05, ## p < 0.01, ### p < 0.001, * p < 0.05, ** p < 0.01. PTB: preterm birth; PTB < 7 d: preterm birth less than 7 days after CVF sampling (n = 11); PTB ≥ 7 d: preterm birth more than 7 days after CVF sampling (n = 11); and TB: term birth (n = 21). PQN: Probabilistic quotient normalization.
Figure 3
Figure 3
Decreased metabolites profiling in CVF. Kruskal–Wallis test was used for the statistical analysis. The PQN Log-transformed data were used for graphical representation Data are presented as the ± standard deviation, and p < 0.05 considered as significant. #: PTB < 7 d vs. TB, *: PTB < 7 d vs. PTB ≥ 7 d. # p < 0.05, ## p < 0.01, * p < 005. PTB: preterm birth; PTB < 7 d: preterm birth less than 7 days after CVF sampling (n = 11); PTB > 7 d: preterm birth more than 7 days after CVF sampling (n = 11); and TB: term birth (n = 21). PQN: Probabilistic quotient normalization.
Figure 4
Figure 4
Receiver operating characteristics (ROC) curve analysis for metabolites: predictive performance of the biomarker for preterm birth using ROC curves of sensitivity and specificity.

References

    1. Beck S., Wojdyla D., Say L., Betran A.P., Merialdi M., Requejo J.H., Rubens C., Menon R., Van Look P.F.A. The worldwide incidence of preterm birth: A systematic review of maternal mortality and morbidity. Bull. World Health Organ. 2010;88:31–38. doi: 10.2471/BLT.08.062554. - DOI - PMC - PubMed
    1. Gordon A.L., English M., Tumaini Dzombo J., Karisa M., Newton C.R.J. Neurological and developmental outcome of neonatal jaundice and sepsis in rural Kenya. Trop. Med. Int. Health. 2005;10:1114–1120. doi: 10.1111/j.1365-3156.2005.01496.x. - DOI - PubMed
    1. Lawn J.E., Cousens S., Zupan J. 4 million neonatal deaths: When? Where? Why? Lancet. 2005;365:891–900. doi: 10.1016/S0140-6736(05)71048-5. - DOI - PubMed
    1. Pennefather P., Tin W. Ocular abnormalities associated with cerebral palsy after preterm birth. Eye. 2000;14:78–81. doi: 10.1038/eye.2000.17. - DOI - PubMed
    1. Blencowe H., Cousens S., Chou D., Oestergaard M., Say L., Moller A.-B., Kinney M., Lawn J. Born too soon: The global epidemiology of 15 million preterm births. Reprod. Health. 2013;10:S2. doi: 10.1186/1742-4755-10-S1-S2. - DOI - PMC - PubMed

LinkOut - more resources