. 2020 Aug 27;21(17):6198.
doi: 10.3390/ijms21176198.

Knockout of stim2a Increases Calcium Oscillations in Neurons and Induces Hyperactive-Like Phenotype in Zebrafish Larvae

Affiliations

Knockout of stim2a Increases Calcium Oscillations in Neurons and Induces Hyperactive-Like Phenotype in Zebrafish Larvae

Rishikesh Kumar Gupta et al. Int J Mol Sci. .

Abstract

Stromal interaction molecule (STIM) proteins play a crucial role in store-operated calcium entry (SOCE) as endoplasmic reticulum Ca2+ sensors. In neurons, STIM2 was shown to have distinct functions from STIM1. However, its role in brain activity and behavior was not fully elucidated. The present study analyzed behavior in zebrafish (Danio rerio) that lacked stim2a. The mutant animals had no morphological abnormalities and were fertile. RNA-sequencing revealed alterations of the expression of transcription factor genes and several members of the calcium toolkit. Neuronal Ca2+ activity was measured in vivo in neurons that expressed the GCaMP5G sensor. Optic tectum neurons in stim2a-/- fish had more frequent Ca2+ signal oscillations compared with neurons in wildtype (WT) fish. We detected an increase in activity during the visual-motor response test, an increase in thigmotaxis in the open field test, and the disruption of phototaxis in the dark/light preference test in stim2a-/- mutants compared with WT. Both groups of animals reacted to glutamate and pentylenetetrazol with an increase in activity during the visual-motor response test, with no major differences between groups. Altogether, our results suggest that the hyperactive-like phenotype of stim2a-/- mutant zebrafish is caused by the dysregulation of Ca2+ homeostasis and signaling.

Keywords: PTZ; SOCE; Stim2a; behavioral tests; calcium toolkit; glutamate; hyperactivity; zebrafish.


Conflict of interest statement

The authors declare no conflict of interest.

Figures

Figure 1
Figure 1
Generation of stim2a−/− mutant line. (A) Schematic illustration of Stim2a protein domains. SP, signal peptide; EF/SAM, EF-hand/sterile α-motif (EF/SAM) Ca2+-binding endoplasmic reticulum (ER)-luminal domain; TM, transmembrane domain; SOAR/CAD, STIM1 Orai1-activating region/CRAC-activating domain. Numbers indicate amino acid positions. The red arrow indicates the site of the stop codon introduction. (B) Representative gel electrophoresis of the restriction length fragment polymorphism (RLFP) analysis of genotypes (white arrows indicate wildtype (WT) fragments after the cutting) of the PCR product. The mutant is not cleaved.
Figure 2
Figure 2
The survival and morphology of stim2a−/− zebrafish did not differ from WT animals. (A) Percentage of surviving WT and stim2a−/− zebrafish during the first 120 h of development. The data are expressed as the mean ± SEM. Number of repetitions: 3. Number of larvae for each repetition: 200. (B) Side views of stim2a−/− and WT zebrafish at 5 dpf. Scale bars = 500 µm.
Figure 3
Figure 3
Schematic representations of the experimental setup. (A) Open field test in a 12-well plate. (B) Light/dark preference test in a 10 cm Petri dish. (C) Visual–motor response protocol.
Figure 4
Figure 4
Higher thigmotaxis in stim2a−/− zebrafish in the open field test adopted for zebrafish larvae. Activity of the larvae was recorded for 15 min in a 12-well plate. The experiment was divided into three phases, 5 min each (0–5 min, 5–10 min, and 10–15 min). Fish that did not move were not included in the analysis. (A) Box plots show the distance traveled (in millimeters) in WT and stim2a−/− fish at either the edge of the well or in the center. (B) Box plots of the time spent moving (duration of movement) while swimming either at the edge of the well or in the center. (C) Box plots show the maximum acceleration (in millimeters per squared second) of WT and stim2a−/− fish in total throughout the well. (D) Heat maps show the total distance covered by the larvae in each phase of the experiment. * p < 0.05, *** p < 0.001 (paired Wilcoxon rank-sum test for comparisons between the edge and center; unpaired Wilcoxon rank-sum test for comparisons between WT and stim2a−/− mutants). n = 32 for WT larvae. n = 33 stim2a−/− larvae. Number of experiments: 3.
Figure 4
Figure 4
Higher thigmotaxis in stim2a−/− zebrafish in the open field test adopted for zebrafish larvae. Activity of the larvae was recorded for 15 min in a 12-well plate. The experiment was divided into three phases, 5 min each (0–5 min, 5–10 min, and 10–15 min). Fish that did not move were not included in the analysis. (A) Box plots show the distance traveled (in millimeters) in WT and stim2a−/− fish at either the edge of the well or in the center. (B) Box plots of the time spent moving (duration of movement) while swimming either at the edge of the well or in the center. (C) Box plots show the maximum acceleration (in millimeters per squared second) of WT and stim2a−/− fish in total throughout the well. (D) Heat maps show the total distance covered by the larvae in each phase of the experiment. * p < 0.05, *** p < 0.001 (paired Wilcoxon rank-sum test for comparisons between the edge and center; unpaired Wilcoxon rank-sum test for comparisons between WT and stim2a−/− mutants). n = 32 for WT larvae. n = 33 stim2a−/− larvae. Number of experiments: 3.
Figure 5
Figure 5
Hyperactivity and lower phototaxis in stim2a−/− fish in the light/dark preference test. This test was performed for 15 min, during which half of the Petri dish was covered with a photographic filter that blocked the light. (A) Box plots of the distance traveled (in millimeters) in the light and dark zones of the Petri dish in the WT and stim2a−/− larvae. (B) Box plots of the time spent moving (duration of movement) in the light and dark zones in WT and stim2a−/− larvae. (C) Box plots of the cumulative distance traveled (in millimeters) during the experiment by the WT and stim2a−/− larvae. * p < 0.05, *** p < 0.001 (paired Wilcoxon rank-sum test for comparisons between the light and dark zones; unpaired Wilcoxon rank-sum test for comparisons between WT and stim2a−/− larvae). n = 10 WT larvae. n = 11 stim2a−/− larvae. Number of experiments: 5.
Figure 6
Figure 6
The stim2a−/− larvae reacted to changes in the light and exhibited hyperactivity during the low activity phase in the visual–motor response test. Activity was recorded during a 30 min period that consisted of a baseline phase (basal, 0% light illumination), low activity phase (light; 70% light illumination), and high activity phase (dark; 0% light illumination). Box plots show the distance traveled (in millimeters) during the respective phase. *** p < 0.001 (Wilcoxon rank-sum test). n = 53 WT larvae. n = 52 stim2a−/− larvae. Number of experiments: 6.
Figure 7
Figure 7
Increase in the spike frequency of neurons in stim2a-deficient zebrafish. For in vivo Ca2+ imaging, WT and stim2a−/− zebrafish that expressed GCaMP5G under the pan-neuronal HuC promoter were used. Zebrafish neurons from the periventricular gray zone of the optic tectum were analyzed. (A) Box plots show the basal level (in E3 water) average oscillation frequency (in Hz). (B) The basal level (in E3 water) average calcium oscillation amplitude (AU). Number of cells: 168 WT, 392 stim2a−/− (C) Box plots show the average oscillation frequency (in Hz) after treatment with 600 μM glutamate. (D) Average calcium oscillation amplitude (AU) after treatment with 600 μM glutamate. Number of cells: 276 WT, 166 stim2a−/−. The Wilcoxon rank-sum test was performed to compare in vivo Ca2+ responses of the brain between WT and stim2a−/− animals. Number of animals: 3 WT, 7 stim2a−/−. *** p < 0.001.
Figure 8
Figure 8
Exposure to Pentylenetetrazol (PTZ) and glutamate did not induce additional hyperactivity in stim2a−/− larvae. (A) Box plots of the distance traveled (in millimeters) in WT and stim2a−/− larvae that were treated with PTZ. (B) Box plots of the distance traveled (in millimeters) in WT and stim2a−/− larvae that were treated with glutamate. Activity was recorded during a 30 min period that consisted of a baseline phase (basal, 0% light illumination), low activity phase (light, 70% light illumination), and high activity phase (dark, 0% light illumination). Before the experiment, half of the medium was exchanged for either PTZ solution (15 mM final concentration) or glutamate solution (600 μM). –, untreated; +, treated. * p < 0.05, *** p < 0.001 (Wilcoxon rank-sum test). n = 18 larvae/group for the PTZ treatment. n = 36 WT larvae and n = 35 for stim2a−/− larvae for the glutamate treatment. Number of experiments: 3.
Figure 9
Figure 9
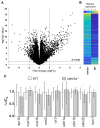
RNA sequencing analysis. (A) Volcano plot of the transcriptional differences between the stim2a−/− and WT zebrafish larvae. The logarithms of the fold changes in the individual genes (x axis) are plotted against negative logarithms of their p-value to base 10 (y axis). Positive log2 (fold change) values represent the upregulation in stim2a−/− larvae compared with WT larvae, and negative log2 (fold change) values represent downregulation. Points above the dotted line represent differentially expressed genes in stim2a−/− larvae with p < 0.05 after correction for multiple testing. (B) Heat map of a total of 392 genes that were identified as being differentially expressed (log2 (fold change) ≥ 2) between the stim2a−/− and WT larvae, including 336 upregulated genes and 56 downregulated genes. (C) mRNA levels of store-operated calcium entry (SOCE) components in 5 dpf zebrafish, quantified by qPCR.
Figure 10
Figure 10
PANTHER Gene Ontology annotation analysis [58]. The distribution of gene ontology (GO) terms was categorized based on PANTHER GO-Slim. (A) Cellular Component GO terms (components of cells or extracellular) with 538 component hits. (B) Molecular Function GO terms (basic activities of a gene product at the molecular level, such as binding or catalysis) with 170 function hits.

Similar articles

Cited by

References

    1. Wegierski T., Kuznicki J. Neuronal calcium signaling via store-operated channels in health and disease. Cell Calcium. 2018;74:102–111. doi: 10.1016/j.ceca.2018.07.001. - DOI - PubMed
    1. Kim J.Y., Muallem S. Unlocking SOAR releases STIM. EMBO J. 2011;30:1673–1675. doi: 10.1038/emboj.2011.107. - DOI - PMC - PubMed
    1. Novello M.J., Zhu J., Feng Q., Ikura M., Stathopulos P.B. Structural elements of stromal interaction molecule function. Cell Calcium. 2018;73:88–94. doi: 10.1016/j.ceca.2018.04.006. - DOI - PubMed
    1. Ong H.L., Subedi K.P., Son G.Y., Liu X., Ambudkar I.S. Tuning store-operated calcium entry to modulate Ca2+-dependent physiological processes. Biochim. Biophys. Acta Mol. Cell Res. 2019;1866:1037–1045. doi: 10.1016/j.bbamcr.2018.11.018. - DOI - PubMed
    1. Feske S., Gwack Y., Prakriya M., Srikanth S., Puppel S.-H.H., Tanasa B., Hogan P.G., Lewis R.S., Daly M., Rao A. A mutation in Orai1 causes immune deficiency by abrogating CRAC channel function. Nature. 2006;441:179–185. doi: 10.1038/nature04702. - DOI - PubMed

LinkOut - more resources