. 2020 Aug 27;21(17):6203.
doi: 10.3390/ijms21176203.

Potential Associations Among Alteration of Salivary miRNAs, Saliva Microbiome Structure, and Cognitive Impairments in Autistic Children

Affiliations

Potential Associations Among Alteration of Salivary miRNAs, Saliva Microbiome Structure, and Cognitive Impairments in Autistic Children

Marco Ragusa et al. Int J Mol Sci. .

Abstract

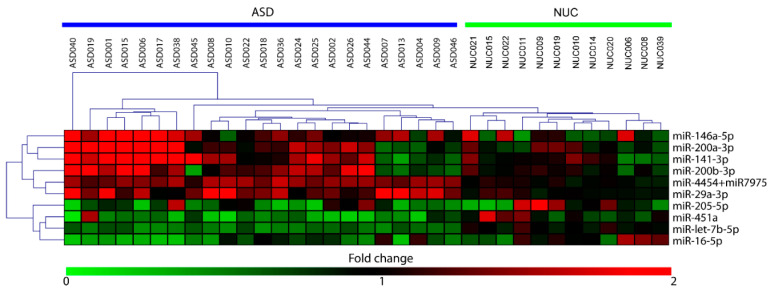
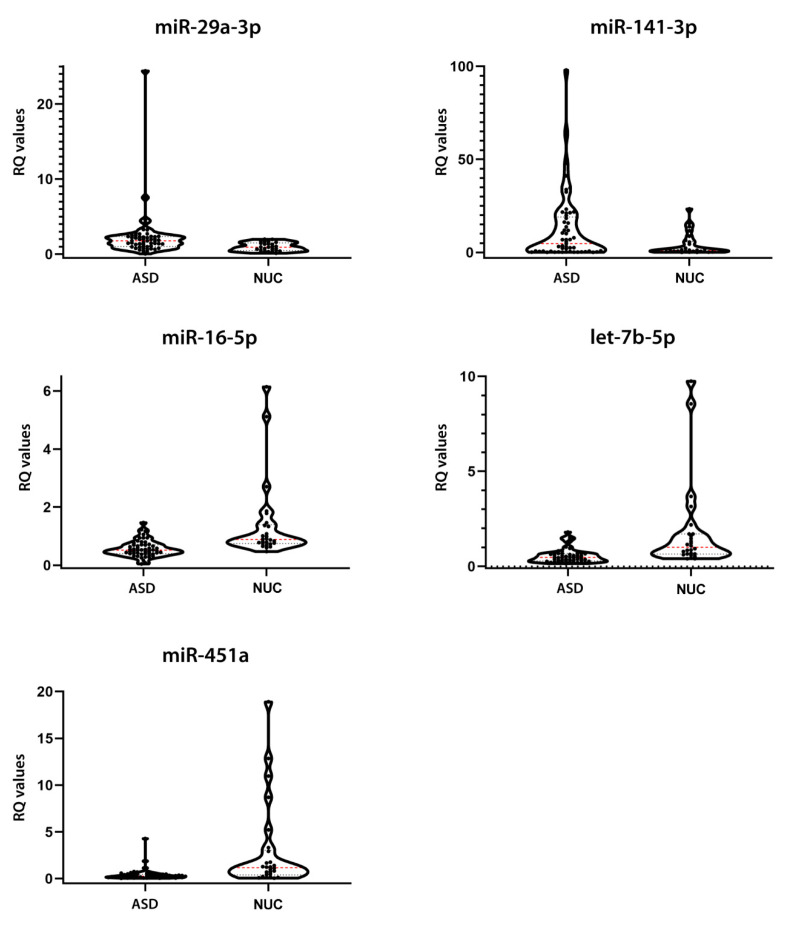
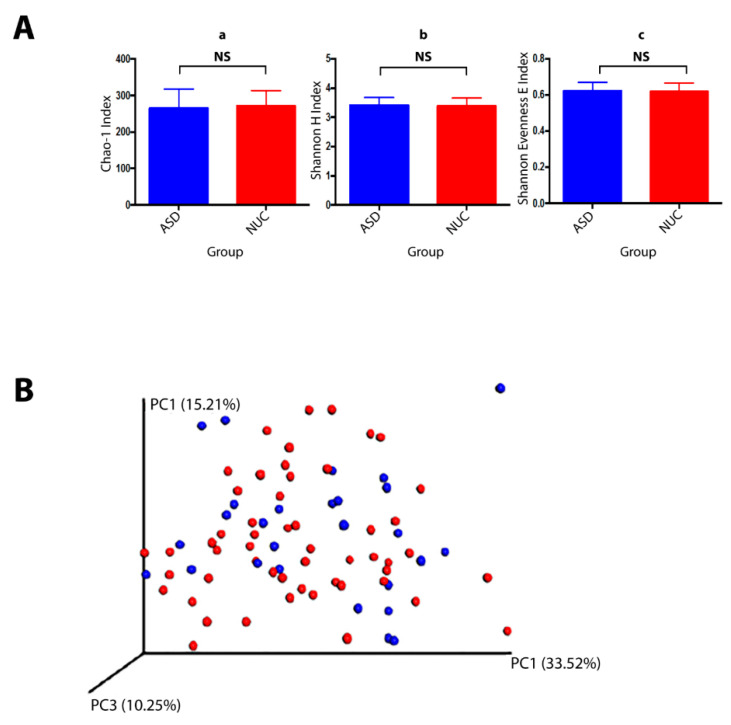
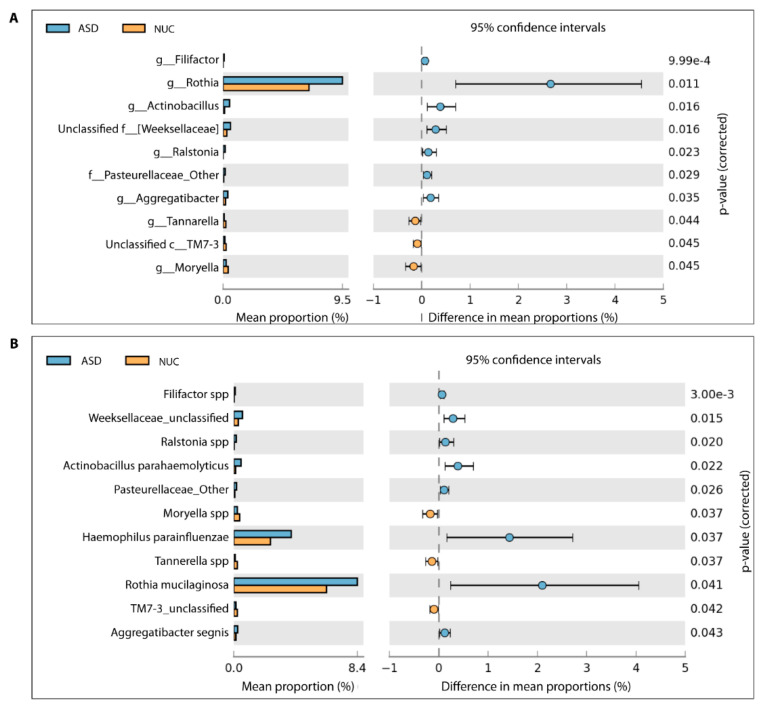
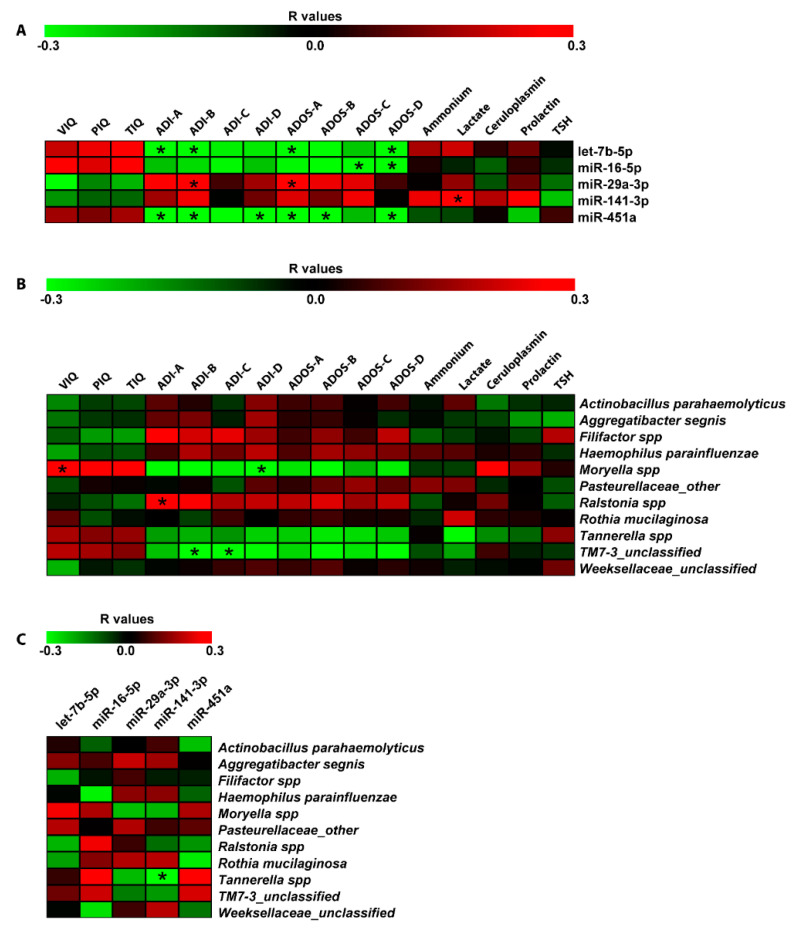
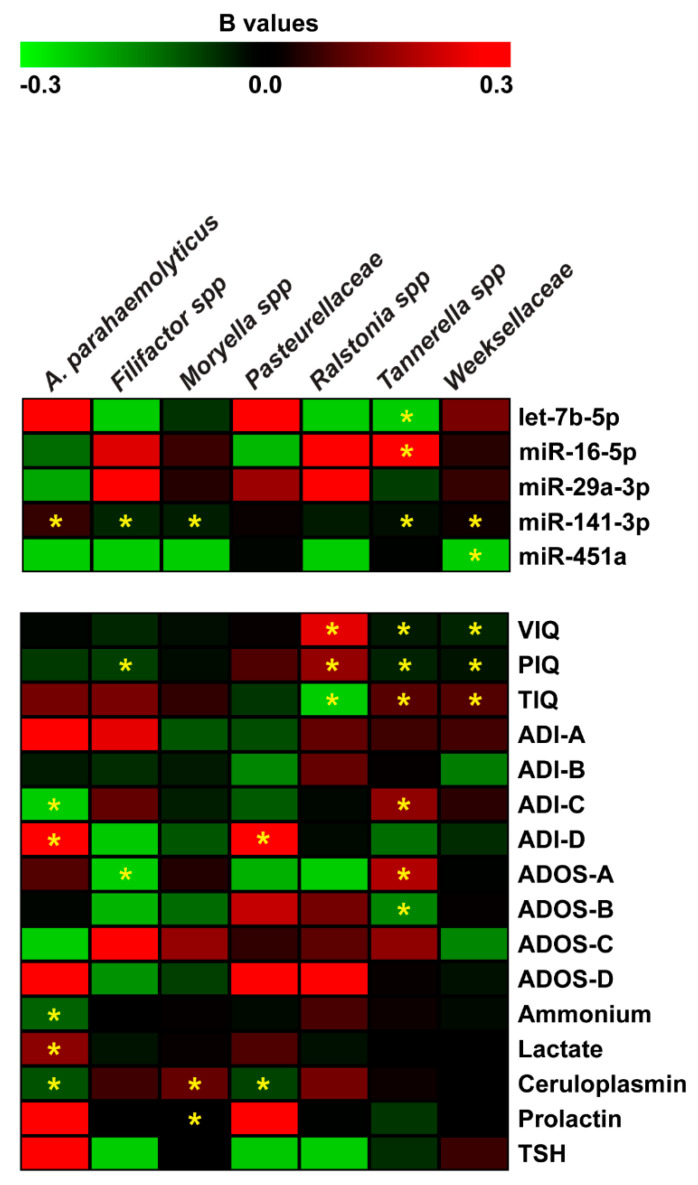
Recent evidence has demonstrated that salivary molecules, as well as bacterial populations, can be perturbed by several pathological conditions, including neuro-psychiatric diseases. This relationship between brain functionality and saliva composition could be exploited to unveil new pathological mechanisms of elusive diseases, such as Autistic Spectrum Disorder (ASD). We performed a combined approach of miRNA expression profiling by NanoString technology, followed by validation experiments in qPCR, and 16S rRNA microbiome analysis on saliva from 53 ASD and 27 neurologically unaffected control (NUC) children. MiR-29a-3p and miR-141-3p were upregulated, while miR-16-5p, let-7b-5p, and miR-451a were downregulated in ASD compared to NUCs. Microbiome analysis on the same subjects revealed that Rothia, Filifactor, Actinobacillus, Weeksellaceae, Ralstonia, Pasteurellaceae, and Aggregatibacter increased their abundance in ASD patients, while Tannerella, Moryella and TM7-3 decreased. Variations of both miRNAs and microbes were statistically associated to different neuropsychological scores related to anomalies in social interaction and communication. Among miRNA/bacteria associations, the most relevant was the negative correlation between salivary miR-141-3p expression and Tannerella abundance. MiRNA and microbiome dysregulations found in the saliva of ASD children are potentially associated with cognitive impairments of the subjects. Furthermore, a potential cross-talking between circulating miRNAs and resident bacteria could occur in saliva of ASD.

Keywords: ASD; Illumina; Nanostring; TaqMan assays; correlations; dysbiosis; microRNA; oral cavity; oral microbiota.


Conflict of interest statement

The authors declare no conflict of interest.

Figures

Figure 1
Figure 1
Heat-map of differentially expressed (DE)-miRNAs in saliva of Autistic Spectrum Disorder (ASD) and neurologically unaffected control (NUC) individuals. Heat-map of the miRNAs differentially expressed in saliva of ASD and NUC patients. The values of fold changes for each miRNA are color coded, as shown in the colored bar. The matrix was generated by plotting the fold changes calculated as the ratio between the normalized counts of each sample and the mean of normalized counts of all NUC samples. Sample clustering obtained through hierarchical clustering (Manhattan distance metric) approach is shown.
Figure 2
Figure 2
Expression validation of the 5 candidate salivary miRNAs. Violin plots of relative expression of the 5 miRNAs showing a statistically significant dysregulation in the validation group, assessed by Single TaqMan Assays: miR-29a-3p, miR-141-3p, miR-16-5p, let-7b-5p, and miR-451a. The black dots represent the samples; the dashed red line represents the median value; the dashed black line represents the quartiles.
Figure 3
Figure 3
Bacterial community structures of the salivary microbiome in children with ASD and NUC groups. (A) Structural comparison of α-diversity of the salivary microbiome. Sequences were randomly subsampled at the rarefaction point (74,469) from dataset. Chao-1 index (a, community richness), Shannon H index (b, diversity), Shannon E index (c, evenness) were calculated for saliva samples. The bars depict mean ± SD of relative abundance rates. NS, p > 0.05. ASD (salivary samples n = 53), NUC (salivary samples collected from healthy controls, n = 27). (B) β-diversity. PCoA plot generated using weighted UniFrac distances shows none differences between the two groups (ASD in red and NUC in blue).
Figure 4
Figure 4
Different bacterial abundance in saliva of ASD and NUC groups. Statistical analysis of the bacterial abundance at genus (A) and species level (B) in ASD and NUC groups by applying a two-sided White’s non-parametric t-test.
Figure 5
Figure 5
Correlation analysis of miRNA expression, microbiome Operational taxonomic Units (OTUs), neuropsychiatric/metabolic parameters in saliva. Correlation matrices built by calculating spearman correlation coefficients for (A) miRNA expression and neuropsychiatric/metabolic parameters; (B) microbiome OTUs and neuropsychiatric/metabolic parameters; and (C) microbiome OTUs and miRNA expression. The correlation coefficient is indicated by a color gradient from green (negative correlation) to red (positive correlation), as shown in the colored bar. Statistically significant p-values corrected for multiple comparisons by using Bonferroni–Šídák approach are indicated by asterisks. VIQ: Verbal Intelligence Quotient; PIQ: performance Intelligence Quotient, TIQ: Total Intelligence Quotient; ADOS-A: Communication; ADOS-B: Social Interaction; ADOS-C: Imagination; ADOS-D: Repetitive and Restricted Behavior; ADI-A: Qualitative anomalies in social interaction; ADI-B: Qualitative anomalies in communication; ADI-C: Repetitive and restricted behavior; ADI-D: Anomalies in neurodevelopment arisen before 36 months old.
Figure 6
Figure 6
Negative binomial regression analysis between miRNA expression, neuropsychiatric/metabolic parameters and microbiome abundance. Coefficient regression matrix from negative binomial regression model predicting abundances of microbiome species. The regression coefficient is indicated by a color gradient from green (negative prediction) to red (positive prediction), as shown in the colored bar. Statistically significant p-values are indicated by asterisks.
Figure 7
Figure 7
Functional Enrichment analysis of DE miRNAs. Functional enrichment analysis of miRNA targets within KEGG (Kyoto Encyclopedia of Genes and Genomes) pathways (A) and Reactome database (B) by DIANA-mirPath v.3 web server and miRNet tool, respectively.

References

    1. Fakhoury M. Autistic spectrum disorders: A review of clinical features, theories and diagnosis. Int. J. Dev. Neurosci. 2015;43:70–77. doi: 10.1016/j.ijdevneu.2015.04.003. - DOI - PubMed
    1. Abdolmaleky H.M., Zhou J.R., Thiagalingam S. An update on the epigenetics of psychotic diseases and autism. Epigenomics. 2015;7:427–449. doi: 10.2217/epi.14.85. - DOI - PubMed
    1. Nardone S., Elliott E. The Interaction between the Immune System and Epigenetics in the Etiology of Autism Spectrum Disorders. Front. Neurosci. 2016;10:329. doi: 10.3389/fnins.2016.00329. - DOI - PMC - PubMed
    1. Sun W., Poschmann J., Cruz-Herrera Del Rosario R., Parikshak N.N., Hajan H.S., Kumar V., Ramasamy R., Belgard T.G., Elanggovan B., Wong C.C.Y., et al. Histone Acetylome-wide Association Study of Autism Spectrum Disorder. Cell. 2016;167:1385–1397. doi: 10.1016/j.cell.2016.10.031. - DOI - PubMed
    1. Muhle R.A., Reed H.E., Stratigos K.A., Veenstra-VanderWeele J. The Emerging Clinical Neuroscience of Autism Spectrum Disorder: A Review. JAMA Psychiatry. 2018;75:514–523. doi: 10.1001/jamapsychiatry.2017.4685. - DOI - PubMed