

Extraction, Enrichment, and LC-MS n-Based Characterization of Phlorotannins and Related Phenolics from the Brown Seaweed, Ascophyllum nodosum
- PMID: 32867333
- PMCID: PMC7551814
- DOI: 10.3390/md18090448
Extraction, Enrichment, and LC-MS n-Based Characterization of Phlorotannins and Related Phenolics from the Brown Seaweed, Ascophyllum nodosum
Abstract
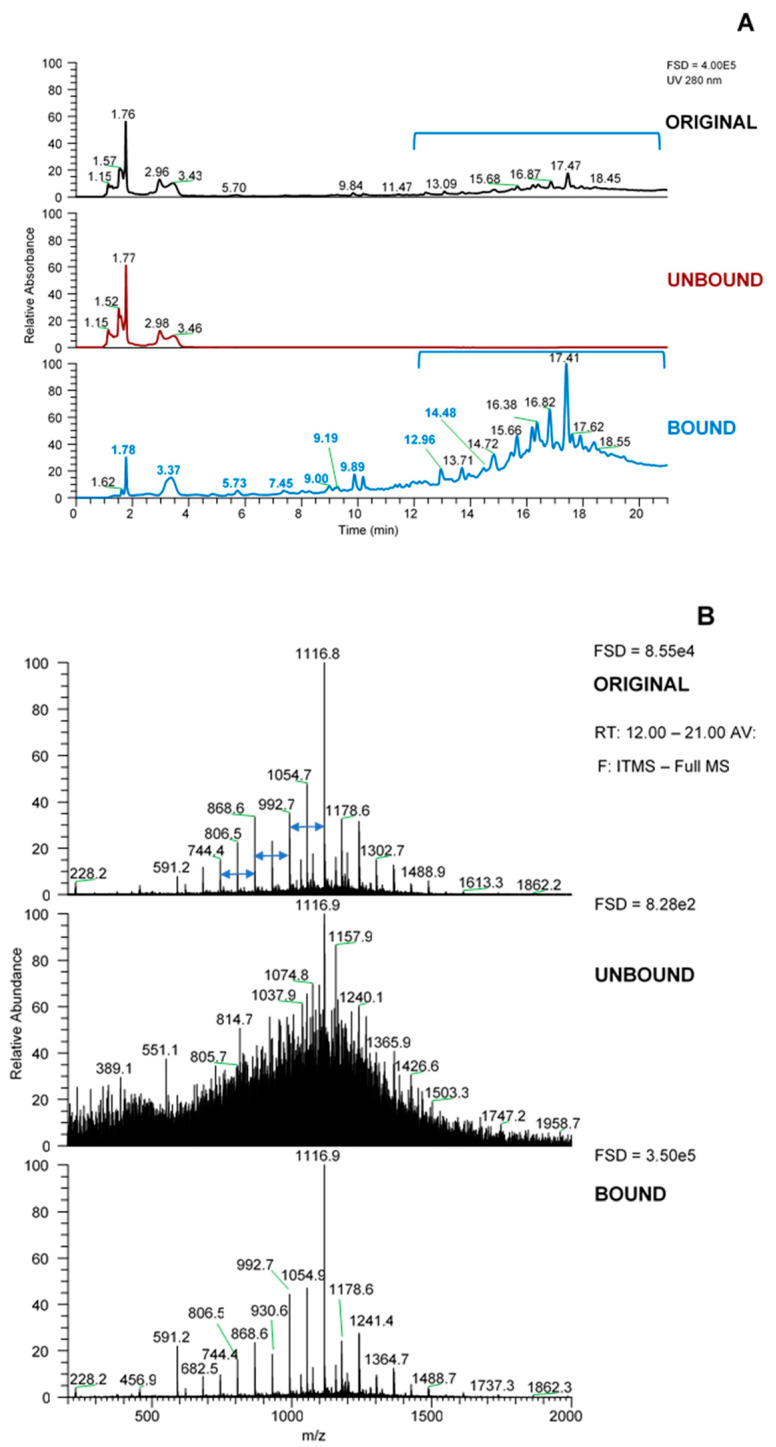
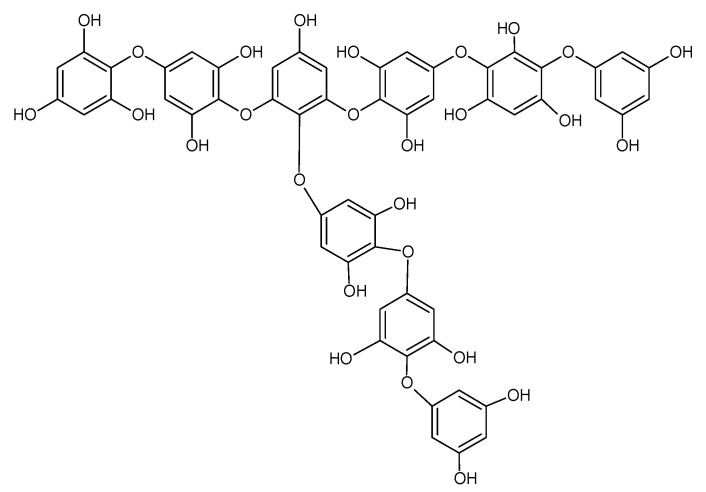
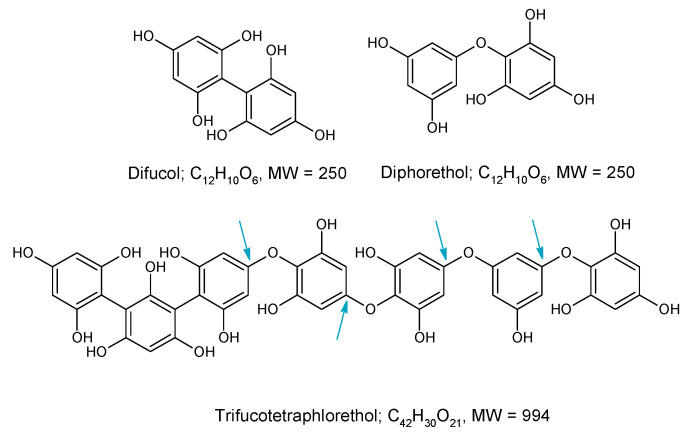
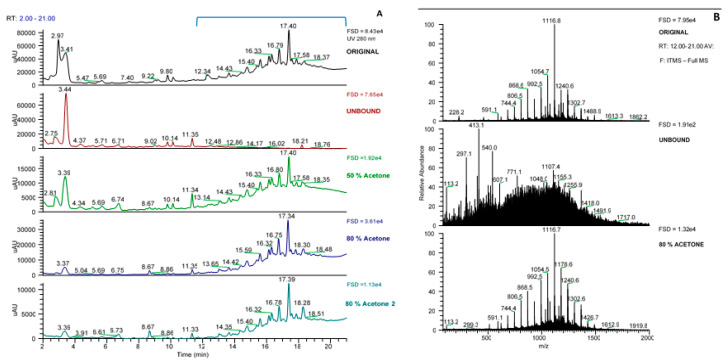
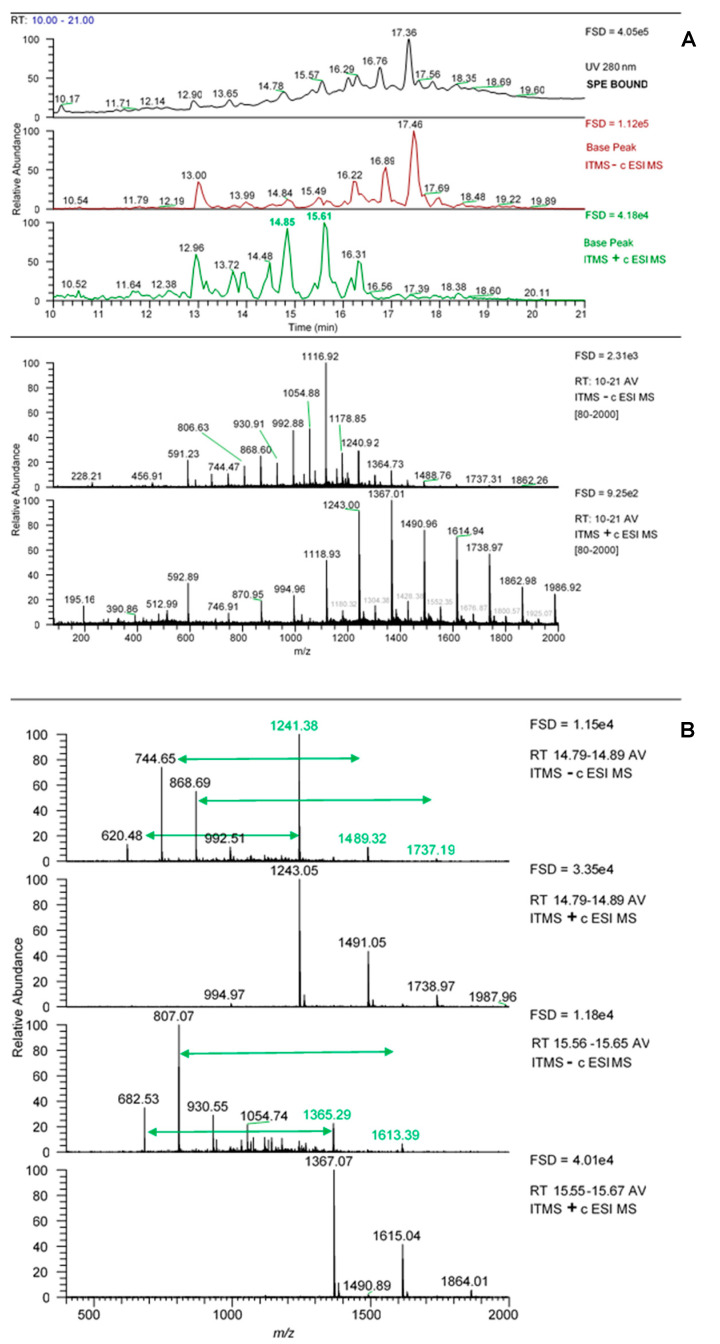
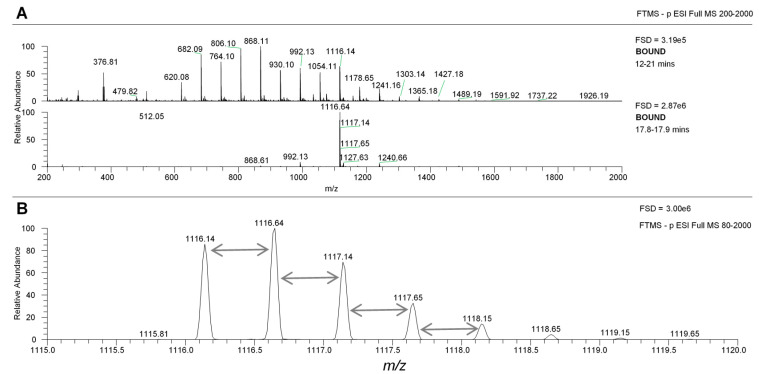
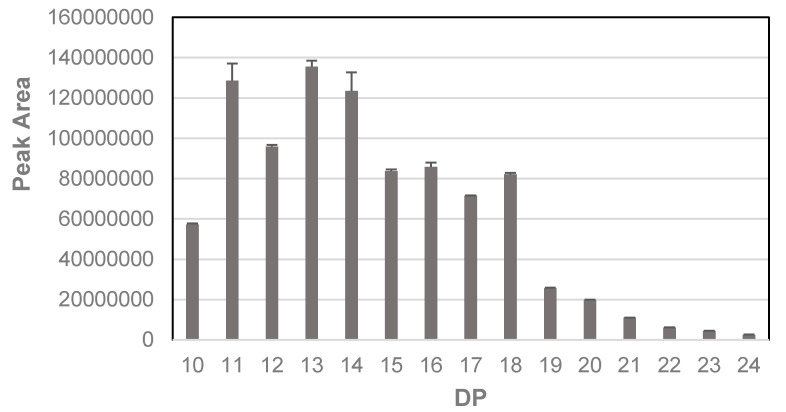
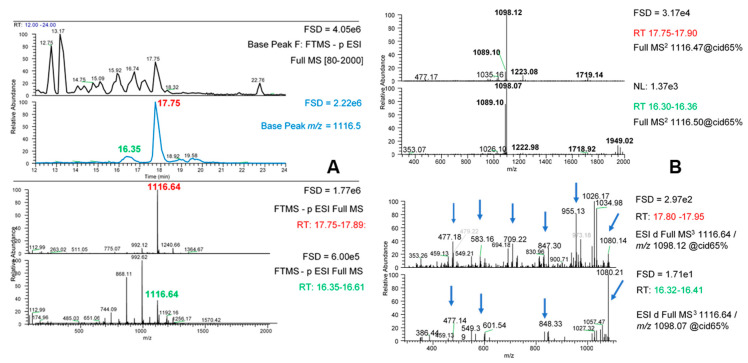
Phenolic components from the edible brown seaweed, Ascophyllum nodosum, have been associated with considerable antioxidant activity but also bioactivities related to human health. This study aims to select and identify the main phlorotannin components from this seaweed which have been previously associated with potential health benefits. Methods to enrich phenolic components then further select phlorotannin components from ethanolic extracts of Ascophyllum nodosum were applied. The composition and phenolic diversity of these extracts were defined using data dependent liquid chromatography mass spectroscopic (LC-MSn) techniques. A series of phlorotannin oligomers with apparent degree of polymerization (DP) from 10 to 31 were enriched by solid phase extraction and could be selected by fractionation on Sephadex LH-20. Evidence was also obtained for the presence of dibenzodioxin linked phlorotannins as well as sulphated phlorotannins and phenolic acids. As well as diversity in molecular size, there was evidence for potential isomers at each DP. MS2 fragmentation analyses strongly suggested that the phlorotannins contained ether linked phloroglucinol units and were most likely fucophlorethols and MS3 data suggested that the isomers may result from branching within the chain. Therefore, application of these LC-MSn techniques provided further information on the structural diversity of the phlorotannins from Ascophyllum, which could be correlated against their reported bioactivities and could be further applied to phlorotannins from different seaweed species.
Keywords: Ascophyllum; LC-MSn; diversity; health benefits; isomers; phenolics; phlorotannins; seaweed.
Conflict of interest statement
The authors declare no conflict of interest.
Figures
Similar articles
-
Profiling phlorotannins in brown macroalgae by liquid chromatography-high resolution mass spectrometry.Phytochem Anal. 2012 Sep-Oct;23(5):547-53. doi: 10.1002/pca.2354. Epub 2012 Mar 2. Phytochem Anal. 2012. PMID: 22383068
-
Identification of Phlorotannins in the Brown Algae, Saccharina latissima and Ascophyllum nodosum by Ultra-High-Performance Liquid Chromatography Coupled to High-Resolution Tandem Mass Spectrometry.Molecules. 2020 Dec 23;26(1):43. doi: 10.3390/molecules26010043. Molecules. 2020. PMID: 33374856 Free PMC article.
-
Phenolic compounds from three brown seaweed species using LC-DAD-ESI-MS/MS.Food Res Int. 2017 Sep;99(Pt 3):979-985. doi: 10.1016/j.foodres.2017.03.043. Epub 2017 Mar 24. Food Res Int. 2017. PMID: 28865624
-
Antioxidant and Antidiabetic Properties of Phlorotannins from Ascophyllum nodosum Seaweed Extracts.Molecules. 2023 Jun 23;28(13):4937. doi: 10.3390/molecules28134937. Molecules. 2023. PMID: 37446599 Free PMC article. Review.
-
The Quest for Phenolic Compounds from Macroalgae: A Review of Extraction and Identification Methodologies.Biomolecules. 2019 Dec 9;9(12):847. doi: 10.3390/biom9120847. Biomolecules. 2019. PMID: 31835386 Free PMC article. Review.
Cited by
-
In vitro inhibition of starch digestive enzymes by ultrasound-assisted extracted polyphenols from Ascophyllum nodosum seaweeds.J Food Sci. 2022 Jun;87(6):2405-2416. doi: 10.1111/1750-3841.16202. Epub 2022 May 19. J Food Sci. 2022. PMID: 35590486 Free PMC article.
-
Phlorotannin-Rich Ascophyllum nodosum Seaweed Extract Inhibits Influenza Infection.Viruses. 2024 Dec 15;16(12):1919. doi: 10.3390/v16121919. Viruses. 2024. PMID: 39772226 Free PMC article.
-
Overview of Phlorotannins' Constituents in Fucales.Mar Drugs. 2022 Nov 30;20(12):754. doi: 10.3390/md20120754. Mar Drugs. 2022. PMID: 36547901 Free PMC article. Review.
-
An Eco-Friendly Extraction and Purification Approach for Obtaining Active Ingredients for Cosmetics from Two Marine Brown Seaweeds.Mar Drugs. 2024 Feb 28;22(3):112. doi: 10.3390/md22030112. Mar Drugs. 2024. PMID: 38535453 Free PMC article.
-
Environmental Impact on Seaweed Phenolic Production and Activity: An Important Step for Compound Exploitation.Mar Drugs. 2021 Apr 26;19(5):245. doi: 10.3390/md19050245. Mar Drugs. 2021. PMID: 33926129 Free PMC article. Review.
References
-
- Ragan M.A., Glombitza K.W. Phlorotannins, brown algal polyphenols. Prog. Phycol. Res. 1986;4:129–241.
-
- Li S.-X., Wijesekara I., Li Y., Kim S.-K. Phlorotannins as bioactive agents from brown algae. Process Biochem. 2011;46:2219–2224. doi: 10.1016/j.procbio.2011.09.015. - DOI
-
- Jormalainen V., Honkanen T., Koivikko R., Eränen J. Induction of phlorotannin production in a brown alga: Defense or resource dynamics? Oikos. 2003;103:640–650. doi: 10.1034/j.1600-0706.2003.12635.x. - DOI
-
- Amsler C.D., Fairhead V.A. Defensive and sensory chemical ecology of brown algae. Adv. Bot. Res. 2006;43:1–91.
MeSH terms
Substances
LinkOut - more resources
Full Text Sources
Research Materials
Miscellaneous
