. 2020 Sep 1:9:e57282.
doi: 10.7554/eLife.57282.

KATANIN-dependent mechanical properties of the stigmatic cell wall mediate the pollen tube path in Arabidopsis

Affiliations

KATANIN-dependent mechanical properties of the stigmatic cell wall mediate the pollen tube path in Arabidopsis

Lucie Riglet et al. Elife. .

Abstract

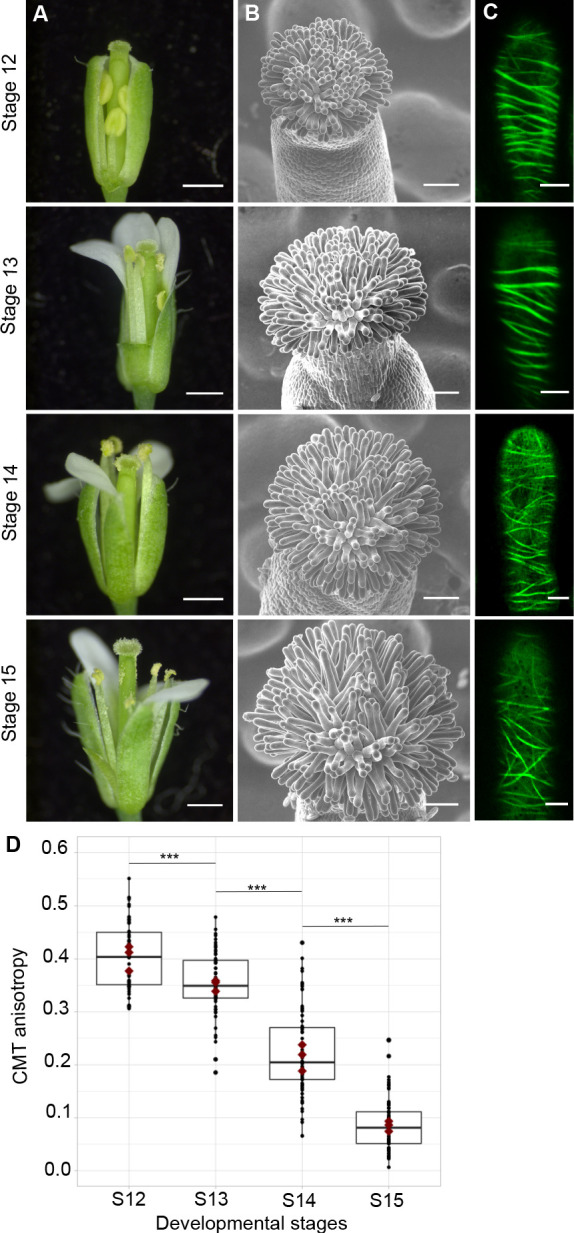
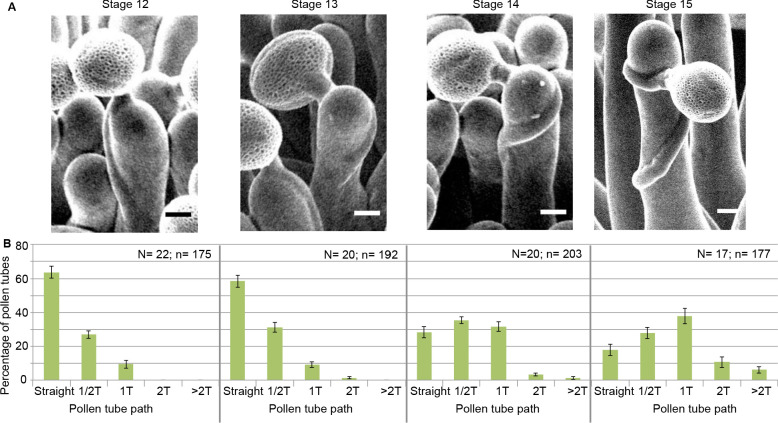
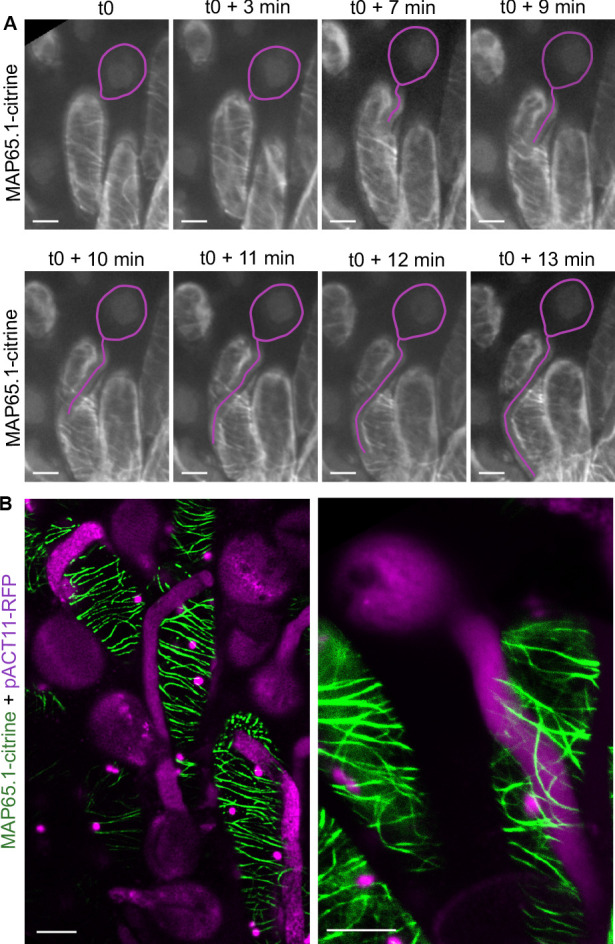
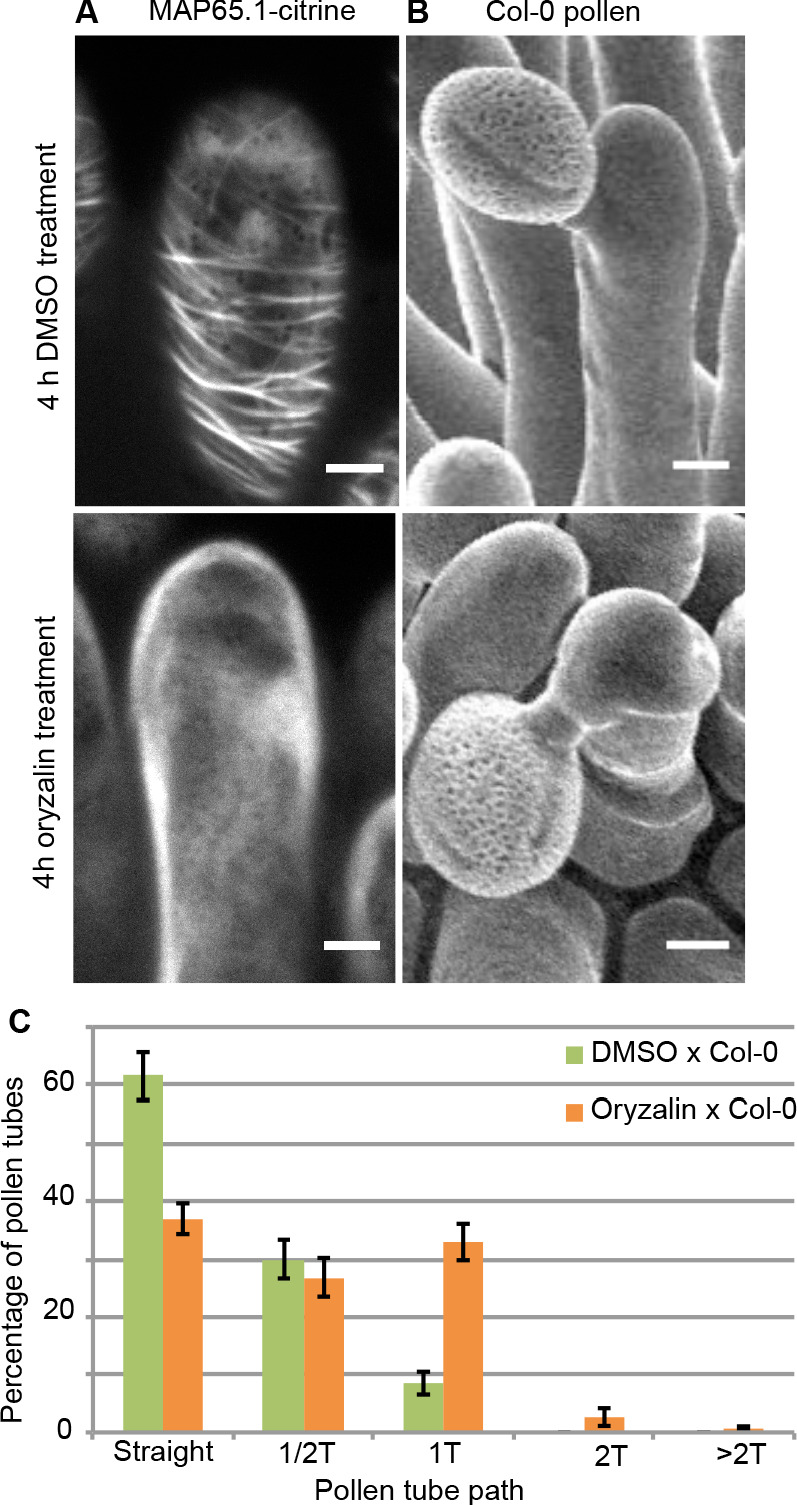
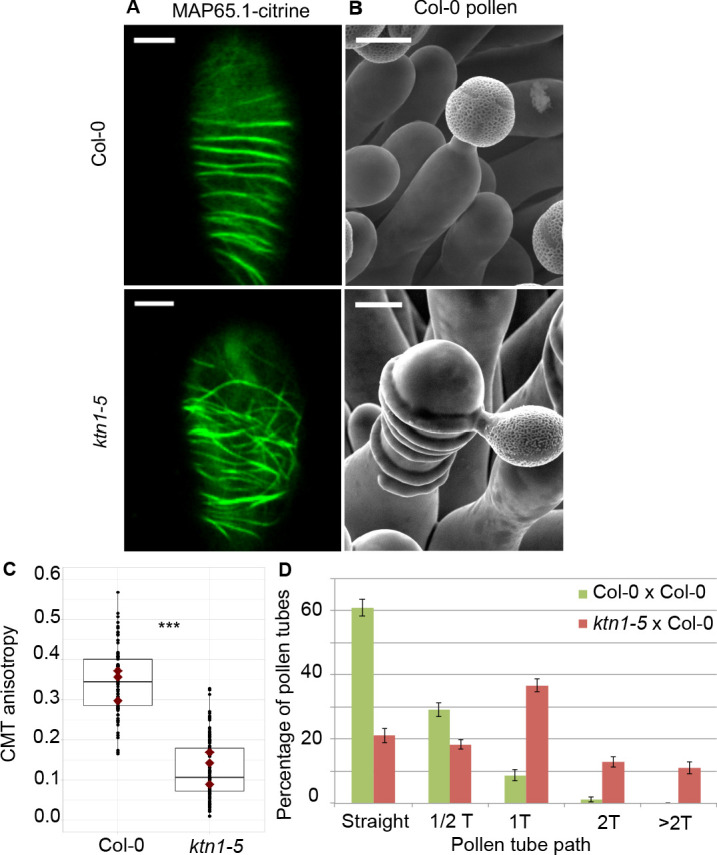
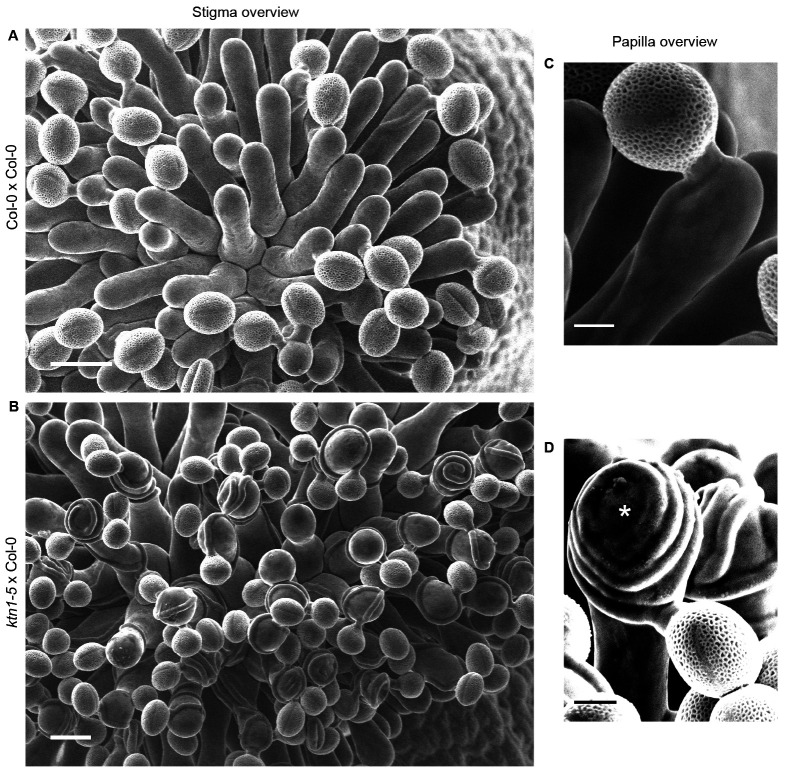
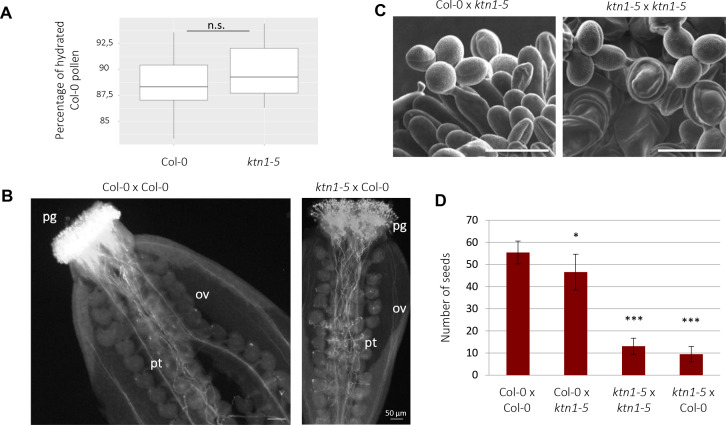
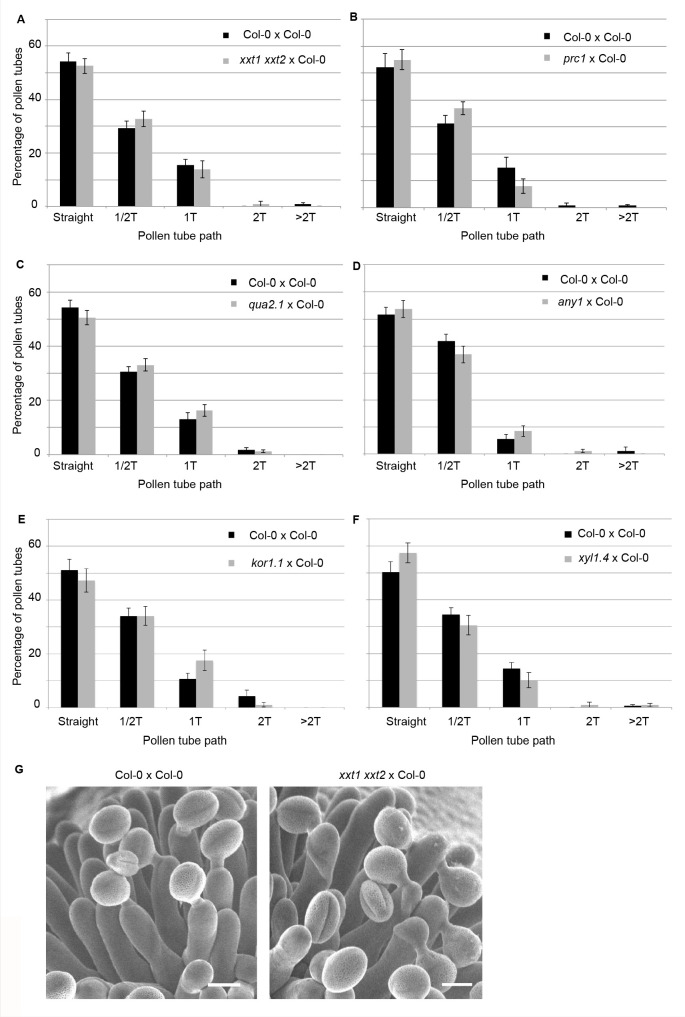
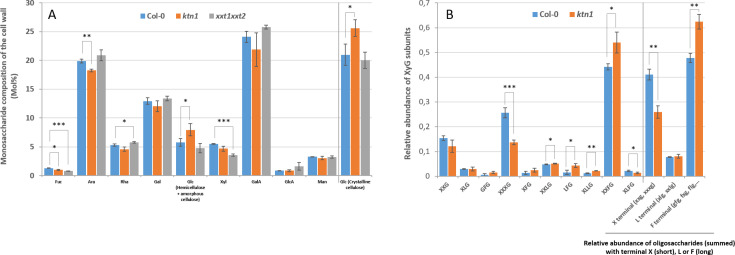
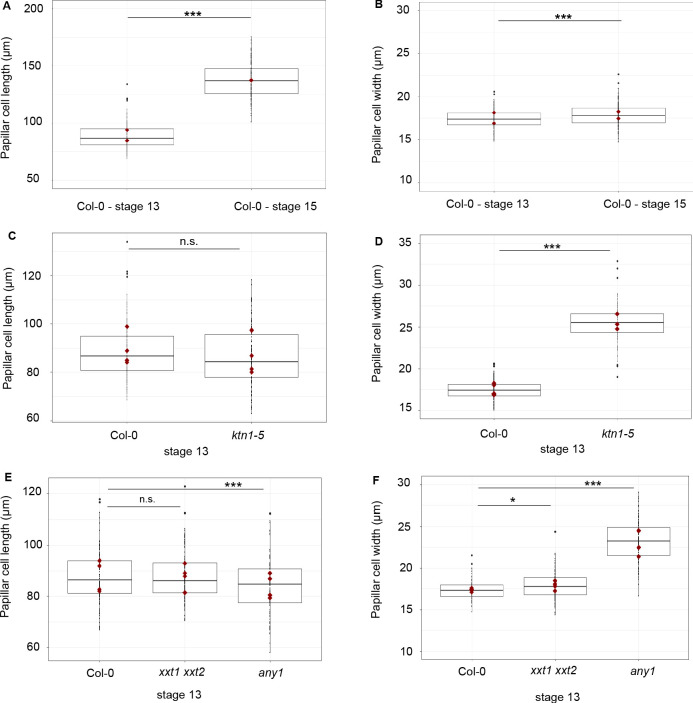
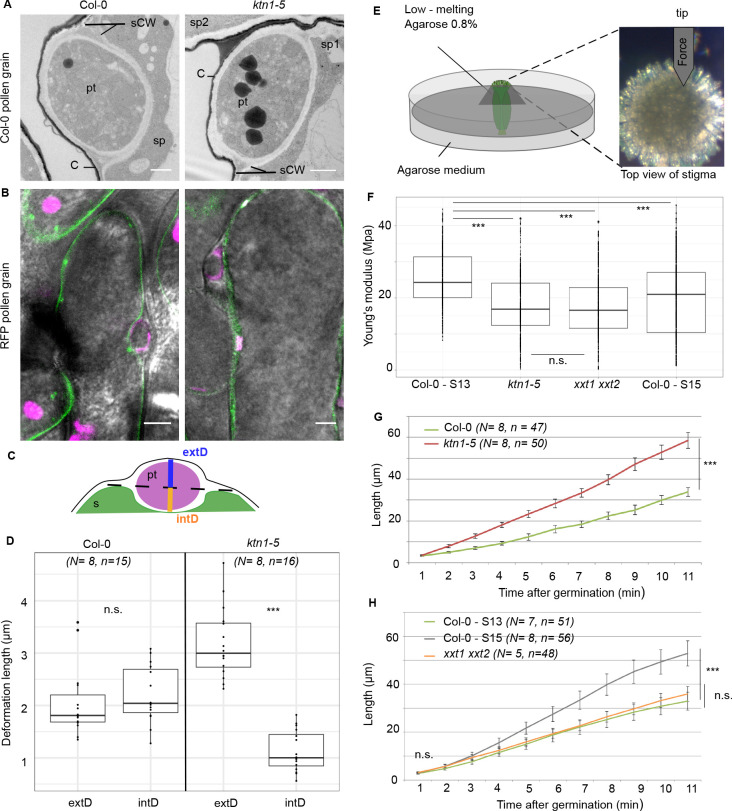
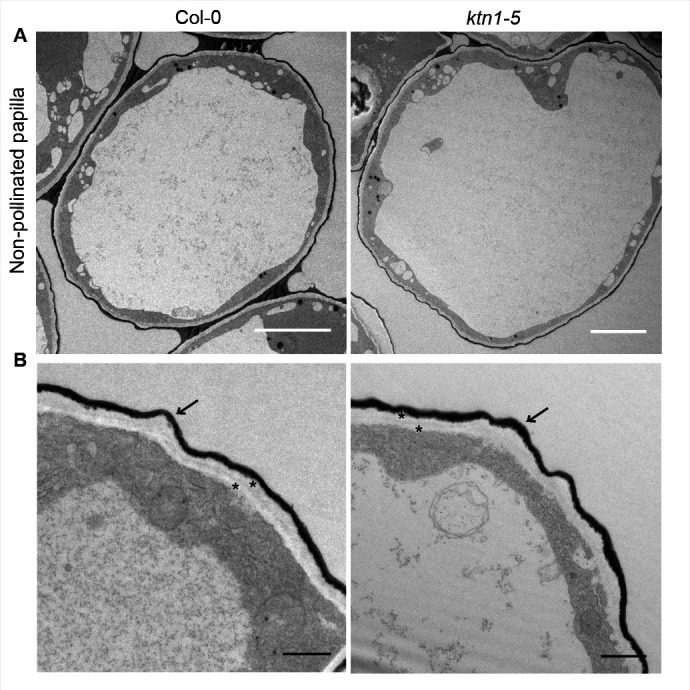
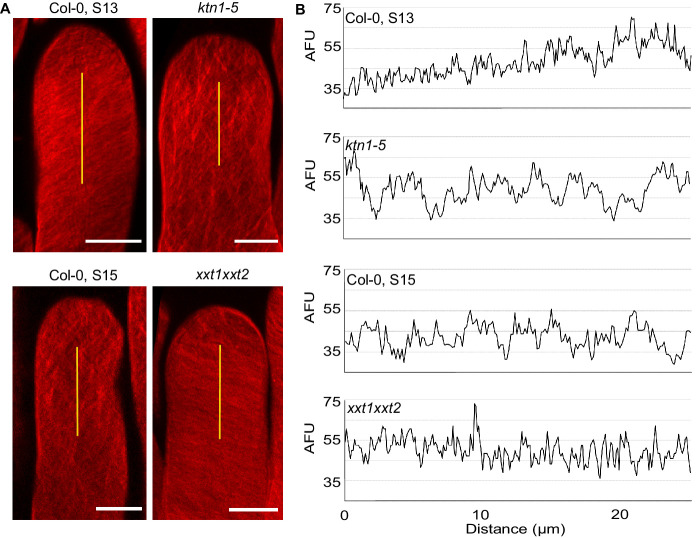
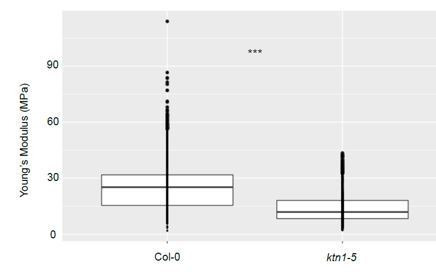
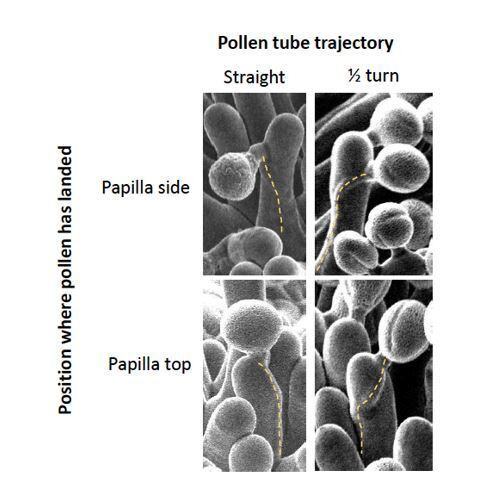
Successful fertilization in angiosperms depends on the proper trajectory of pollen tubes through the pistil tissues to reach the ovules. Pollen tubes first grow within the cell wall of the papilla cells, applying pressure to the cell. Mechanical forces are known to play a major role in plant cell shape by controlling the orientation of cortical microtubules (CMTs), which in turn mediate deposition of cellulose microfibrils (CMFs). Here, by combining imaging, genetic and chemical approaches, we show that isotropic reorientation of CMTs and CMFs in aged Col-0 and katanin1-5 (ktn1-5) papilla cells is accompanied by a tendency of pollen tubes to coil around the papillae. We show that this coiled phenotype is associated with specific mechanical properties of the cell walls that provide less resistance to pollen tube growth. Our results reveal an unexpected role for KTN1 in pollen tube guidance on the stigma by ensuring mechanical anisotropy of the papilla cell wall.

Keywords: A. thaliana; KATANIN; mechanical anisotropy; plant biology; pollen tube guidance; stigma papilla.

Plain language summary

Flowering plants produce small particles known as pollen that – with the help of the wind, bees and other animals – carry male sex cells (sperm) to female sex cells (eggs) contained within flowers. When a grain of pollen lands on the female organ of a flower, called the pistil, it gives rise to a tube that grows through the pistil towards the egg cells at the base. The surface of the pistil is covered in a layer of long cells named papillae. Like most plant cells, the papillae are surrounded by a rigid structure known as the cell wall, which is mainly composed of strands known as microfibrils. The pollen tube exerts pressure on a papilla to allow it to grow through the cell wall towards the base of the pistil. Previous studies have shown that the pistil produces signals that guide pollen tubes to the eggs. However, it remains unclear how pollen tubes orient themselves on the surface of papillae to grow in the right direction through the pistil. Riglet et al. combined microscopy, genetic and chemical approaches to study how pollen tubes grow through the surface of the pistils of a small weed known as Arabidopsis thaliana. The experiments showed that an enzyme called KATANIN conferred mechanical properties to the cell walls of papillae that allowed pollen tubes to grow towards the egg cells, and also altered the orientation of the microfibrils in these cell walls. In A. thaliana plants that were genetically modified to lack KATANIN the pollen tubes coiled around the papillae and sometimes grew in the opposite direction to where the eggs were. KATANIN is known to cut structural filaments inside the cells of plants, animals and most other living things. By revealing an additional role for KATANIN in regulating the mechanical properties of the papilla cell wall, these findings indicate this enzyme may also regulate the mechanical properties of cells involved in other biological processes.


Conflict of interest statement

LR, FR, CK, SB, JS, IF, TG No competing interests declared

Figures

Figure 1.
Figure 1.. CMT organisation during papilla cell development.
(A) Flower development of A. thaliana from developmental stages 12 to 15. Scale bar, 500 μm. (B) Upper view of the stigma during development by SEM. Scale bar, 50 μm. (C) Confocal images of papilla cells expressing MAP65-citrine at each stage of development. Scale bar, 5 μm. (D) Quantitative analysis of CMT array anisotropy of papilla cells from stages 12 to 15. The red dots correspond to the mean values of the three replicates. Statistical differences were calculated using a Shapiro-Wilk test to evaluate the normality and then a Wilcoxon test, ***p<0.01. N > 4 stigmas, n > 60 papilla cells for each stage. Figure 1—source data 1 provides data for assessing CMT anisotropy shown in D.
Figure 2.
Figure 2.. Pollen tube growth behaviour on papillae during development.
(A) SEM images of Col-0 papillae pollinated with Col-0 pollen, one hour post pollination, from stages 12 to 15. Scale bar, 5 μm. (B) Quantification of the number of turns (T) made by the pollen tube on papillae from stages 12 to 15. Data are expressed as mean +/- s.e.m. A Chi-Square test for independence (at 6 degrees of freedom) was used to compare all stages and demonstrated that the number of turns was significantly different between stages (p<0.01). N corresponds to the number of stigmas analysed in this study and n, the number of papillae. Figure 2—source data 1 provides data for the quantification of the number of turns made by Col-0 pollen tubes on papillae from stage 12 to 15 shown in B.
Figure 3.
Figure 3.. CMT organisation following pollen tube growth.
(A) Time-lapse imaging of Col-0 pollen tube growth within a papilla cell expressing MAP65.1-citrine. Pollen outline and pollen tube path were highlighted in magenta for a better visualisation. N = 5 papillae. (B) Confocal images of papilla cells expressing MAP65.1-citrine (in green), 30 min after pollination with RFP labelled pollen grains (in magenta). The magenta dots are chloroplasts. Right image: close-up of a pollinated papilla, 3D projection. N = 13 papillae. Scale bars, 10 µm. Figure 3—figure supplement 1 shows the destabilisation and fragmentation of CMTs upon mechanical stimulation.
Figure 3—figure supplement 1.
Figure 3—figure supplement 1.. Confocal image of the effect of mechanical stimulation on CMT organisation.
Coverslide was pressed manually leading to a destabilization of the CMT array of papillae expressing MAP65.1-citrine. Scale bar, 30 μm.
Figure 4.
Figure 4.. Local oryzalin application on Col-0 stigmas promotes MT destabilization and induces Col-0 pollen tube coils.
(A) Col-0 papilla cells expressing MAP65.1-citrine after 4 hr of DMSO (top) or oryzalin (bottom) local treatment. (B) SEM images of DMSO- (top) or oryzalin-treated (bottom) Col-0 stigmas pollinated with Col-0 pollen grains. (A and B) Scale bars, 5 μm. (C) Quantification of the number of turns (T) made by Col-0 pollen tubes on drug-treated and control papillae. Data are expressed as mean +/- s.e.m. Statistical difference was found between pollen tube path within DMSO (control) and oryzalin-treated papillae and was calculated using an adjusted Chi-Square test for homogeneity (2 degrees of freedom), p<0.01. N(DMSO)=12 stigmas, n(DMSO)=117 papillae, N(oryzalin)=16 stigmas, n(oryzalin)=149 papillae. Figure 4—source data 1 provides data for the quantification of the number of turns made by Col-0 pollen tubes on drug-treated and control papillae shown in C.
Figure 5.
Figure 5.. Effect of CMT organisation on pollen tube path.
(A) Confocal images of papilla cells expressing MAP65.1-citrine in Col-0 and ktn1-5 at stage 13. Scale bars, 5 μm. (B) SEM images of Col-0 and ktn1-5 papillae pollinated with Col-0 pollen grains. Scale bar, 10 μm. (C) CMT anisotropy of Col-0 and ktn1-5 papilla cells at stage 13. N(Col-0)=10 stigmas, n(Col-0)=106 papillae, N(ktn1-5)=11 stigmas, n(ktn1-5)=114 papillae. Statistical differences were calculated using a Shapiro-Wilk test to evaluate the normality and then a Wilcoxon test with ***p<0.01. (D) Quantification of the number of turns (T) made by Col-0 pollen tubes on ktn1-5 and Col-0 papillae. Data are expressed as mean +/- s.e.m. Statistical difference was found between pollen tube path within ktn1-5 and Col-0 papillae and was calculated using an adjusted Chi-Square test for homogeneity (2 degrees of freedom), p<0.01. N(Col-0)=27 stigmas, n(Col-0)=251 papillae, N(ktn1-5)=23 stigmas, n(ktn1-5)=327 papillae. Figure 5—figure supplement 1 shows SEM images of the behaviour of Col-0 pollen tubes on Col-0 and ktn1-5 papillae at stage 13. Figure 5—figure supplement 2 illustrates the receptivity and fertility of the ktn1-5 mutant. Figure 5—figure supplement 3 shows that mutants impaired in cell wall genes behave like Col-0. Figure 5—figure supplement 4 gives the saccharide composition of Col-0, ktn1-5 and xxt1 xxt2 stigmatic cell walls. Figure 5—figure supplement 5 compares the length and width of papilla cells from Col-0, ktn1-5, xxt1 xxt2 and any1. Figure 5—source data 1 provides source data for the quantification of CMT anisotropy of Col-0 and ktn1-5 papilla cells at stage 13 shown in C, for the quantification of the number of turns made by Col-0 pollen tubes on ktn1-5 and Col-0 papillae shown in D, and source data for the Figure 5—figure supplement 2, Figure 5—figure supplement 3 and Figure 5—figure supplement 4. Figure 5—source data 2 provides information on the six cell wall genes analysed and shows that they are expressed in stigmas.
Figure 5—figure supplement 1.
Figure 5—figure supplement 1.. Col-0 pollen tube behaviour on Col-0 and ktn1-5 papillae at stage 13.
(A and B) Top views of Col-0 (A) and ktn1-5 (B) stigmas pollinated with Col-0 pollen grains. Scale bars, 20 µm. (C and D) Magnification of pollinated papilla cells. (C) Col-0 pollen tube grows mainly straight to the direction of the ovules on Col-0 papillae whereas (D) it coils around and can even grow upward on ktn1-5 papilla cells (*). Scale bars, 5 µm.
Figure 5—figure supplement 2.
Figure 5—figure supplement 2.. ktn1-5 is impaired in female receptivity and fertility.
In all crosses, the female partner is written first. (A) Stigma receptivity: percentage of Col-0 hydrated pollen grains on Col-0 and ktn1-5 stigmas (N = 10 stigmas for each genotype, with 972 pollen grains analysed for Col-0 and 1959 for ktn1-5). Calculations were based on pollen shape (round-shape pollens = hydrated, oval-shaped = not hydrated). n.s: not significantly different. (B) Aniline blue staining of Col-0 and ktn1-5 pistils pollinated with Col-0 pollen grains after 6 hr. pg = pollen grain, pt = pollen tube, ov = ovule. N > 10 stigmas each. (C) ktn1-5 pollen tubes grow like Col-0 pollen on Col-0 papilla cells but coil on ktn1-5 stigma papillae. Scale bars, 30 μm. (D) Seed set. N ≥ 7 siliques each. Statistical differences were tested with a T-test, *<0.05 and ***<0.01, by comparing each cross to Col-0 x Col-0.
Figure 5—figure supplement 3.
Figure 5—figure supplement 3.. Quantification of the number of coils made by Col-0 pollen tubes on papillae from cell-wall mutants at stage 13.
(A) xxt1 xxt2 x Col-0. N(Col-0)=14 stigmas, n(Col-0)=116 papillae, N(xxt1 xxt2)=12 stigmas, n(xxt1 xxt2)=116 papillae. (B) prc1 x Col-0. N(Col-0)=14 stigmas, n(Col-0)=115 papillae, N(prc1)=12 stigmas, n(prc1)=100 papillae. (C) qua2.1 x Col-0. N(Col-0)=22 stigmas, n(Col-0)=160 papillae, N(qua2.1)=18 stigmas, n(qua2.1)=162 papillae. (D) any1 x Col-0. N(Col-0)=14 stigmas, n(Col-0)=91 papillae, N(any1)=14 stigmas, n(any1)=95 papillae. (E) kor1.1 x Col-0. N(Col-0)=14 stigmas, n(Col-0)=141 papillae, N(kor1.1)=11 stigmas, n(kor1.1)=91 papillae. (F) xyl1.4 x Col-0. N(Col-0)=18 stigmas, n(Col-0)=136 papillae, N(xyl1.41)=16 stigmas, n(xyl1.4)=108 papillae. Data are expressed as mean +/- s.e.m. No statistical difference was found between pollen tube path within the cell wall mutants and Col-0 papillae based on an adjusted Chi-Square test for homogeneity (2 degrees of freedom). (G) SEM images of Col-0 and xxt1 xxt2 stigmas pollinated with Col-0 pollen grains. Scale bar, 10 µm.
Figure 5—figure supplement 4.
Figure 5—figure supplement 4.. Cell wall composition is altered in katanin1 and different from xxt1 xxt2.
(A) Relative abundance of monosaccharides in the cell wall extracted from pistils of Col-0, ktn1, xxt1 xxt2. (B) MALDI-TOF analysis of xyloglucan from dissected stigmas of Col-0 and ktn1 (xxt1 xxt2 does not produce XyG with side chains). Single-letter nomenclature (Fry et al., 1993) is used to describe the oligosaccharides where X = backbone glucose substituted with a terminal xylose, L = substituted with β-D-galactose, F = substituted with fucose, and G = unsubstituted. Mean values represent acetylated and nonacetylated subunits of XXLG, XXFG, and XLFG combined. The relative abundance of total oligosaccharides with terminal xylose, terminal galactose or terminal fucose on their side chains has been calculated. Data represent the mean of 3 biological replicates, error bars represent the standard deviation, statistical differences were calculated using a T-test.* p<0.05, **p<0.01, ***p<0.001.
Figure 5—figure supplement 5.
Figure 5—figure supplement 5.. Size of the papilla cells of Col-0 and cell wall mutants.
(A) Papilla cell length of Col-0 at stage 13 and stage 15. (B) Papilla cell width of Col-0 at stage 13 and stage 15. (C) Papilla cell length of Col-0 and ktn1-5 at stage 13. (D) Papilla cell width of Col-0 and ktn1-5 at stage 13. (E) Papilla cell length of Col-0, xxt1 xxt2 and any1 at stage 13. (F) Papilla cell width of Col-0, xxt1 xxt2 and any1 at stage 13. Statistical differences were calculated using a T-test. *p<0.05, ***p<0.01, n.s. = not significant. N = 4 stigmas and n = 120 papillae for each genotype.
Figure 6.
Figure 6.. Mechanical properties of papilla cell walls.
(A) Location of a Col-0 pollen tube in the cell-wall of Col-0 and ktn1-5 papillae by TEM. pt = pollen tube, C = stigma cuticle, sCW = stigma cell wall, sp = stigma papilla. Scale bar, 1 μm. (B) Confocal images of Col-0 and ktn1-5 papillae expressing the plasma membrane marker LTI6B-GFP pollinated with an RFP-expressing pollen. Scale bar, 5 μm. (C) Diagram showing the procedure used for evaluating the external (extD) and internal (intD) deformations made by Col-0 pollen tubes. (D) External and internal deformations caused by Col-0 pollen tube growth in Col-0 and ktn1-5 papillae. (E) Drawing of the AFM experimental setup. Dissected pistils were inserted in agarose medium and fixed with low-melting agarose for measurements. (F) Young’s modulus values of the papilla cell wall for Col-0 at stage 13 (N = 4 stigmas, n = 8 papillae), ktn1-5 (N = 5 stigmas, n = 9 papillae), xxt1 xxt2 (N = 4 stigmas, n = 11 papillae) and Col-0 at stage15 (N = 4 stigmas, n = 10 papillae. (G) Mean of travel distances made by Col-0 pollen tubes in Col-0 and ktn1-5 papillae. (H) Mean of travel distances made by Col-0 pollen tubes in papillae of Col-0 at stage 13, Col-0 at stage 15, xxt1 xxt2 at stage 13. D,F and G,H: Statistical differences were calculated using a Shapiro-Wilk test to evaluate the normality and then a T-test. ***p<0.01, n.s. = not significant. For H, we found a significant difference (***p<0.01) between Col-0 at stage 13 and 15, but not significant (n.s.) between Col-0 at stage 13 and xxt1 xxt2 at stage 13. Figure 6—figure supplement 1 shows the similar ultrastructural features of Col-0 and ktn1-5 papilla cell walls. Figure 6—source data 1 are values measured to define the mechanical properties of the papilla cell walls shown in D, F, G, H.
Figure 6—figure supplement 1.
Figure 6—figure supplement 1.. Ultrastructural features of Col-0 and ktn1-5 papilla cells.
(A) TEM images of non-pollinated Col-0 and ktn1-5 papillae. Scale bar, 5 μm. (B) Both Col-0 and ktn1-5 papillae show a similar two-layered cell wall (*) surrounded by an electron dense cuticle (arrow). Scale bar, 1 µm.
Figure 7.
Figure 7.. Cellulose microfibril organisation in Col-0 stage 13, ktn1-5, Col-0 stage 15 and xxt1 xxt2 papillae.
(A) 3D-projections of z-stack images of Col-0 stage 13, ktn1-5, Col-0 stage 15 and xxt1 xxt2 papilla cells stained with Direct Red 23 dye. Scale bars, 10 µm. (B) Plot profiles of the fluorescence intensity (AFU, Arbitrary Fluorescence Units) along the yellow lines. Note the similarities of profiles between Col-0 stage 13 and xxt1 xxt2 on one hand, and between ktn1-5 and Col-0 on the other hand. At least eight papillae per genotype were observed.
Author response image 1.
Author response image 1.. Stiffness differences between Col-0 and ktn1-5 papillae at stage 13.
Young’s modulus values of the papilla cell wall for Col-0 at stage 13 (N = 7 stigmas, n = 33 papillae) and ktn1-5 (N = 7 stigmas, n = 9 papillae). Statistical differences were calculated using a T-test, ***P<0.01.
Author response image 2.
Author response image 2.. Col-0 pollen tube trajectory after attachment of the pollen to different positions on the Col-0 papilla at stage 13.
Pollen tube trajectory is not dependent on the position where pollen has landed.
Author response image 3.
Author response image 3.. Col-0 papilla cells expressing MAP65.
1-citrine after 6 or 4 hours of oryzalin local treatment. CMT depolymerization is complete and homogeneous after 4 hours of treatment at 888µg/mL. At 404 µg/mL and 666 µg/mL, CMTs are not completely destabilized.

Comment in

  • Growing straight through walls.
    Sankaranarayanan S, Kessler SA. Sankaranarayanan S, et al. Elife. 2020 Sep 1;9:e61647. doi: 10.7554/eLife.61647. Elife. 2020. PMID: 32867921 Free PMC article.

Similar articles

Cited by

References

    1. Altartouri B, Bidhendi AJ, Tani T, Suzuki J, Conrad C, Chebli Y, Liu N, Karunakaran C, Scarcelli G, Geitmann A. Pectin chemistry and cellulose crystallinity govern pavement cell morphogenesis in a Multi-Step mechanism. Plant Physiology. 2019;181:127–141. doi: 10.1104/pp.19.00303. - DOI - PMC - PubMed
    1. Baskin TI. Anisotropic expansion of the plant cell wall. Annual Review of Cell and Developmental Biology. 2005;21:203–222. doi: 10.1146/annurev.cellbio.20.082503.103053. - DOI - PubMed
    1. Bichet A, Desnos T, Turner S, Grandjean O, Höfte H. BOTERO1 is required for normal orientation of cortical microtubules and anisotropic cell expansion in Arabidopsis. The Plant Journal. 2001;25:137–148. doi: 10.1046/j.1365-313x.2001.00946.x. - DOI - PubMed
    1. Boudaoud A, Burian A, Borowska-Wykręt D, Uyttewaal M, Wrzalik R, Kwiatkowska D, Hamant O. FibrilTool, an ImageJ plug-in to quantify fibrillar structures in raw microscopy images. Nature Protocols. 2014;9:457–463. doi: 10.1038/nprot.2014.024. - DOI - PubMed
    1. Burk DH, Liu B, Zhong R, Morrison WH, Ye ZH. A katanin-like protein regulates normal cell wall biosynthesis and cell elongation. The Plant Cell. 2001;13:807–828. doi: 10.2307/3871342. - DOI - PMC - PubMed

Publication types

LinkOut - more resources