. 2020 Oct 26;40(22):e00377-20.
doi: 10.1128/MCB.00377-20. Print 2020 Oct 26.

Geldanamycin-Derived HSP90 Inhibitors Are Synthetic Lethal with NRF2

Affiliations

Geldanamycin-Derived HSP90 Inhibitors Are Synthetic Lethal with NRF2

Liam Baird et al. Mol Cell Biol. .

Abstract

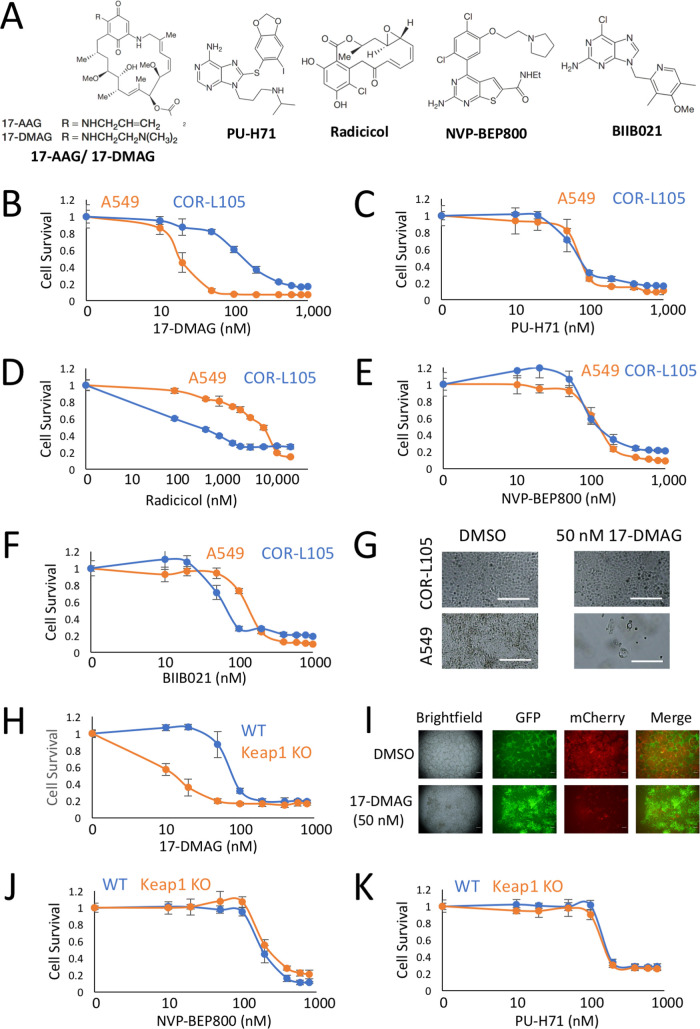
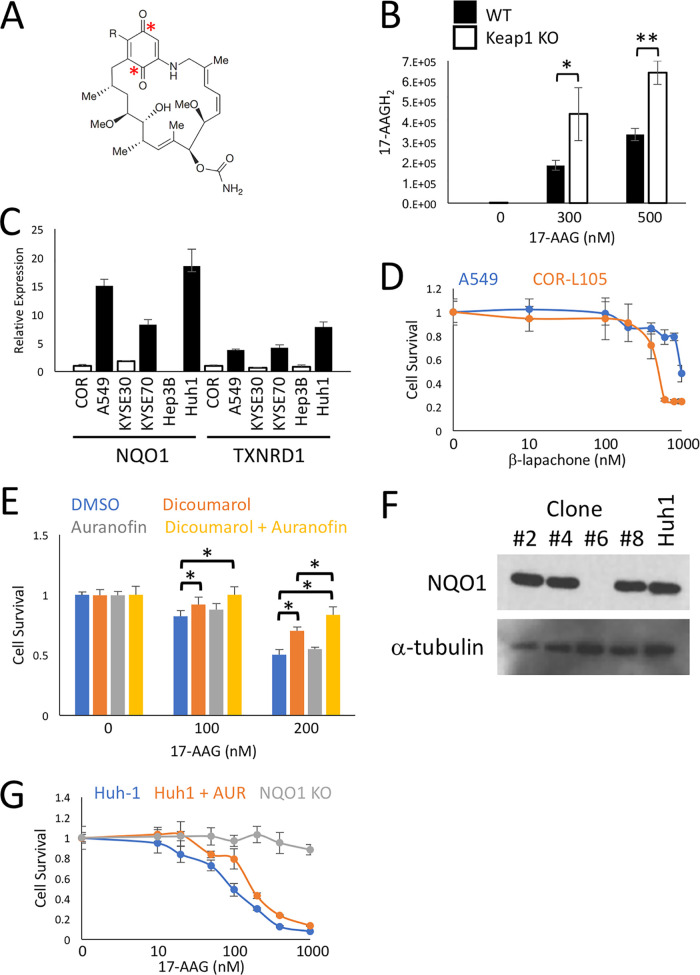
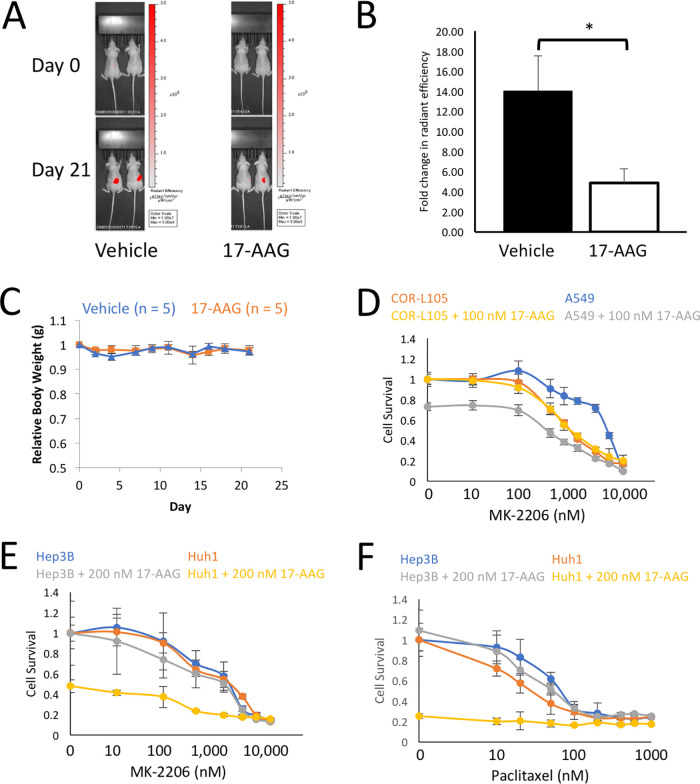
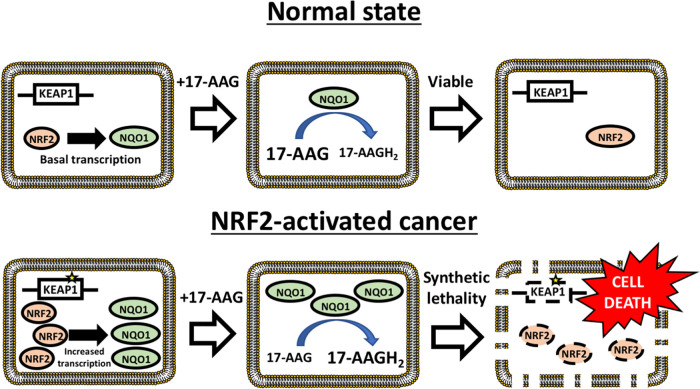
Activating mutations in KEAP1-NRF2 are frequently found in tumors of the lung, esophagus, and liver, where they are associated with aggressive growth, resistance to cancer therapies, and low overall survival. Despite the fact that NRF2 is a validated driver of tumorigenesis and chemotherapeutic resistance, there are currently no approved drugs which can inhibit its activity. Therefore, there is an urgent clinical need to identify NRF2-selective cancer therapies. To this end, we developed a novel synthetic lethal assay, based on fluorescently labeled isogenic wild-type and Keap1 knockout cell lines, in order to screen for compounds which selectively kill cells in an NRF2-dependent manner. Through this approach, we identified three compounds based on the geldanamycin scaffold which display synthetic lethality with NRF2. Mechanistically, we show that products of NRF2 target genes metabolize the quinone-containing geldanamycin compounds into more potent HSP90 inhibitors, which enhances their cytotoxicity while simultaneously restricting the synthetic lethal effect to cells with aberrant NRF2 activity. As all three of the geldanamycin-derived compounds have been used in clinical trials, they represent ideal candidates for drug repositioning to target the currently untreatable NRF2 activity in cancer.

Keywords: KEAP1; NRF2; Nfe2l2; cancer; oxidative stress; synthetic lethal.


Figures

FIG 1
FIG 1
Development of an assay to identify compounds which are synthetic lethal with Nrf2. (A) Scheme showing an overview of the synthetic lethal screening strategy using isogenic WT and Keap1 KO Hepa1 cells. (B) Nrf2 target genes are significantly upregulated in CRISPR-Cas9-generated Keap1 KO Hepa1 cells compared to the parental WT cells. (C) WT-GFP cells plated at multiple densities display normal growth dynamics over a 5-day period. (D) Keap1 KO-mCherry cells plated at multiple densities display normal growth dynamics over a 5-day period. (E) When cocultured together at an initial seeding of 1,000 WT-GFP cells and 2,000 Keap1 KO-mCherry cells, the cell lines proliferate together at an expected rate over an 8-day period. (F) Over a 4-day period, the fluorescence intensity of the WT-GFP and Keap1 KO-mCherry monocultured cells increases at a rate comparable to the increase in total protein content. (G) Visualization of the coculture of WT-GFP and Keap1 KO-mCherry cells, showing uniform fluorophore expression between the cells. Scale bars = 300 μm. (H and I) Under coculture conditions, compared to the Keap1 KO-mCherry cells, the WT-GFP cells are significantly more sensitive to the anticancer drugs 5-FU and doxorubicin (Dox).
FIG 2
FIG 2
The HSP90 inhibitor 17-AAG is synthetic lethal with Nrf2. (A) A screen of a library of stress pathway modulators reveals that the proteotoxic HSP90 inhibitor 17-AAG is synthetic lethal with Nrf2 activity in Hepa1 cells. (B) Visualization of the cocultured WT-GFP and Keap1 KO-mCherry cells shows that in response to DMSO, the coculture is dominated by mCherry-expressing cells, while in 17-AAG-treated cells, the mCherry signal is significantly diminished, and the GFP-expressing cells expand their domain to fill the entire surface of the microplate well. Scale bars = 300 μm. (C) Validation of the fluorescence-based primary screen using total protein content as a measure of cell survival. Keap1-KO cells show significantly enhanced sensitivity to 17-AAG at 50 and 100 nM, which is independent of the measurement of fluorescence intensity. *, P < 0.05. (D) Viabilities of cocultured WT-GFP and Keap1 KO-mCherry cells, determined by fluorescence intensity relative to the DMSO control, exposed to the indicated concentrations of 17-AAG for 8 days. (E) Fluorescence intensity of WT-GFP cells exposed to 0.1% DMSO or 100 nM 17-AAG, measured each day over a period of 8 days. (F) Fluorescence intensity of Keap1 KO-mCherry cells exposed to 0.1% DMSO or 100 nM 17-AAG, measured each day over a period of 8 days. (G) Nrf2 target genes are significantly downregulated in CRISPR-Cas9-generated Keap1-Nrf2 DKO Hepa1 cells compared to the parental Keap1 KO-mCherry cells. (H) Keap1-Nrf2 DKO-mCherry cells plated at multiple densities display normal growth dynamics over a 5-day period. (I) Fluorescence intensity of Keap1-Nrf2 DKO-mCherry cells exposed to 0.1% DMSO or 100 nM 17-AAG, measured each day over a period of 8 days. (J) Viabilities, determined by fluorescence intensity, of cocultured WT-GFP and Keap1 KO-mCherry cells exposed to 0.1% DMSO or 100 nM 17-AAG, measured each day over a period of 8 days. *, P < 0.05. (K) Viabilities, determined by fluorescence intensity, of cocultured WT-GFP and Keap1-Nrf2 DKO-mCherry cells exposed to 0.1% DMSO or 100 nM 17-AAG, measured each day over a period of 8 days.
FIG 3
FIG 3
17-AAG is synthetic lethal with NRF2 in a range of different human cancer cell lines. (A) Viabilities of monocultured NRF2-active A549, H2023, and KYSE70 cells and NRF2-normal COR-L105, HCC827, and KYSE30 cells. Cell viabilities were determined by total protein content after exposure to the indicated concentrations of 17-AAG for 8 days. For a given concentration of 17-AAG, the NRF2-active cell lines were designated sensitive to 17-AAG if their survival was statistically significantly reduced compared to that of all of the WT cells. (B) Viabilities of monocultured liver cancer cell lines. Viabilities of NRF2-active Huh-1 and JHH5 cells, and NRF2-normal Hep3B and JHH2 cells, were determined by total protein content, after exposure to the indicated concentrations of 17-AAG for 8 days. For a given concentration of 17-AAG, the NRF2-active cell lines were designated sensitive to 17-AAG if their survival was statistically significantly reduced compared to all of the WT cells. (C) Viabilities of monocultured NRF2-active A549, KYSE70, and Huh-1 cells and NRF2-normal COR-L105, KYSE30, and Hep3B cells. Cell viabilities were determined by total protein content after exposure to the indicated concentrations of 17-AAG for 4 days. For a given concentration of 17-AAG, the NRF2-active cell lines were designated sensitive to 17-AAG if their survival was statistically significantly reduced compared to that of all of the WT cells. (D to H) Visualization of monocultured A549 and COR-L105 cells (D), H2023 and HCC827 cells (E), KYSE70 and KYSE30 cells (F), Huh-1 and Hep3B cells (G), and JHH5 and JHH2 cells (H), treated with 0.1% DMSO or the indicated concentrations of 17-AAG for 8 days. Scale bars = 300 μm. (I) Viabilities, determined by total protein content, of monocultured ABC1 cells (with normal NRF2 regulation) exposed to the indicated concentrations of 17-AAG for 8 days, with and without cotreatment with the NRF2 inducer DEM (100 μM). (J) Viabilities, determined by total protein content, of monocultured KYSE30 cells (with normal NRF2 regulation) exposed to the indicated concentrations of 17-AAG for 8 days, with and without cotreatment with the NRF2 inducer DEM (100 μM). *, P < 0.05.
FIG 4
FIG 4
Nrf2-dependent changes in the cellular phenotype are not required for the synthetic lethal effect. (A) The relative expression of the four HSP90 homologues in WT-GFP and Keap1 KO-mCherry cells as measured by qPCR. (B) The relative expression of the Nrf2 target genes NQO1, GCLM, and GSTM3 in response to 0.1% DMSO or 100 nM 17-AAG treatment for 24 h in WT-GFP and Keap1 KO-mCherry cells as measured by qPCR. (C) The relative expression of the two β-TrCP homologues BTRC and FBWX11 and the NRF2 target genes NQO1, HO1, GSTP1, and GCLM in A549 cells after treatment with an siRNA targeting β-TrCP1/2, or a scrambled control, as measured by qPCR. (D) The relative survival of A549 cells after 4 days of treatment with an siRNA targeting β-TrCP1/2 or a scrambled control. Note that there is no change in cell survival upon hyperactivation of NRF2. (E) The ratio of mCherry to GFP fluorescence from cocultured WT-GFP and Keap1 KO-mCherry cells after 8 days of treatment with either 0.1% DMSO or 100 nM 17-AAG and cotreatment with the indicated concentrations of the antioxidant NAC. Note that 17-AAG kills the vast majority of Keap1 KO cells under all conditions, and therefore, the ratio of mCherry to GFP is low in both the presence and absence of NAC. (F) The ratio of mCherry to GFP fluorescence from cocultured WT-GFP and Keap1 KO-mCherry cells after 8 days of treatment with either 0.1% DMSO or 100 nM 17-AAG, cultured in media containing the indicated percentages of growth serum. (G) Viabilities, determined by fluorescence intensity relative to the DMSO control, of cocultured WT-GFP and Keap1-Nrf2 DKO-mCherry cells exposed to the indicated concentrations of 17-AAG for 8 days. (H) Visualization of the cocultured WT-GFP and Keap1-Nrf2 DKO-mCherry cells shows that in cocultures treated with 800 nM 17-AAG, the mCherry signal from the DKO cells dominates the surface of the microplate well. Scale bars = 300 μm. (I) Viabilities, determined by fluorescence intensity, of cocultured WT-GFP and Keap1 KO-mCherry cells exposed to combinations of 0.1% DMSO, 100 nM 17-AAG, and 2 μM Kribb11 (HSF1 inhibitor). *, P < 0.05. (J) Relative death of A549 and COR-L105 cells exposed to 0.1% DMSO or 200 nM 17-AAG for 3 days, as determined using the CellTox membrane permeability assay.
FIG 5
FIG 5
The geldanamycin scaffold is required for the synthetic lethal interaction with NRF2. (A) Chemical structures of the HSP90 inhibitors 17-AAG, 17-DMAG, PU-H71, radicicol, NVP-BEP800, and BIIB021. (B to F) Viabilities, determined by total protein content, of monocultured A549 and COR-L105 cells exposed to the indicated concentrations of 17-DMAG, PU-H71, radicicol, NVP-BEP800, and BIIB021 for 8 days. (G) Visualization of monocultured A549 and COR-L105 cells, treated with 0.1% DMSO or 50 nM 17-DMAG, for 8 days. Scale bars = 300 μm. (H) Viabilities, determined by fluorescence intensity, of cocultured WT-GFP and Keap1 KO-mCherry cells exposed to the indicated concentrations of 17-DMAG for 8 days. (I) Visualization of the cocultured WT-GFP and Keap1 KO-mCherry cells shows that in response to DMSO, the coculture is dominated by mCherry-expressing cells, while in 17-DMAG-treated cells, the mCherry signal is significantly diminished, and the GFP-expressing cells expand their domain to fill the entire surface of the microplate well. Scale bars = 300 μm (J and K) Viabilities, determined by fluorescence intensity, of cocultured WT-GFP and Keap1 KO-mCherry cells exposed to the indicated concentrations of NVP-BEP800 and PU-H71 for 8 days.
FIG 6
FIG 6
Geldanamycin-derived IPI-504 is synthetic lethal with NRF2. (A) Viabilities, determined by total protein content, of monocultured A549 and COR-L105 cells exposed to the indicated concentrations of IPI-504 for 8 days. (B) Visualization of monocultured A549 and COR-L105 cells treated with 0.1% DMSO or 100 nM IPI-504 for 8 days. Scale bar = 300 μm. Note that only the A549 cells displayed toxicity by 100 nM IPI-504. (C) Viabilities, determined by total protein content, of monocultured Huh-1 and Hep3B cells exposed to the indicated concentrations of IPI-504 for 8 days. (D) Visualization of monocultured Huh-1 and Hep3B cells treated with 0.1% DMSO or 100 nM IPI-504 for 8 days. Scale bars = 300 μm. (E) Viabilities, determined by fluorescence intensity, of cocultured WT-GFP and Keap1 KO-mCherry cells exposed to the indicated concentrations of IPI-504 for 8 days. (F) Visualization of the cocultured WT-GFP and Keap1 KO-mCherry cells shows that in response to DMSO, the coculture is dominated by mCherry-expressing cells, while in response to increasing concentrations of IPI-504, the mCherry signal significantly diminishes, while the GFP-expressing cells expand their domain to fill the entire surface of the microplate well. Scale bars = 300 μm.
FIG 7
FIG 7
Metabolism of 17-AAG to 17-AAGH2 by the product of the NRF2 target gene NQO1 provides the specificity for the synthetic lethal interaction. (A) Structure of the geldanamycin drug scaffold, with the locations of the quinone groups indicated with asterisks. (B) Concentrations of the 17-AAG metabolite 17-AAGH2 analyzed using LC-MS, calculated based on the peak area detected at 4.9 min on the chromatograms, from samples collected from WT-GFP and Keap1 KO-mCherry cells exposed to the indicated concentrations of 17-AAG for 24 h. *, P < 0.05; **, P < 0.005. (C) The relative expression of the NRF2 target genes NQO1 and TXNRD1 from a range of human cancer cell lines as measured by qPCR. Cells with aberrant NRF2 activation are shown in black, while those with normal NRF2 regulation are shown in white. (D) Viabilities, determined by total protein content, of monocultured A549 and COR-L105 cells exposed to the indicated concentrations of β-lapachone for 8 days. Note that while β-lapachone is also a substrate for NQO1, A549 cells show decreased toxicity to β-lapachone. This is in sharp contrast to the toxicity profile of 17-AAG, suggesting that the synthetic lethal relationship between NRF2 and 17-AAG does not extend to all NQO1 substrates. (E) Viabilities, determined by total protein content, of monocultured A549 cells exposed to the indicated concentrations of 17-AAG, cotreated with the NQO1 inhibitor dicoumarol (10 μM) and/or the TXNRD1 inhibitor auranofin (50 nM), for 4 days. *, P < 0.05. (F) Immunoblot showing the NQO1 status of four different Huh-1 CRISPR-Cas9-generated clones. Only clone number 6 is a knockout. (G) Relative survival, determined by total protein content, of Huh-1 cells exposed to the indicated concentrations of 17-AAG for 8 days and cotreated with the TXNRD1 inhibitor auranofin (AUR; 100 nM) or compared to the isogenic NQO1 KO cell line generated using CRISPR-Cas9.
FIG 8
FIG 8
17-AAG displays activity against NRF2-dependent tumors in vivo and when used in combination with AKT inhibition. (A) Representative IVIS images of in vivo mCherry expression from Keap1-mCherry Hepa1 cells transplanted into nude mice. The mice were treated with either a vehicle or 100 mg/kg of 17-AAG three times per week for 3 weeks. (B) Fold change in tumor size determined by in vivo mCherry expression over the 21-day 17-AAG treatment period shown in panel A (n = 5 mice per group). *, P < 0.05. (C) Over the 21-day experimental period, treatment with 100 mg/kg of 17-AAG had no impact on mouse body weight changes relative to the vehicle control. (D) Viabilities, determined by total protein content, of monocultured A549 and COR-L105 cells exposed to the indicated concentrations of the AKT inhibitor MK2206, with or without 100 nM 17-AAG, for 8 days. Note that only the A549 cells displayed increased toxicity by MK-2206 when cotreated with 100 nM 17-AAG. (E) Viabilities, determined by total protein content, of monocultured Huh-1 and Hep3B cells exposed to the indicated concentrations of the AKT inhibitor MK2206, with or without 100 nM 17-AAG, for 8 days. (F) Viabilities, determined by total protein content, of monocultured Huh-1 and Hep3B cells exposed to the indicated concentrations of paclitaxel, with or without 200 nM 17-AAG, for 8 days.
FIG 9
FIG 9
The mechanism through which 17-AAG is synthetic lethal with NRF2 activity. In NRF2-activated tumors, high levels of NRF2 result in increased cytoprotective enzyme gene expression, particularly for NQO1. For a given concentration of 17-AAG, the higher levels of NRF2 target gene expression result in a significant increase in the generation of the 17-AAG metabolite 17-AAGH2, which results in enhanced HSP90 inhibition and cell death.

References

    1. Sanchez-Vega F, Mina M, Armenia J, Chatila WK, Luna A, La KC, Dimitriadoy S, Liu DL, Kantheti HS, Saghafinia S, Chakravarty D, Daian F, Gao Q, Bailey MH, Liang WW, Foltz SM, Shmulevich I, Ding L, Heins Z, Ochoa A, Gross B, Gao J, Zhang H, Kundra R, Kandoth C, Bahceci I, Dervishi L, Dogrusoz U, Zhou W, Shen H, Laird PW, Way GP, Greene CS, Liang H, Xiao Y, Wang C, Iavarone A, Berger AH, Bivona TG, Lazar AJ, Hammer GD, Giordano T, Kwong LN, McArthur G, Huang C, Tward AD, Frederick MJ, McCormick F, Meyerson M, Van Allen EM, Cancer Genome Atlas Research Network, et al. 2018. Oncogenic signaling pathways in The Cancer Genome Atlas. Cell 173:321–337.e10. doi:10.1016/j.cell.2018.03.035. - DOI - PMC - PubMed
    1. Lazo JS, Sharlow ER. 2016. Drugging undruggable molecular cancer targets. Annu Rev Pharmacol Toxicol 56:23–40. doi:10.1146/annurev-pharmtox-010715-103440. - DOI - PubMed
    1. Padmanabhan B, Tong KI, Ohta T, Nakamura Y, Scharlock M, Ohtsuji M, Kang MI, Kobayashi A, Yokoyama S, Yamamoto M. 2006. Structural basis for defects of Keap1 activity provoked by its point mutations in lung cancer. Mol Cell 21:689–700. doi:10.1016/j.molcel.2006.01.013. - DOI - PubMed
    1. Shibata T, Ohta T, Tong KI, Kokubu A, Odogawa R, Tsuta K, Asamura H, Yamamoto M, Hirohashi S. 2008. Cancer related mutations in NRF2 impair its recognition by Keap1-Cul3 E3 ligase and promote malignancy. Proc Natl Acad Sci U S A 105:13568–13573. doi:10.1073/pnas.0806268105. - DOI - PMC - PubMed
    1. Cancer Genome Atlas Research Network. 2012. Comprehensive genomic characterization of squamous cell lung cancers. Nature 489:519–525. doi:10.1038/nature11404. - DOI - PMC - PubMed

Publication types

MeSH terms