

KDM5B Is Essential for the Hyperactivation of PI3K/AKT Signaling in Prostate Tumorigenesis
- PMID: 32868382
- PMCID: PMC8034842
- DOI: 10.1158/0008-5472.CAN-20-0505
KDM5B Is Essential for the Hyperactivation of PI3K/AKT Signaling in Prostate Tumorigenesis
Abstract
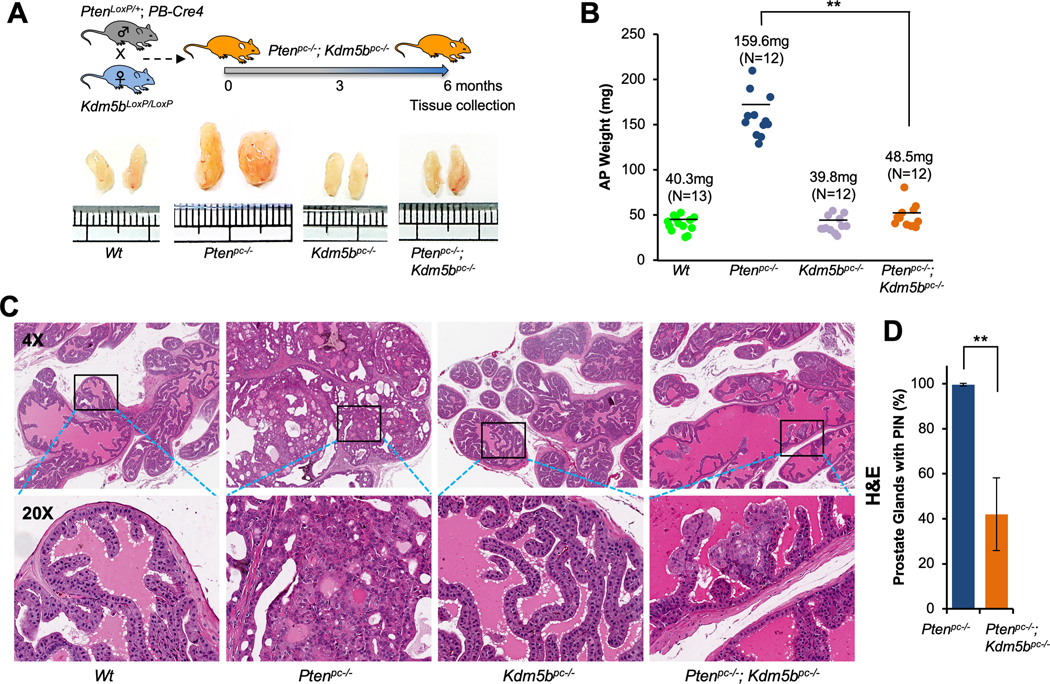
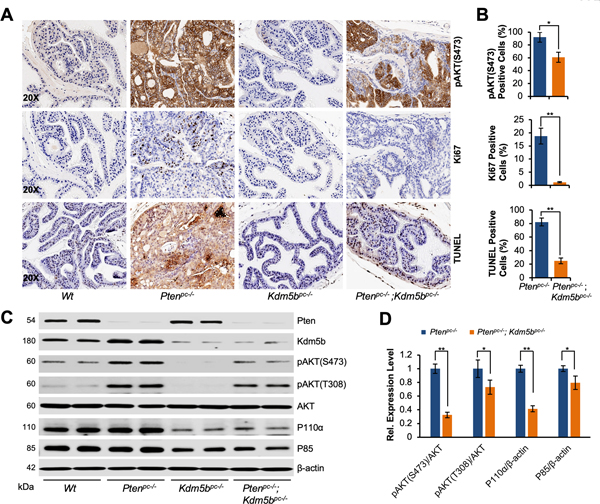
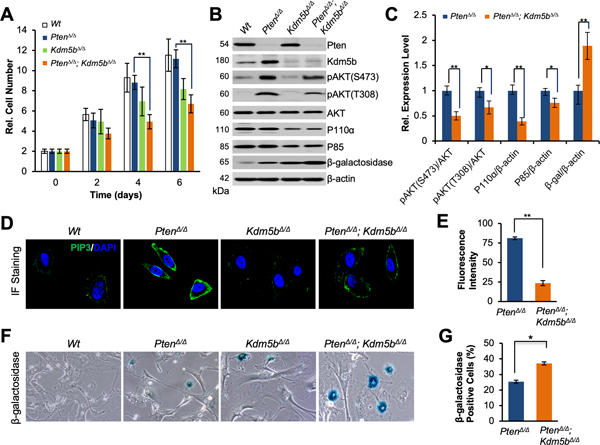
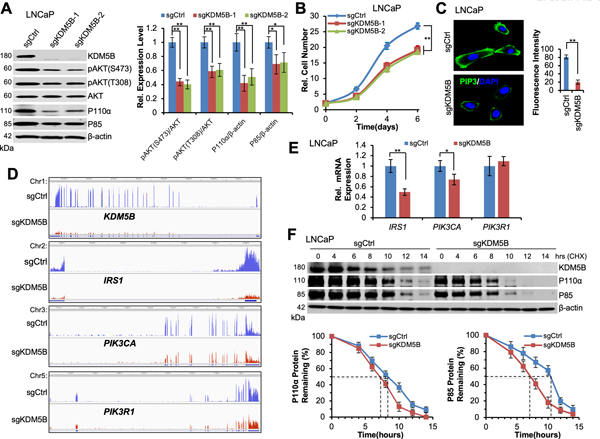
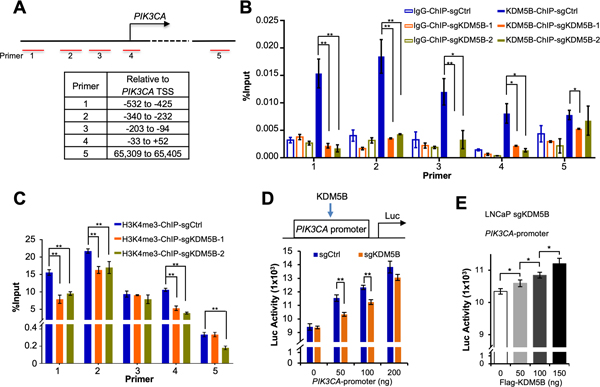
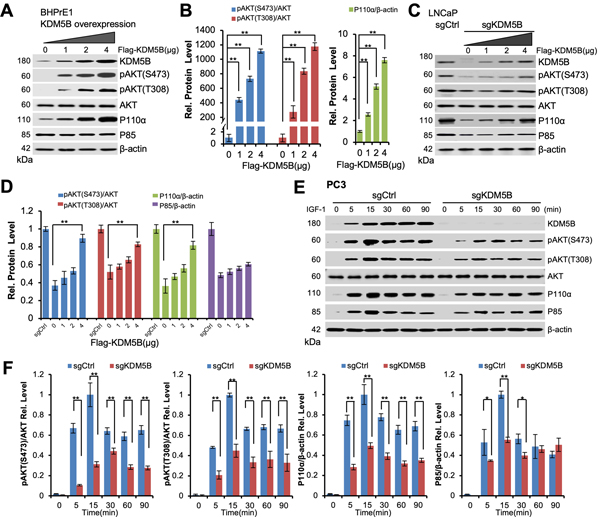
KDM5B (lysine[K]-specific demethylase 5B) is frequently upregulated in various human cancers including prostate cancer. KDM5B controls H3K4me3/2 levels and regulates gene transcription and cell differentiation, yet the contributions of KDM5B to prostate cancer tumorigenesis remain unknown. In this study, we investigated the functional role of KDM5B in epigenetic dysregulation and prostate cancer progression in cultured cells and in mouse models of prostate epithelium-specific mutant Pten/Kdm5b. Kdm5b deficiency resulted in a significant delay in the onset of prostate cancer in Pten-null mice, whereas Kdm5b loss alone caused no morphologic abnormalities in mouse prostates. At 6 months of age, the prostate weight of Pten/Kdm5b mice was reduced by up to 70% compared with that of Pten mice. Pathologic analysis revealed Pten/Kdm5b mice displayed mild morphologic changes with hyperplasia in prostates, whereas age-matched Pten littermates developed high-grade prostatic intraepithelial neoplasia and prostate cancer. Mechanistically, KDM5B governed PI3K/AKT signaling in prostate cancer in vitro and in vivo. KDM5B directly bound the PIK3CA promoter, and KDM5B knockout resulted in a significant reduction of P110α and PIP3 levels and subsequent decrease in proliferation of human prostate cancer cells. Conversely, KDM5B overexpression resulted in increased PI3K/AKT signaling. Loss of Kdm5b abrogated the hyperactivation of AKT signaling by decreasing P110α/P85 levels in Pten/Kdm5b mice. Taken together, our findings reveal that KDM5B acts as a key regulator of PI3K/AKT signaling; they also support the concept that targeting KDM5B is a novel and effective therapeutic strategy against prostate cancer. SIGNIFICANCE: This study demonstrates that levels of histone modification enzyme KDM5B determine hyperactivation of PI3K/AKT signaling in prostate cancer and that targeting KDM5B could be a novel strategy against prostate cancer.
©2020 American Association for Cancer Research.
Figures
Similar articles
-
SKP2 inactivation suppresses prostate tumorigenesis by mediating JARID1B ubiquitination.Oncotarget. 2015 Jan 20;6(2):771-88. doi: 10.18632/oncotarget.2718. Oncotarget. 2015. PMID: 25596733 Free PMC article.
-
KDM5B regulates the PTEN/PI3K/Akt pathway to increase sorafenib-resistance in hepatocellular carcinoma.Anticancer Drugs. 2022 Oct 1;33(9):840-849. doi: 10.1097/CAD.0000000000001329. Epub 2022 Aug 9. Anticancer Drugs. 2022. PMID: 35946516
-
AKT Inhibition Modulates H3K4 Demethylase Levels in PTEN-Null Prostate Cancer.Mol Cancer Ther. 2019 Feb;18(2):356-363. doi: 10.1158/1535-7163.MCT-18-0141. Epub 2018 Nov 16. Mol Cancer Ther. 2019. PMID: 30446585 Free PMC article.
-
Interplay Among PI3K/AKT, PTEN/FOXO and AR Signaling in Prostate Cancer.Adv Exp Med Biol. 2019;1210:319-331. doi: 10.1007/978-3-030-32656-2_14. Adv Exp Med Biol. 2019. PMID: 31900915 Review.
-
Histone demethylase lysine demethylase 5B in development and cancer.Oncotarget. 2017 Jan 31;8(5):8980-8991. doi: 10.18632/oncotarget.13858. Oncotarget. 2017. PMID: 27974677 Free PMC article. Review.
Cited by
-
Single-cell RNA-seq analysis revealed the stemness of a specific cluster of B cells in acute lymphoblastic leukemia progression.PeerJ. 2024 Oct 21;12:e18296. doi: 10.7717/peerj.18296. eCollection 2024. PeerJ. 2024. PMID: 39465162 Free PMC article.
-
KDM5B predicts temozolomide-resistant subclones in glioblastoma.iScience. 2023 Dec 3;27(1):108596. doi: 10.1016/j.isci.2023.108596. eCollection 2024 Jan 19. iScience. 2023. PMID: 38174322 Free PMC article.
-
Epigenetic (De)regulation in Prostate Cancer.Cancer Treat Res. 2023;190:321-360. doi: 10.1007/978-3-031-45654-1_10. Cancer Treat Res. 2023. PMID: 38113006 Free PMC article.
-
Identification of the shared gene signatures and pathways between polycystic ovary syndrome and endometrial cancer: An omics data based combined approach.PLoS One. 2022 Jul 13;17(7):e0271380. doi: 10.1371/journal.pone.0271380. eCollection 2022. PLoS One. 2022. PMID: 35830453 Free PMC article.
-
Entecavir: A Review and Considerations for Its Application in Oncology.Pharmaceuticals (Basel). 2023 Nov 14;16(11):1603. doi: 10.3390/ph16111603. Pharmaceuticals (Basel). 2023. PMID: 38004468 Free PMC article. Review.
References
-
- Siegel RL, Miller KD, Jemal A. Cancer statistics, 2020. CA Cancer J Clin 2020;70:7–30. - PubMed
-
- Deocampo ND, Huang H, Tindall DJ. The role of PTEN in the progression and survival of prostate cancer. Minerva Endocrinol 2003;28:145–53. - PubMed
-
- Bose S, Crane A, Hibshoosh H, Mansukhani M, Sandweis L, Parsons R. Reduced expression of PTEN correlates with breast cancer progression. Hum Pathol 2002;33:405–9. - PubMed
-
- Wang JY, Huang TJ, Chen FM, Hsieh MC, Lin SR, Hou MF, et al. Mutation analysis of the putative tumor suppressor gene PTEN/MMAC1 in advanced gastric carcinomas. Virchows Arch 2003;442:437–43. - PubMed
-
- Sun H, Enomoto T, Shroyer KR, Ozaki K, Fujita M, Ueda Y, et al. Clonal analysis and mutations in the PTEN and the K-ras genes in endometrial hyperplasia. Diagn Mol Pathol 2002;11:204–11. - PubMed
Publication types
MeSH terms
Substances
Grants and funding
LinkOut - more resources
Full Text Sources
Medical
Molecular Biology Databases
Research Materials
Miscellaneous
