. 2020 Oct 7;40(41):7855-7876.
doi: 10.1523/JNEUROSCI.0361-20.2020. Epub 2020 Aug 31.

Parvalbumin+ and Npas1+ Pallidal Neurons Have Distinct Circuit Topology and Function

Affiliations

Parvalbumin+ and Npas1+ Pallidal Neurons Have Distinct Circuit Topology and Function

Arin Pamukcu et al. J Neurosci. .

Abstract

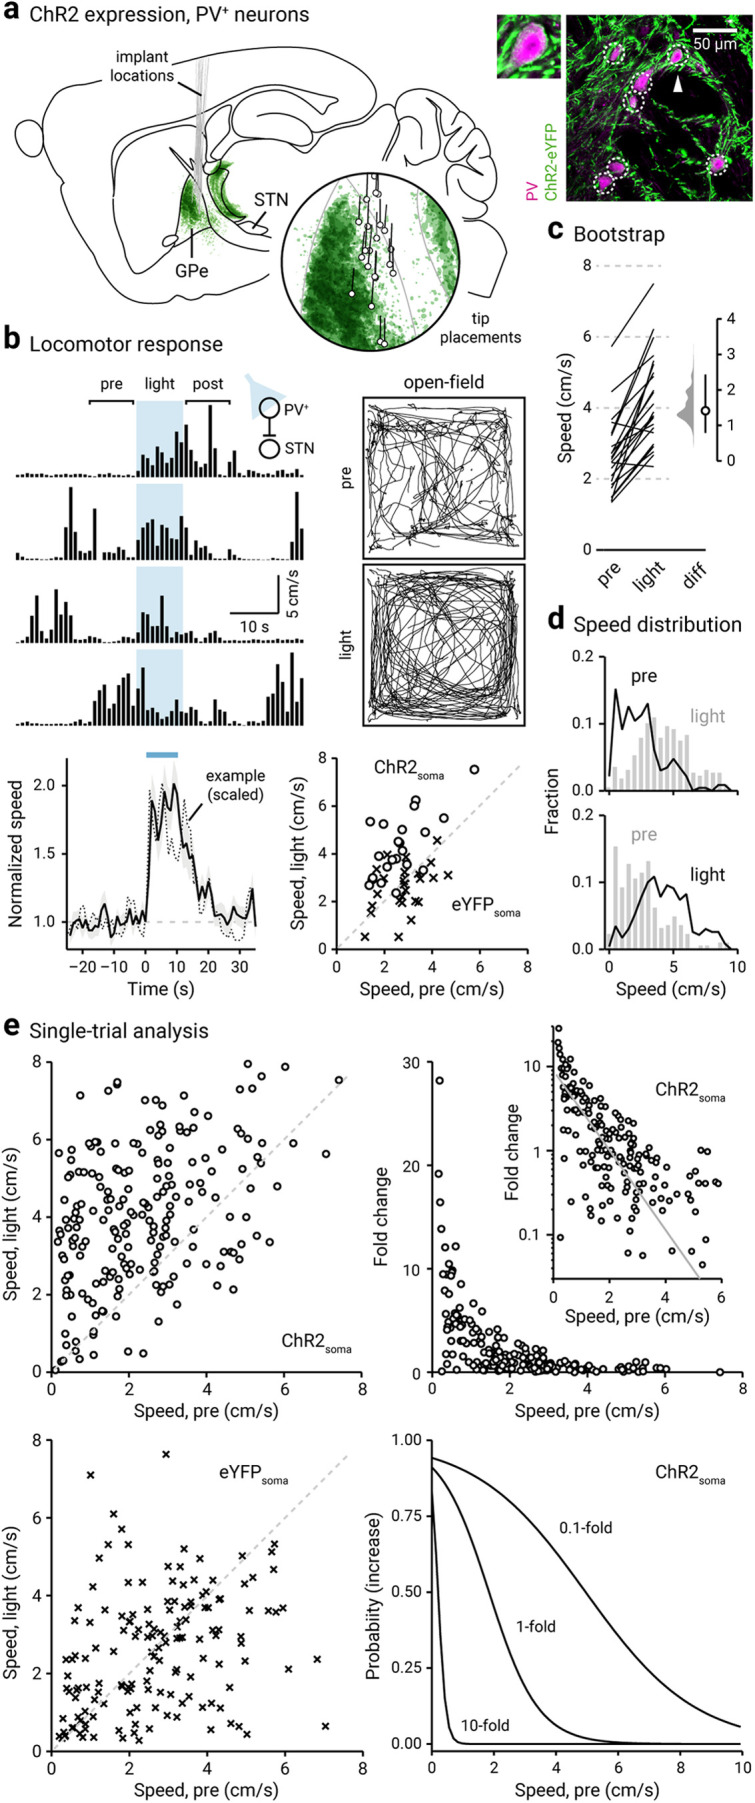
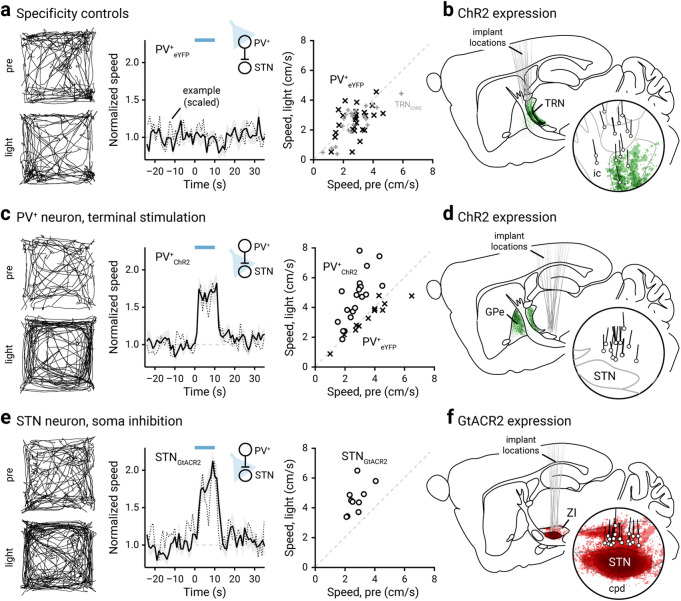
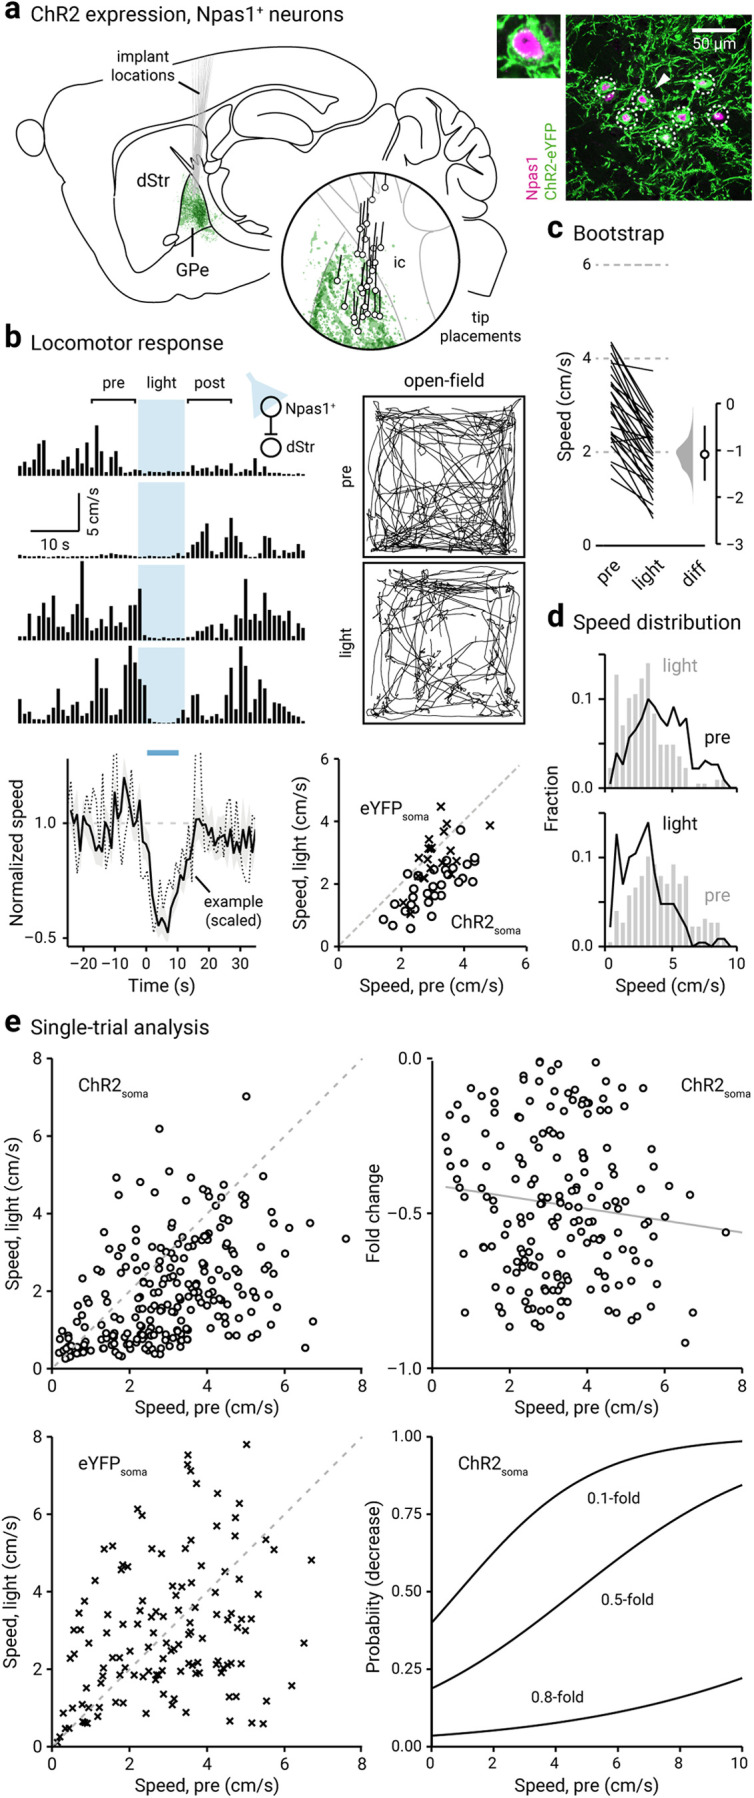
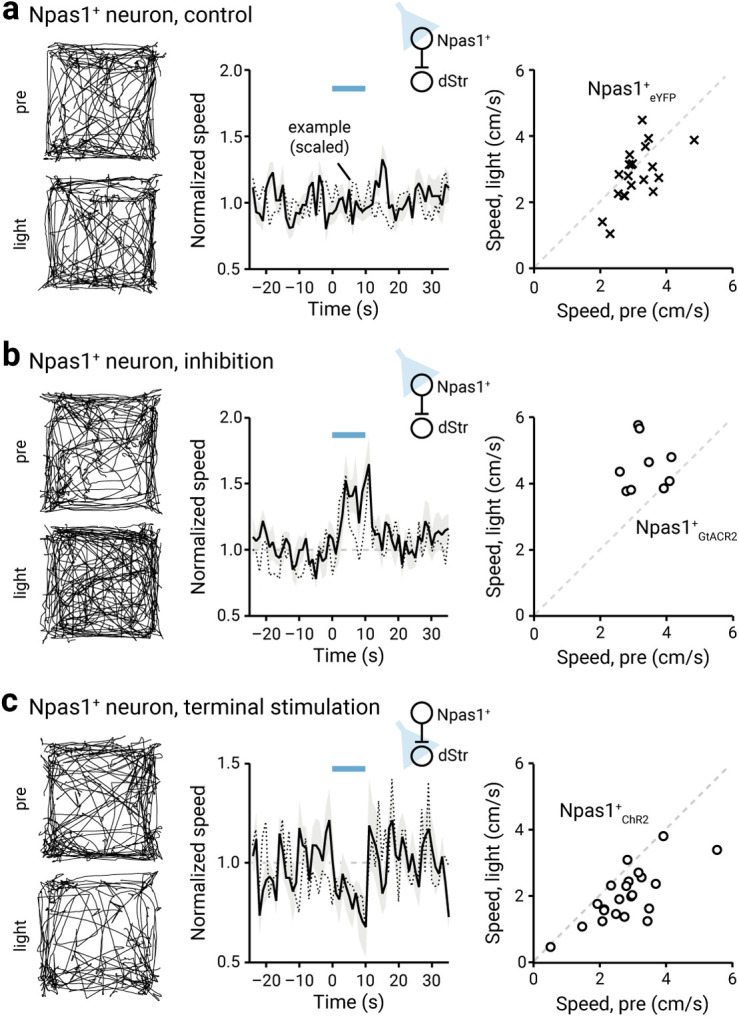
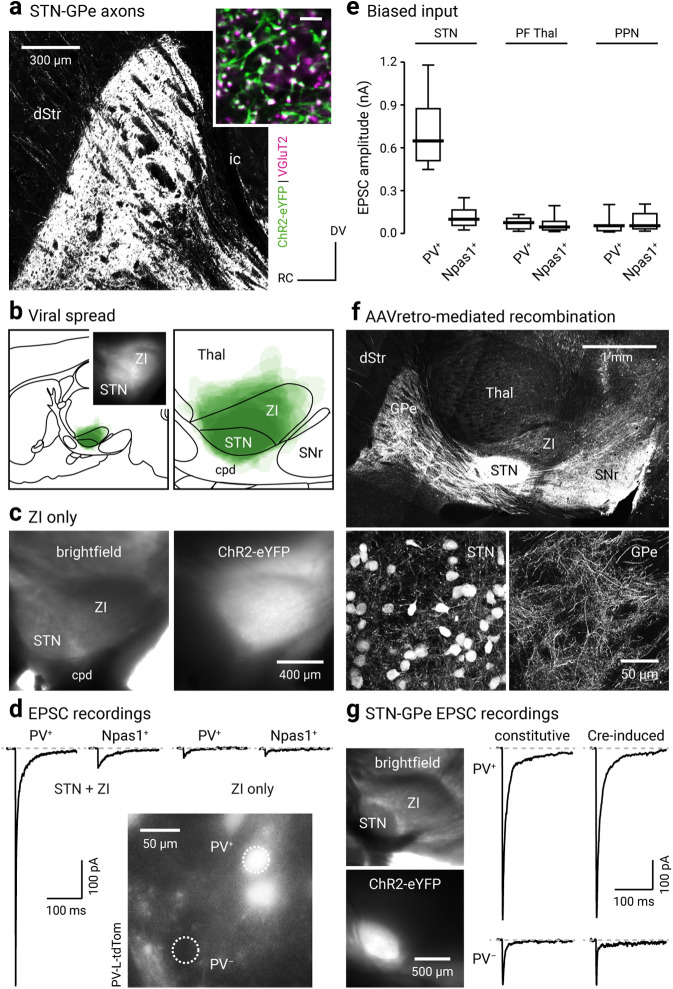
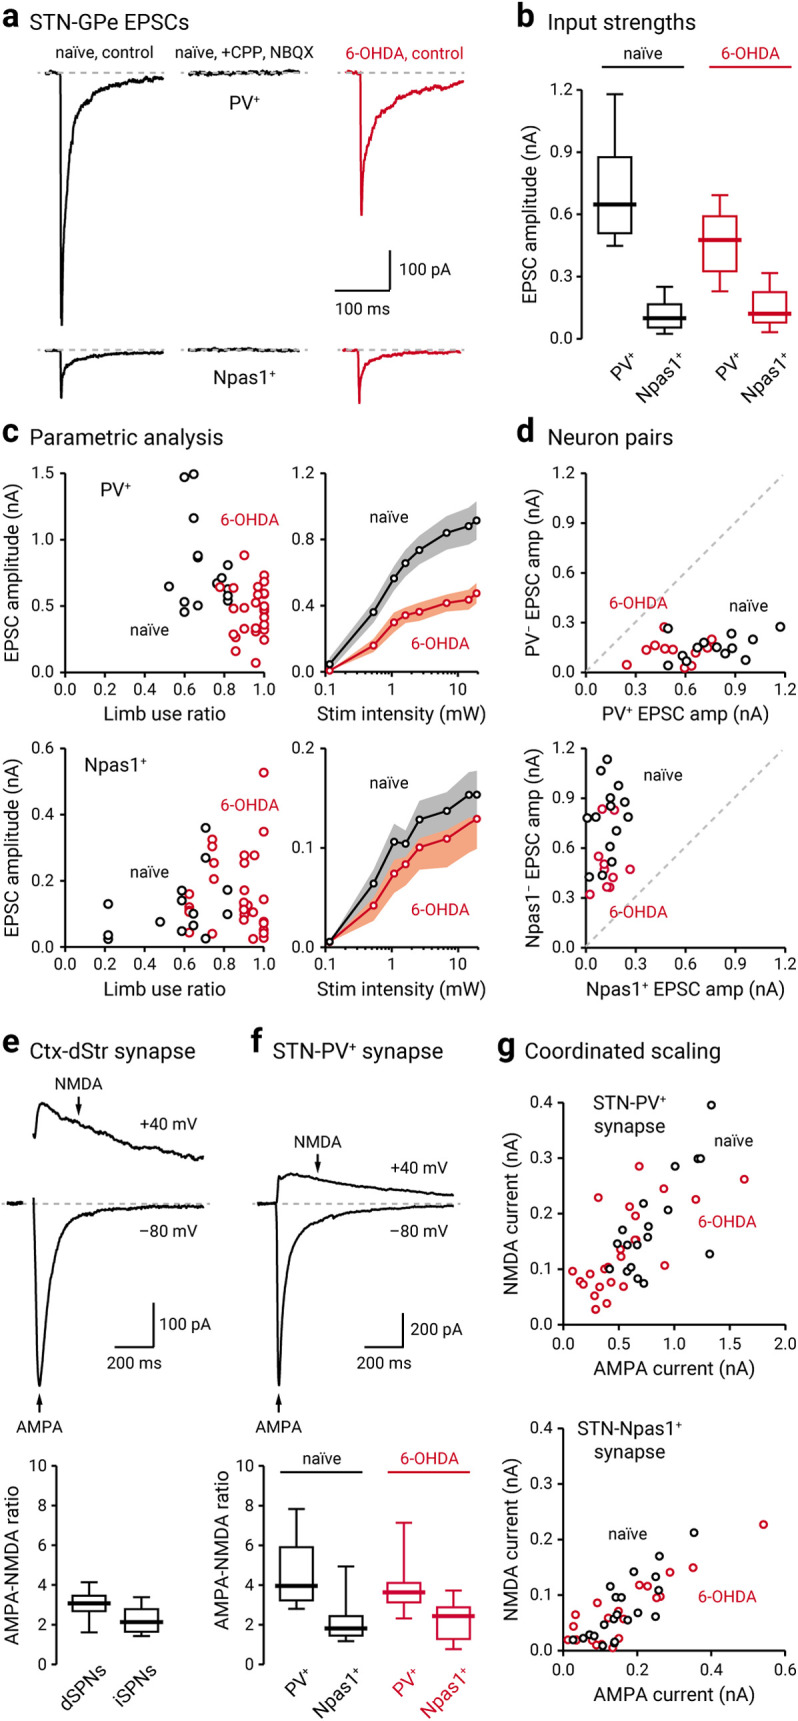
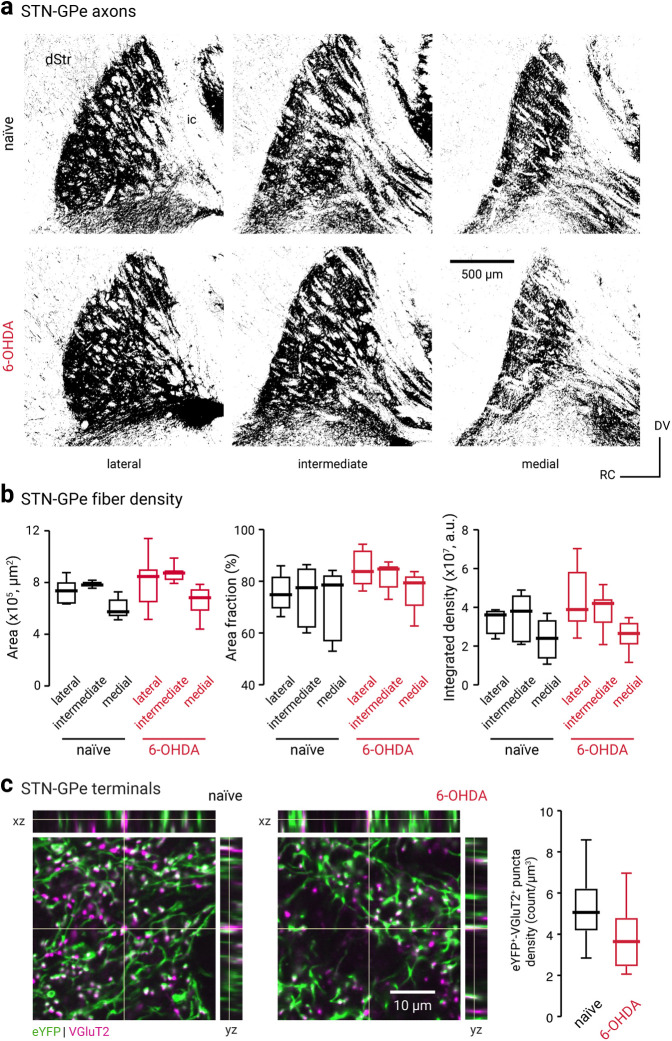
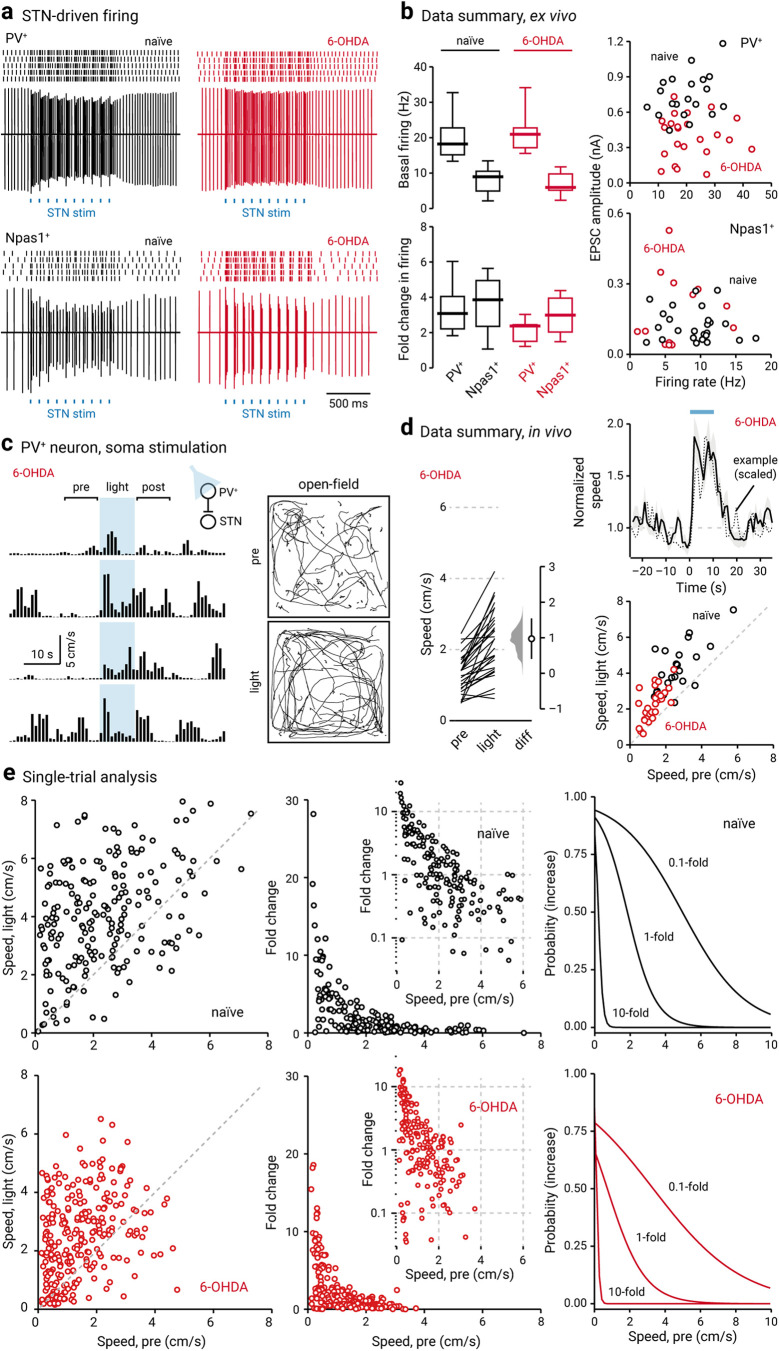
The external globus pallidus (GPe) is a critical node within the basal ganglia circuit. Phasic changes in the activity of GPe neurons during movement and their alterations in Parkinson's disease (PD) argue that the GPe is important in motor control. Parvalbumin-positive (PV+) neurons and Npas1+ neurons are the two principal neuron classes in the GPe. The distinct electrophysiological properties and axonal projection patterns argue that these two neuron classes serve different roles in regulating motor output. However, the causal relationship between GPe neuron classes and movement remains to be established. Here, by using optogenetic approaches in mice (both males and females), we showed that PV+ neurons and Npas1+ neurons promoted and suppressed locomotion, respectively. Moreover, PV+ neurons and Npas1+ neurons are under different synaptic influences from the subthalamic nucleus (STN). Additionally, we found a selective weakening of STN inputs to PV+ neurons in the chronic 6-hydroxydopamine lesion model of PD. This finding reinforces the idea that the reciprocally connected GPe-STN network plays a key role in disease symptomatology and thus provides the basis for future circuit-based therapies.SIGNIFICANCE STATEMENT The external pallidum is a key, yet an understudied component of the basal ganglia. Neural activity in the pallidum goes awry in neurologic diseases, such as Parkinson's disease. While this strongly argues that the pallidum plays a critical role in motor control, it has been difficult to establish the causal relationship between pallidal activity and motor function/dysfunction. This was in part because of the cellular complexity of the pallidum. Here, we showed that the two principal neuron types in the pallidum have opposing roles in motor control. In addition, we described the differences in their synaptic influence. Importantly, our research provides new insights into the cellular and circuit mechanisms that explain the hypokinetic features of Parkinson's disease.

Keywords: 6-OHDA; Parkinson's disease; basal ganglia; globus pallidus; motor control; subthalamic nucleus.


Figures

Figure 1.
Figure 1.
Optogenetic stimulation of PV+ neurons promotes locomotion. a, Left, Representation of ChR2-eYFP expression patterns and fiber-optic implant locations in PV-Cre mice (n = 12). Inset, Representation of optical fiber tip placements in relation to the GPe and neighboring structures. Right, Confocal micrographs showing the cellular specificity of ChR2-eYFP expression in the GPe. For clarity, a magnified example (arrowhead) is shown. b, Top, left, A representative example of the locomotor activity of a single mouse across four trials. The schematic diagram shows the site of light delivery. Blue shaded area indicates the duration (10 s) of light delivery. Top, right, Movement tracks corresponding to the pre-period (top) and light-period (bottom). Six representative mice (10 trials from each) are presented. Bottom, left, A plot showing the relationship between normalized speed and time. Blue bar indicates the duration (10 s) of light delivery. The dotted horizontal line indicates the baseline locomotor activity level. Black solid trace is the population mean calculated from all mice; shading indicates the SEM. Black dotted trace is a representative example from a single mouse; data were scaled to facilitate comparison. Bottom, right, Speed during light-period against speed during pre-period is plotted. Data from PV-Cre mice expressing ChR2-eYFP (circles) and eYFP (crosses) are displayed. Each marker represents a mouse. The diagonal line indicates unity (i.e., x = y). Data points for ChR2-eYFP are systematically shifted upward relative to unity. c, Slopegraph showing the response of each mouse on optogenetic stimulation of PV+ neurons. The slope of each line shows the magnitude and direction of change. Median difference is plotted on a floating axis. The smoothed density represents bootstrap resampled data. The median difference is indicated as a circle, and the 95% confidence interval is indicated by the length of vertical lines. d, Speed distributions of mice during pre-period and light-period are shown. e, Top, left, A scatter plot showing the pairwise relationship between speed during light-period and speed during pre-period from PV-Cre mice expressing ChR2-eYFP. Each marker is a trial. The diagonal line indicates unity. Top right, Fold change in speed with light delivery against speed during pre-period from PV-Cre mice expressing ChR2-eYFP. Each marker is a trial. Inset, Same data displayed with fold increase on a log scale. Grayline is a monoexponential fit of the data. Bottom, left, A plot showing the speed during light-period versus speed during pre-period. Data from PV-Cre mice expressing eYFP are displayed. Each marker is a trial. The diagonal line indicates unity. Bottom, right, Probability of increase against speed during pre-period. Logistic regression curves fitted to data for 0.1-fold, 1-fold, and 10-fold increases are displayed.
Figure 2.
Figure 2.
Inhibition of STN promotes locomotion. a, Left, Movement tracks corresponding to the pre-period (top) and light-period (bottom). Six representative mice (10 trials from each) are presented. Middle, A plot showing the relationship between normalized speed and time. Blue bar indicates the duration (10 s) of light delivery. The dotted horizontal line indicates the baseline locomotor activity level. Black solid trace is the population mean calculated from all mice; shading indicates the SEM. Black dotted trace is a representative example from a single mouse; data were scaled to facilitate comparison. The same presentation scheme is used in c and e. Data from eYFP-expressing PV-Cre mice are shown; light was delivered to the GPe. Data from the same mice (crosses) are presented on the right in a scatterplot, which shows the speed during light delivery versus speed during pre-period. Mice with ChR2-expressed in TRN neurons are used as additional controls (gray pluses). b, Representation of targeted ChR2-eYFP expression patterns and fiber-optic implant locations in PV-Cre mice (n = 11). The TRN was targeted in these experiments. c, Left, middle, Data from optogenetic stimulation of PV+ neuron terminals in the STN are shown. Right, eYFP-expressing mice (in PV+ neurons) were used as controls (crosses). d, Representation of ChR2-eYFP expression patterns and fiber-optic implant locations in PV-Cre mice (n = 10). ChR2-expressing PV+ neuron terminals in the STN were targeted. e, Data from optogenetic inhibition of STN neurons with GtACR2 are shown. f, Representation of GtACR2-FusionRed expression patterns and fiber-optic implant locations in C57BL/6J mice (n = 10). The STN was targeted in these experiments. cpd, Cerebral peduncle; ic, internal capsule.
Figure 3.
Figure 3.
Optogenetic stimulation of Npas1+ neurons suppresses locomotion. a, Left, Representation of ChR2-eYFP expression patterns and fiber-optic implant locations in Npas1-Cre-tdTom mice (n = 14). Inset, Representation of optical fiber tip placements in relation to the GPe and neighboring structures. Right, Confocal micrographs showing the cellular specificity of ChR2-eYFP expression in the GPe. For clarity, a magnified example (arrowhead) is shown. ic, Internal capsule. b, Top, left, A representative example of the locomotor activity of a single mouse across four trials. The schematic diagram shows the site of light delivery. Blue shaded area indicates the duration (10 s) of light delivery. Top, right, Movement tracks corresponding to the pre-period (top) and light-period (bottom). Six representative mice (10 trials from each) are presented. Bottom, left, A plot showing the relationship between normalized speed and time. Blue bar indicates the duration (10 s) of light delivery. The dotted horizontal line indicates the baseline locomotor activity level. Black solid trace is the population mean calculated from all mice; shading indicates the SEM. Black dotted trace is a representative example from a single mouse; data were scaled to facilitate comparison. Bottom, right, Speed during light-period against speed during pre-period is plotted. Data from Npas1-Cre-tdTom mice expressing ChR2-eYFP (circles) and eYFP (crosses) are displayed. Each marker represents a mouse. The diagonal line indicates unity (i.e., x = y). Data points for ChR2-eYFP are systematically shifted downward relative to unity. c, Slopegraph showing the response of each mouse on optogenetic stimulation of Npas1+ neurons. The slope of each line shows the magnitude and direction of change. Median difference is plotted on a floating axis. The smoothed density represents bootstrap resampled data. The median difference is indicated as a circle, and the 95% confidence interval is indicated by the length of vertical lines. d, Speed distributions of mice during pre-period and light-period are shown. e, Top, left, A scatter plot showing the pairwise relationship between speed during light-period and speed during pre-period from Npas1-Cre-tdTom mice expressing ChR2-eYFP. Each marker is a trial. The diagonal line indicates unity. Top, right, Fold change in speed with light delivery against speed during pre-period from Npas1-Cre-tdTom mice expressing ChR2-eYFP. Each marker is a trial. Grayline is a linear fit of the data. Bottom left, A plot showing the speed during light-period versus speed during pre-period. Data from Npas1-Cre-tdTom mice expression eYFP are displayed. Each marker is a trial. The diagonal line indicates unity. Bottom, right, Probability of decrease against speed during pre-period. Logistic regression curves fitted to data for 0.1-fold, 0.5-fold, and 0.8-fold decreases are displayed.
Figure 4.
Figure 4.
Ongoing Npas1+ neuron activity suppresses locomotion. a, Left, Movement tracks corresponding to the pre-period (top) and light-period (bottom). Six representative mice (10 trials from each) are presented. Middle, A plot showing the relationship between normalized speed and time. Blue bar indicates the duration (10 s) of light delivery. The dotted horizontal line indicates the baseline locomotor activity level. Black solid trace is the population mean calculated from all mice; shading indicates the SEM. Black dotted trace is a representative example from a single mouse; data were scaled to facilitate comparison. The same presentation scheme is used in b and c. Data from eYFP-expressing Npas1-Cre-tdTom mice are shown; light was delivered to the GPe. b, Data from GtACR2-expressing Npas1-Cre-tdTom mice are shown; light was delivered to the GPe. c, Data from optogenetic stimulation of Npas1+ neuron terminals in the dStr are shown.
Figure 5.
Figure 5.
STN input is biased toward PV+ neurons. a, A confocal micrograph of a sagittal brain section showing eYFP-labeled STN axons in the GPe (in a mouse injected with a ChR2-eYFP AAV in the STN). Inset, High-magnification confocal micrograph showing the spatial relationship between eYFP-labeled STN axons (green) and VGluT2 (magenta) labeling. Scale bar, 5 µm. b, Left, A schematic showing viral spread overlaid for each subject (n = 9) used for ex vivo experiments. Inset, A representative epifluorescent image of a parasagittal acute brain slice showing the expression of ChR2-eYFP in the STN and the neighboring areas. Right, A magnified view of transduced areas is shown. c, Left, A bright-field image of a parasagittal acute brain slice showing STN and ZI. Right, eYFP signal from the same slice showing transduction only in the ZI but not the STN. d, EPSCs recorded in PV+ neurons and Npas1+ neurons in mice that had STN + ZI and ZI only transductions. Inset, Epifluorescence image from ex vivo tissue showing the GPe of a PV-L-tdTom mouse with tdTomato+ (PV+) and tdTomato (PV) neurons within the same field. e, Box plots summarizing the amplitude of EPSCs recorded in PV+ neurons and Npas1+ neurons with optogenetic stimulation of terminals from the STN, the PF Thal, or the PPN. f, Top, A montage of confocal micrographs from a sagittal brain section in a mouse injected with AAVretro-Cre in the SNr, along with CreOn ChR2-eYFP-expressing AAVs in the STN. These images show that eYFP-labeled STN axons are arborized throughout the GPe and SNr. Bottom, High-magnification images showing eYFP-labeled neurons in the STN (left) and their axons in the GPe (right). g, Left, CreOn expression of ChR2-eYFP in the STN (top), where eYFP labeling (bottom) is localized within the STN. Right, Representative EPSC recordings from voltage-clamped PV+ neurons (top) and PV neurons (bottom) in mice with constitutive (left) or CreOn (right) expression of ChR2-eYFP in the STN. cpd, Cerebral peduncle; ic, internal capsule.
Figure 6.
Figure 6.
STN–GPe input is weakened following chronic 6-OHDA lesion. a, Left, Representative voltage-clamped recordings of a PV+ neuron (top) and a Npas1+ neuron (bottom) in naïve mice (black) showing that optogenetic stimulation of STN terminals evoked EPSCs. Middle, Application of CPP (10 μm) and NBQX (5 μm) completely eliminated the evoked EPSCs. Right, Representative EPSC recordings from a voltage-clamped PV+ neuron and a Npas1+ neuron in a chronic 6-OHDA lesioned mouse (red). b, Population data showing EPSC amplitudes measured from PV+ neurons and Npas1+ neurons. Data from naïve (black) and chronic 6-OHDA-lesioned (red) mice are shown. c, Left, EPSC amplitudes of PV+ neurons (top) or Npas1+ neurons (bottom) were plotted against limb use ratio, which provides a measure of the extent of the lesion. Each marker indicates a cell. Right, Input–output curves from EPSCs measured from PV+ neurons (top) and Npas1+ neurons (bottom). Each circle represents the mean EPSC amplitude measured at a particular light intensity, and the shaded area indicates SEM. d, Top, EPSC amplitudes measured from neighboring (within 150 µm apart) PV+ neurons and PV neurons in naïve (black) and chronic 6-OHDA-lesioned (red) PV-L-tdTom mice. Bottom, EPSC amplitudes measured from neighboring Npas1+ neurons and Npas1 neurons in naïve (black) and chronic 6-OHDA-lesioned (red) Npas1-Cre-tdTom mice. Each marker represents a pair of positively and negatively identified neurons recorded from the same field. The dashed line represents the unity line. e, Top, Representative synaptic responses from a voltage-clamped SPN in the dStr. Corticostriatal (Ctx-Str) EPSCs were evoked with electrical stimulation; stimulus artifacts are not displayed. The gray line represents the baseline. Neurons were voltage clamped at –80 and +40 mV to measure AMPA and NMDA receptor-dependent currents, respectively. The stimulation artifact was removed for clarity. Bottom, Population data for AMPA-NMDA ratio in dSPNs and iSPNs. f, Top, Representative synaptic responses from a voltage-clamped PV+ neuron. EPSCs were measured with optogenetic stimulation of STN input. Note the relatively small NMDA current in the STN–PV+ input. Bottom, Population data for AMPA-NMDA ratio in PV+ neurons and Npas1+ neurons with stimulation of STN terminals in naïve (black) and chronic 6-OHDA-lesioned (red) mice. g, The relationship between NMDA current and AMPA current in PV+ neurons (top) and Npas1+ neurons (bottom; with stimulation of STN input) in naïve (black) and chronic 6-OHDA-lesioned (red) mice. Each marker represents a cell.
Figure 7.
Figure 7.
The cell type specificity of STN–GPe EPSCs is not because of topographical biasing. a, Confocal micrographs showing the GPe in sagittal brain sections of a naïve (top, black) or chronic 6-OHDA-lesioned (bottom, red) C57BL/6J mice with ChR2-eYFP-expressing AAVs in the STN. Lateral, intermediate, and medial sections of the GPe are shown. ic, Internal capsule. b, Analysis of the eYFP signal in naïve (black) and chronic 6-OHDA-lesioned (red) mice. The surface area of the GPe (left), the percentage area covered by the eYFP signal (middle), and the integrated density of the eYFP signal (right) are quantified. c, Left and middle, Confocal micrographs showing the density of eYFP- and VGluT2-immunoreactive elements in the GPe from naïve and chronic 6-OHDA-lesioned mice. Breakout panels show orthogonal xz projection (top) and yz projection (right). Crosshairs indicate the pixel of interest. The colocalization of the signals is shown as white. Right, Box plots summarize the density of putative STN–GPe terminals in naïve (black) and chronic 6-OHDA-lesioned (red) mice.
Figure 8.
Figure 8.
PV+ neuron stimulation lessens hypokinetic symptoms. a, Top, Representative cell-attached recordings from PV+ neurons in naïve (left, black) and chronic 6-OHDA-lesioned (right, red) mice. Raster plots show trials from a single PV+ neuron, where each raster corresponds to an action potential. Bottom, Representative cell-attached recordings from Npas1+ neurons in naïve (left, black) and 6-OHDA-lesioned (right, red) mice. Each blue square represents a 2 ms light pulse delivered to the GPe. b, Left, Box plots summarizing the population data from naïve (left, black) and chronic 6-OHDA-lesioned (right, red) mice. Right, Scatter plots showing the relationship between EPSC amplitude and spontaneous firing rate of PV+ neurons (top) and Npas1+ neurons (bottom). Data from both naïve (black) and chronic 6-OHDA-lesioned (red) mice are displayed. Each marker indicates a cell. c, Open field activity in response to optogenetic stimulation of PV+ neurons in the GPe in chronic 6-OHDA-lesioned mice. Left, A representative example of locomotion activity of a chronic 6-OHDA-lesioned mouse across four individual trials. The schematic diagram shows the cell type and site of light delivery. Pre-period indicates 10 s before light delivery; post-period indicates 10 s after light delivery. Blue shaded area indicates the duration (10 s) of light delivery. Right, Movement tracks corresponding to the pre-period (top) and light-period (bottom). Six representative mice (10 trials from each) are presented. d, Left, Slopegraph showing the response of each mouse on optogenetic stimulation of PV+ neurons in chronic 6-OHDA-lesioned mice. The slope of each line shows the magnitude and direction of change. Median difference is plotted on a floating axis. The smoothed density represents bootstrap resampled data. The median difference is indicated as a circle, and the 95% confidence interval is indicated by the length of vertical lines. Top, right, A plot showing the relationship between normalized speed and time. Blue bar indicates the duration (10 s) of light delivery. The dotted horizontal line indicates the normalized baseline motor activity level. Black solid trace is the average distance from all mice; the shaded area shows the SEM. Black dotted trace is a representative example from a single mouse; data were scaled to facilitate comparison. Bottom, right, Speed during light-period against speed during pre-period. Data from chronic 6-OHDA-lesioned PV-Cre mice expressing ChR2-eYFP are displayed. Each marker represents a mouse. The diagonal line indicates unity (i.e., x = y). 6-OHDA data points are systematically shifted upward relative to unity. Locomotor activity was higher with light delivery. Naïve data (black) from Figure 1b are replotted for comparison. e, Left, Scatter plots showing the pairwise relationship between speed during light-period and speed during pre-period in naïve (top) and chronic 6-OHDA-lesioned PV-Cre mice are shown (bottom). To facilitate comparison, data from naïve mice are replotted (top). The diagonal line indicates unity. Middle, Fold change in speed with light delivery against speed during pre-period from PV-Cre mice expressing ChR2-eYFP. Each marker represents a trial. Inset, Same data displayed with fold increase on y-axis on a log scale. Right, Logistic regression curves fitted to data for 0.1-fold, 1-fold, and 10-fold increases are displayed.
Figure 9.
Figure 9.
No persistent motor effects are induced by in vivo optogenetic stimulation in chronic 6-OHDA-lesioned mice. a, Slopegraph showing the size and reversibility of motor responses induced by optogenetic stimulation of PV+ neurons in naïve (gray dotted lines) and chronic 6-OHDA-lesioned mice (red dotted lines). Ten trials (circles) were run on each mouse. Trial numbers are denoted by colors (rainbow). Data from sustained (naïve: n = 12; 6-OHDA: n = 14) and patterned (naïve: n = 12; 6-OHDA: n = 14) stimulation are combined. The slope of each line shows the magnitude and direction of change. b, A plot showing the motor activity of a subset of chronic 6-OHDA-lesioned mice (n = 4) across time. Blue bar indicates the duration of light delivery; 10 stimuli were delivered. Black solid trace is the average distance from all mice; the shaded area shows the SEM. Black dotted trace is a representative example from a single mouse; data were scaled to facilitate comparison.

Similar articles

Cited by

References

    1. Abdi A, Mallet N, Mohamed FY, Sharott A, Dodson PD, Nakamura KC, Suri S, Avery SV, Larvin JT, Garas FN, Garas SN, Vinciati F, Morin S, Bezard E, Baufreton J, Magill PJ (2015) Prototypic and arkypallidal neurons in the dopamine-intact external globus pallidus. J Neurosci 35:6667–6688. 10.1523/JNEUROSCI.4662-14.2015 - DOI - PMC - PubMed
    1. Abecassis ZA, Berceau BL, Win PH, García D, Xenias HS, Cui Q, Pamukcu A, Cherian S, Hernández VM, Chon U, Lim BK, Kim Y, Justice NJ, Awatramani R, Hooks BM, Gerfen CR, Boca SM, Chan CS (2020) Npas1(+)-Nkx2.1(+) neurons are an integral part of the cortico-pallido-cortical loop. J Neurosci 40:743–768. 10.1523/JNEUROSCI.1199-19.2019 - DOI - PMC - PubMed
    1. Adam EM, Johns T, Sur M (2020) Cortico-subthalamic projections send brief stop signals to halt visually-guided locomotion. bioRxiv. doi: 10.1101/2020.02.05.936443. - DOI
    1. Albin RL, Young AB, Penney JB (1989) The functional anatomy of basal ganglia disorders. Trends Neurosci 12:366–375. 10.1016/0166-2236(89)90074-x - DOI - PubMed
    1. Albin RL, Young AB, Penney JB (1995) The functional anatomy of disorders of the basal ganglia. Trends Neurosci 18:63–64. - PubMed

Publication types

Substances

LinkOut - more resources