. 2020 Aug 31;11(1):4358.
doi: 10.1038/s41467-020-18199-w.

Experience-dependent resonance in amygdalo-cortical circuits supports fear memory retrieval following extinction

Affiliations

Experience-dependent resonance in amygdalo-cortical circuits supports fear memory retrieval following extinction

Minagi Ozawa et al. Nat Commun. .

Abstract

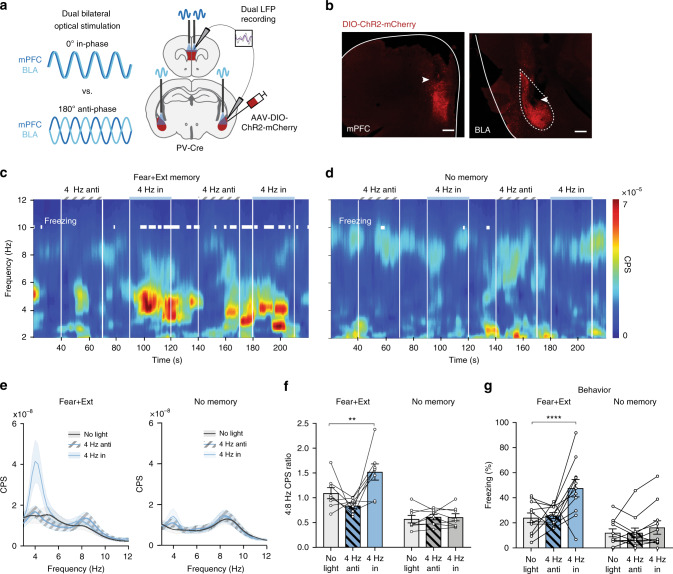
Learned fear and safety are associated with distinct oscillatory states in the basolateral amygdala (BLA) and medial prefrontal cortex (mPFC). To determine if and how these network states support the retrieval of competing memories, we mimicked endogenous oscillatory activity through optogenetic stimulation of parvalbumin-expressing interneurons in mice during retrieval of contextual fear and extinction memories. We found that exogenously induced 4 Hz and 8 Hz oscillatory activity in the BLA exerts bi-directional control over conditioned freezing behavior in an experience- and context-specific manner, and that these oscillations have an experience-dependent ability to recruit distinct functional neuronal ensembles. At the network level we demonstrate, via simultaneous manipulation of BLA and mPFC, that experience-dependent 4 Hz resonance across BLA-mPFC circuitry supports post-extinction fear memory retrieval. Our findings reveal that post-extinction fear memory retrieval is supported by local and interregional experience-dependent resonance, and suggest novel approaches for interrogation and therapeutic manipulation of acquired fear circuitry.


Conflict of interest statement

The authors declare no competing interests.

Figures

Fig. 1
Fig. 1. 4 Hz and 8 Hz oscillations differentially modulate local BLA spiking activity.
a Experimental schematic. Thirty two channel tetrode drives were implanted into the BLA to extract both LFP and spiking activity in mice while subjected to fear conditioning and extinction. b Example histology image showing tetrode placement after electrolytic lesion. c Averaged BLA power spectra during freezing and non-freezing periods used for phase-locking analysis. Inset: quantification as 4:8 Hz power ratio (paired two-tailed t-test: P = 0.0007, t(6) = 6.31, n = 7 mice). d Example BLA single units that significantly phase-locked (PL) to BLA LFP at 4 Hz during freezing or 8 Hz during non-freezing (significance based on permutation test P < 0.05; see Methods section). e Comparison of proportion of BLA single units that significantly phase-lock (based on permutation test P < 0.05; see Methods section) to 4 Hz only, 8 Hz only, both, or neither during freezing vs. non-freezing behavior (Chi-square test: X2(3, n = 106 units) = 30.12, P < 0.0001). f Averaged PPC spectra of units that phase-lock to 4 Hz during freezing (n = 25 cells) or 8 Hz during non-freezing (n = 22 cells). g Percentage of BLA single units that exclusively phase-lock to 8 Hz during non-freezing, a distinct subset that exclusively phase-lock to 4 Hz during freezing, and a third group that switches between the two (percentage of all significantly phase-locked units, n = 63 units). All error bars and shaded area: mean ± SEM.
Fig. 2
Fig. 2. Frequency-based, bidirectional control of post-extinction memory retrieval.
a Schematic of viral strategy for in vivo optogenetic control of BLA PV-interneurons. b, c Example traces from acute BLA slices demonstrating effect of sinusoidal optical stimulation on action potential generation in PV-interneurons (also see Supplementary Fig. 2). d Schematic of experimental design for standard extinction group (see Supplementary Fig. 3a for experimental design for delayed extinction group; see Methods section for details). e Optical stimulation of BLA PV-interneurons has a bidirectional effect on memory retrieval in the conditioned context following, but not before, extinction learning (two-way repeated measures ANOVA: trial F(2,50) = 134.4, P < 0.0001, stimulation F(2,50) = 18.49, P < 0.0001, trial × stimulation F(4, 100) = 10.15, P < 0.0001, n = 26 mice; Holm–Sidak’s multiple comparisons test; fear memory: no light vs. 8 Hz stim t(100) = 0.94, P = 0.57; no light vs 4 Hz stim t(100) = 0.09, P = 0.93; fear + ext memory: no light vs 8 Hz stim t(100) = 3.27, P = 0.0015; no light vs 4 Hz stim t(100) = 4.8, P < 0.0001; no memory: no light vs 8 Hz stim t(100) = 0.21, P = 0.97; no light vs 4 Hz stim t(100) = 0.018, P = 0.99). Error bars: mean ± SEM.
Fig. 3
Fig. 3. 4 Hz and 8 Hz stimulation recruit functionally distinct neuronal ensembles.
a Experimental schematic. PV-cre mice were injected with AAV-DIO-ChR2-mCherry and implanted with optic cannulae and 32 channel tetrode drives in the BLA to extract both LFP and spiking activity in mice subjected to fear conditioning and extinction. b Raster plot (top) and spike histogram (bottom) of an example light-activated BLA single-unit, aligned to onset of 15 ms light pulses (left) or to the phases of the 4 Hz and 8 Hz sinusoidal light waveform (right). c Same as b but for a light-suppressed BLA single-unit. d Spike histograms of an example neuron that significantly phase-locks to 4 Hz stimulus waveform (top) and another unit that does not (bottom). e Percentage of units that significantly phase-lock (PL) to 4 Hz stimulus waveform during extinction memory retrieval (significance based on permutation test P < 0.05, n = 23/66 units). f Units that significantly phase-lock to 4 Hz stimulation show a higher 4:8 Hz PPC ratio during freezing than units that do not phase-lock to 4 Hz stimulation. (Mann–Whitney test, two-tailed: U = 308, P = 0.039, n = 22 and 41 units). g Same as in f but during non-freeze periods. Units that significantly phase-lock to 4 Hz stimulation and those that do not, show no difference in 4:8 Hz PPC ratio during non-freezing (Mann–Whitney test, two-tailed: U = 326, P = 0.25, n = 21 and 38 units). h Units that are recruited to endogenous freezing-associated 4 Hz oscillations are more likely to phase-lock to the 4-Hz stimulus waveform (Chi-square test: X2 = 10.09, P = 0.0015). i Same as d but for 8 Hz stimulation. j Same as e but for 8 Hz stimulation (significance based on permutation test P < 0.05, n = 20/66 units). k, l Same as (f-g) but for 8 Hz stimulation. Units that were significantly phase-locked to 8 Hz stimulus waveform had lower 4:8 Hz PPC ratios during non-freezing periods. (Mann–Whitney test, two-tailed: Freeze (k): U = 413, P = 0.84, n = 19 and 45 units; Non-freeze (l): U = 256, P = 0.026, n = 19 and 42 units). m Comparison of percentage of units that are recruited to endogenous non-freezing-associated 8 Hz oscillations among units that significantly phase-lock to 8 Hz stimulation vs. those that do not (Chi-square test: X2 = 1.10, P = 0.29). All error bars: mean ± SEM.
Fig. 4
Fig. 4. 4 Hz and 8 Hz stimulation differentially synchronizes BLA neurons experience-dependently.
a Firing rate of BLA MUA is not significantly different during 4 Hz and 8 Hz sinusoidal stimulation in the conditioned context (firing rate normalized to no light; paired two-tailed Wilcoxon test: P = 0.22, n = 50 MUA). b Same as in a but in unconditioned context (paired two-tailed Wilcoxon test: P = 0.33, n = 50 MUA). c Averaged PPC spectra (left) of BLA MUA during 4 Hz and 8 Hz optical stimulation in the conditioned context (Fear + Ext memory state). MUA phase-locking quantified as 4:8 Hz PPC ratio (right) is significantly shifted by 4 Hz vs. 8 Hz stimulation in the memory-context (paired two-tailed Wilcoxon test: P = 0.0005, n = 50 MUA). d Same as in c but in the unconditioned context (no memory state). MUA phase-locking is not significantly shifted by 4 Hz vs. 8 Hz stimulation in the unconditioned context (paired two-tailed Wilcoxon test: P = 0.17, n = 50 MUA). e Venn diagram showing the distribution of units significantly phase-locked to 4 Hz stimulus waveform in the conditioned (Fear + Ext) context (left), unconditioned neutral context (right), or both (middle overlap). f Proportion of units recruited to freezing-associated 4 Hz oscillations in the conditioned context is enriched among units that significantly phase-lock to 4 Hz stimulation in the conditioned context (Chi-square test: X2 = 8.24, P = 0.0041, n = 17 units). g Same as e but for 8 Hz stimulation. h Proportion of units recruited to non-freezing-associated 8 Hz oscillations in the conditioned context among units that significantly phase-lock to 8 Hz stimulation in the conditioned versus unconditioned context (Chi-square test: X2 = 1.94, P = 0.16, n = 14 units: one of the six Fear+Ext-only units in panel g did not meet the minimum number of spike criterium for PPC analysis during the non-freezing behavioral state). All error bars and shaded area: mean ± SEM.
Fig. 5
Fig. 5. Memory-specific effects of 4 Hz and 8 Hz BLA stimulation on BLA-mPFC oscillatory activity.
a Schematic of strategy for in vivo control of BLA PV-interneurons with simultaneous dual LFP recording. b, c Fear conditioning increases, while extinction learning reduces 4:8 Hz cross-power spectrum. Averaged cross-power spectra (b; n = 24 mice) and quantification as 4:8 Hz CPS ratio (c; one-way repeated measures ANOVA: F(1.201, 27.62) = 27.5, P < 0.0001, n = 24 mice. Tukey’s multiple comparison’s test: No memory vs. Fear memory: P < 0.0001; No memory vs. fear+ext memory: P < 0.0001; fear vs. fear+ext memory: P = 0.0047). df Representative cross-power spectrograms demonstrating bidirectional control of freezing and BLA-mPFC cross-power spectrum by 4 Hz and 8 Hz optical stimulation, exclusively during post-extinction retrieval (Fear + Extinction Memory). g, h Average BLA-mPFC cross-power spectra illustrating frequency-specific effects of 4 Hz and 8 Hz optical stimulation during the post-extinction retrieval trial (n = 16 mice). A stimulation-induced 4 Hz peak emerges only in the Fear+Extinction memory condition, and not in the No-memory condition. i Optical stimulation of BLA PV-interneurons has a bidirectional effect on BLA-mPFC cross-power spectrum in the conditioned context following, but not before, extinction learning (two-way repeated measures ANOVA: trial F(2,30) = 15.91, P < 0.0001, stimulation F(2,30) = 18.58, P < 0.0001, trial × stimulation F(4, 60) = 7.96, P < 0.0001, n = 16 mice; Holm-Sidak’s multiple comparisons test; fear memory: no light vs. 8 Hz stim t(60) = 3.29, P = 0.0034; no light vs 4 Hz stim t(60) = 0.60, P = 0.55; fear+ext memory: no light vs 8 Hz stim t(60) = 3.43, P = 0.0011; no light vs 4 Hz stim t(60) = 5.16, P < 0.0001; no memory: no light vs 8 Hz stim t(60) = 0.18, P = 0.86; no light vs 4 Hz stim t(60) = 1.43, P = 0.29). All error bars and shaded area: mean ± SEM.
Fig. 6
Fig. 6. Balance between BLA-mPFC 4 Hz and 8 Hz activity predicts stability of post-extinction freezing.
a Extinction learning reduces the duration, but not frequency, of freezing bouts. Pooled frequency histogram of all freezing bouts across all animals showed a left-shift in distribution, indicating shorter duration but not lower frequency of freezing bouts after extinction (left: n = 36 mice; 0.4 s bins). Comparison of pre- and post-extinction learning shows that while average bout frequency remains unchanged (middle; paired two-tailed t-test: P = 0.19, t(34) = 1.34, n = 35 mice), average bout duration is significantly reduced after extinction (right; paired two-tailed t-test: P < 0.0001, t(34) = 6.34, n = 35 mice). b Correlation between change in 4:8 Hz cross-power ratio with change in average bout duration (post-minus pre-extinction learning; non-parametric Spearman correlation: two-tailed P = 0.058; r = 0.39; n = 24 mice). c Example cross-power spectrogram from individual mouse showing freeze bouts of various lengths. d, e Average cross-power spectrograms (d) and spectra (e) comparing short (2–3.5 s bouts; n = 18 mice) vs. long (>3.5 s; n = 15 mice) freeze bouts during post-extinction retrieval trials. (e inset is quantification as 4:8 Hz cross-power ratio. Unpaired t-test (two-tailed): t(31) = 1.75; P = 0.09; box plot shows median (line inside box), 25% and 75% percentiles (box edges), and minimum and maximum values (error bars). f Correlation between the duration and the cross-power ratio of all freezing bouts (>2 s during no stimulation periods in the post-extinction retrieval trial; non-parametric Spearman correlation: two-tailed P = 0.0002; r = 0.33; 118 bouts from n = 23 mice). Bouts from single example mouse highlighted in blue (linear regression F(1,5) = 99.21, P = 0.0002, R2 = 0.95, n = 7 bouts). g Histogram of freezing bouts by duration during 4 Hz vs. 8 Hz stimulation in the conditioned context post-extinction learning (bouts cumulated from n = 25 mice). 4 Hz stimulation leads to an increase in both frequency (middle) and average duration (right) of freezing bouts compared to 8 Hz stimulation (paired two-tailed t-test: frequency: P = 0.0002, t(24) = 4.43; duration: P = 0.016, t(24) = 2.59; n = 25 mice). All error bars and shaded area: mean ± SEM.
Fig. 7
Fig. 7. Anti-phase BLA-mPFC stimulation prevents effects of BLA-only stimulation on memory retrieval.
a Schematic of optogenetic strategy to increase frequency-specific functional interactions between the BLA and mPFC. b Example images showing ChR2-mCherry expression, with optical fiber and electrode placement in mPFC and BLA. Targeting was similarly confirmed by histological analysis in all 11 mice; see Methods section for detail. Scale bar: 300 µm. c, d Representative cross-power spectrograms illustrating differential effects of 4 Hz in- and anti-phase optical stimulation in the conditioned context (c; fear+ext memory state) and unconditioned novel context (d; no-memory state). e Averaged cross-power spectra comparing effects of in-phase and anti-phase 4 Hz stimulation to no-stimulation baseline during fear+extinction memory and no-memory states (n = 8 mice). f Quantification of the cross-power spectra from e. 4 Hz in-phase stimulation increases the 4:8 Hz cross-power ratio compared to the no-stimulation baseline, whereas 4 Hz anti-phase stimulation does not. This effect is absent in a context where the mouse has no fear memory (two-way RM ANOVA: trial F(1,7) = 34.12, P = 0.0006, stimulation F(2,14) = 7.80, P = 0.0053, trial × stimulation F(2,14) = 7.46, P = 0.0062, n = 8 mice. Holm-Sidak’s multiple comparisons test; fear+ext memory state: no light vs. 4 Hz anti-phase: t(14) = 2.01, P = 0.064; no light vs. 4 Hz in-phase t(14) = 3.39, P = 0.0087. No memory state: no light vs. 4 Hz anti-phase: t(14) = 0.33, P = 0.94; no light vs. 4 Hz in-phase t(14) = 0.29, P = 0.94). g 4 Hz in-phase stimulation increases the conditioned freezing response compared to the no-stimulation baseline, whereas 4 Hz anti-phase stimulation does not. This effect is absent in a context where the mouse has no fear memory (two-way repeated measures ANOVA: trial F(1,10) = 15.43, P = 0.0028, stimulation F(2,20) = 10.18, P = 0.0009, trial × stimulation F(2,20) = 5.28, P = 0.014, n = 11 mice. Holm-Sidak’s multiple comparisons test; fear+ext memory state: no light vs. 4 Hz anti-phase: t(20) = 0.55, P = 0.59; no light vs. 4 Hz in-phase t(20) = 5.20, P < 0.0001. No memory state: no light vs. 4 Hz anti-phase: t(20) = 0.0088, P = 0.99; no light vs. 4 Hz in-phase t(20) = 0.97, P = 0.71). All error bars and shaded area: mean ± SEM.

References

    1. Buzsaki, G. Rhythms Of The Brain (Oxford University Press, 2006).
    1. Buzsaki G. Neural syntax: cell assemblies, synapsembles, and readers. Neuron. 2010;68:362–385. - PMC - PubMed
    1. Schnitzler A, Gross J. Normal and pathological oscillatory communication in the brain. Nat. Rev. Neurosci. 2005;6:285–296. - PubMed
    1. Burgess N, O’Keefe J. Models of place and grid cell firing and theta rhythmicity. Curr. Opin. Neurobiol. 2011;21:734–744. - PMC - PubMed
    1. Hutcheon B, Yarom Y. Resonance, oscillation and the intrinsic frequency preferences of neurons. Trends Neurosci. 2000;23:216–222. - PubMed

Publication types