. 2021 Jan;5(1):83-98.
doi: 10.1038/s41562-020-0929-3. Epub 2020 Aug 31.

Polarity of uncertainty representation during exploration and exploitation in ventromedial prefrontal cortex

Affiliations

Polarity of uncertainty representation during exploration and exploitation in ventromedial prefrontal cortex

Nadescha Trudel et al. Nat Hum Behav. 2021 Jan.

Abstract

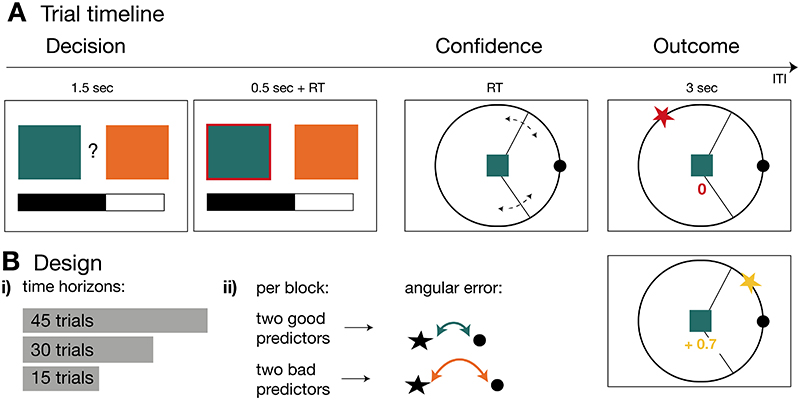
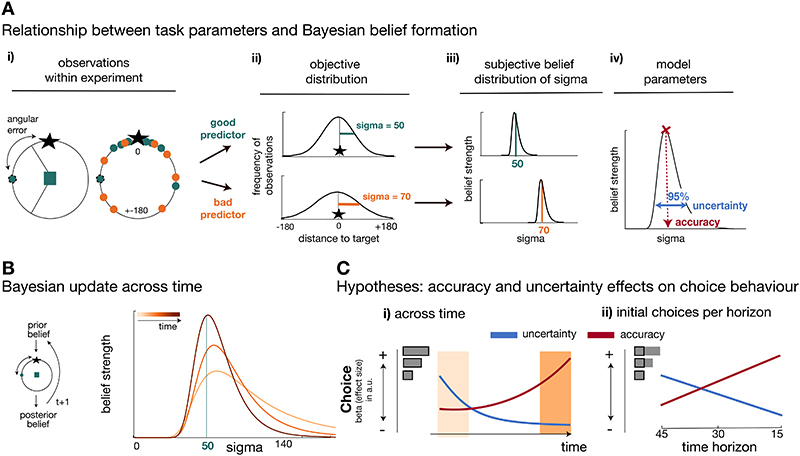
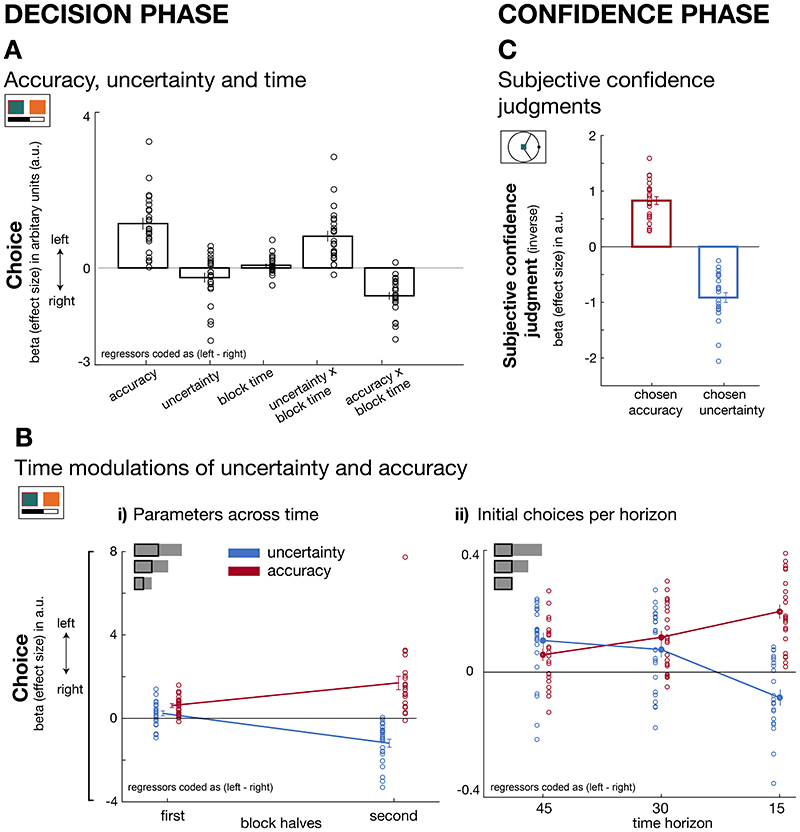
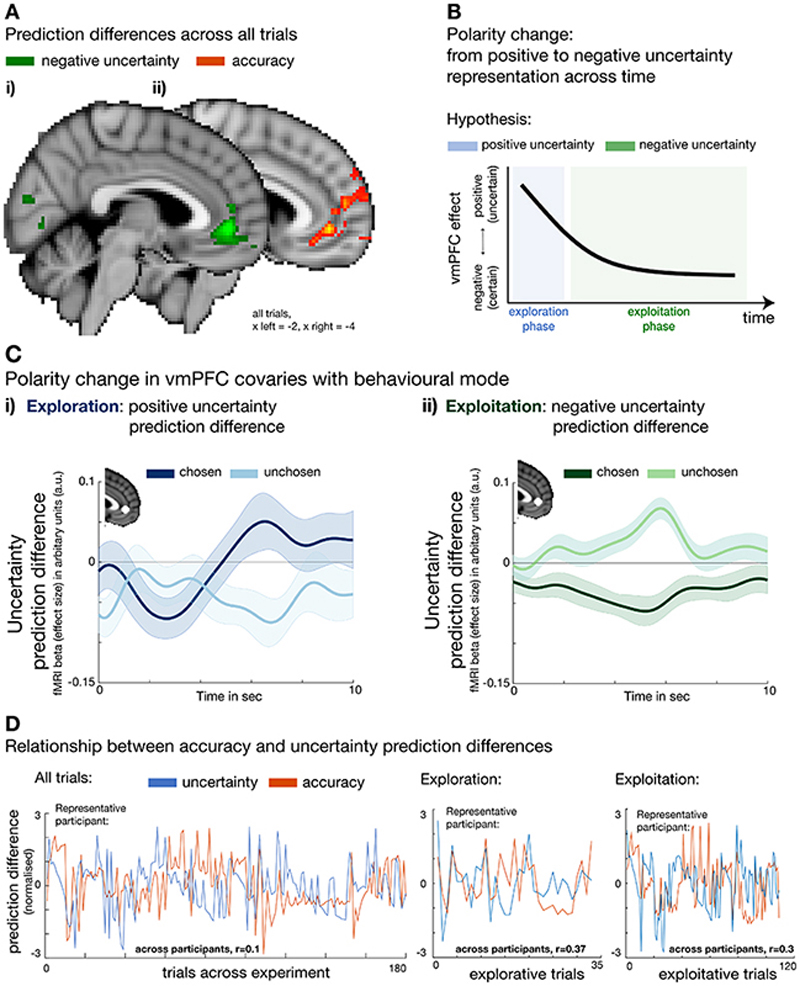
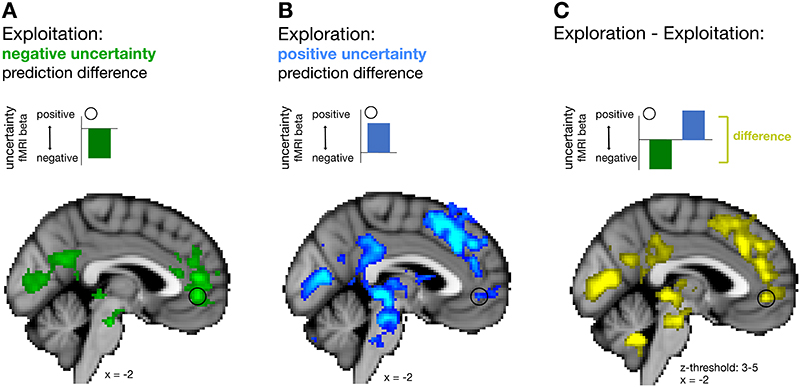
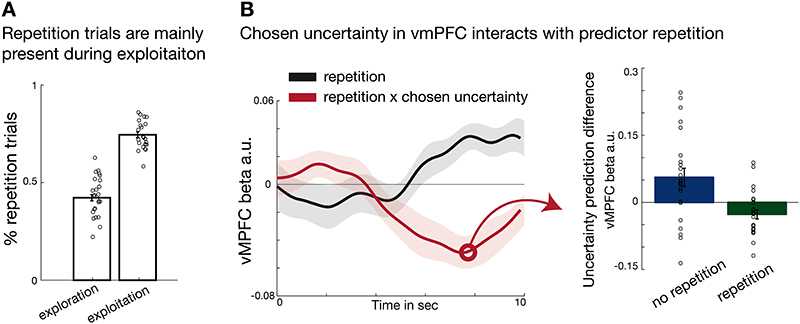
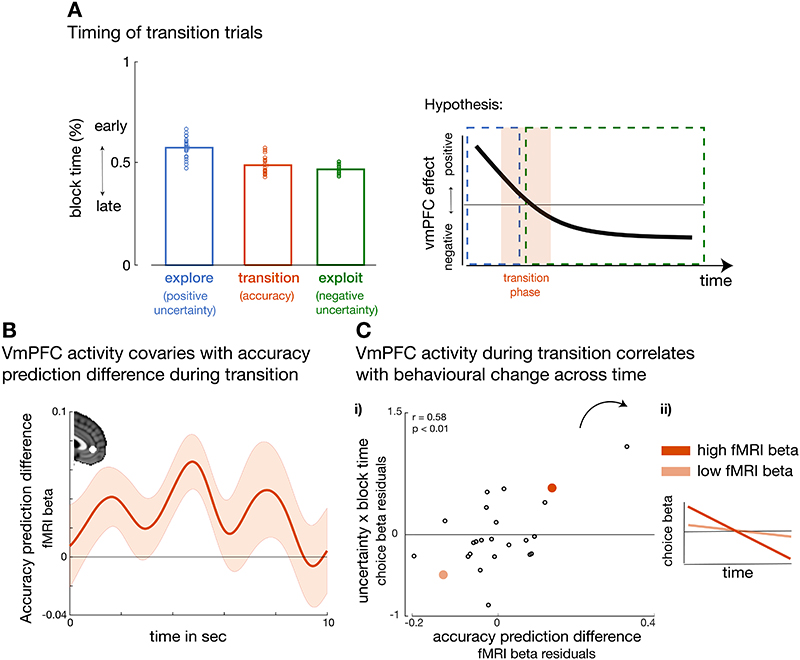
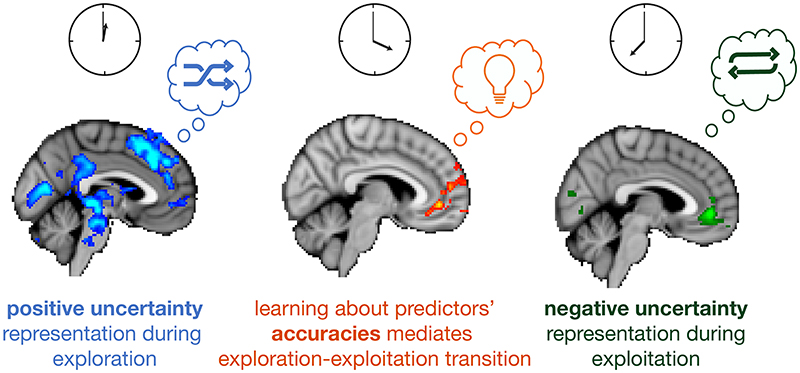
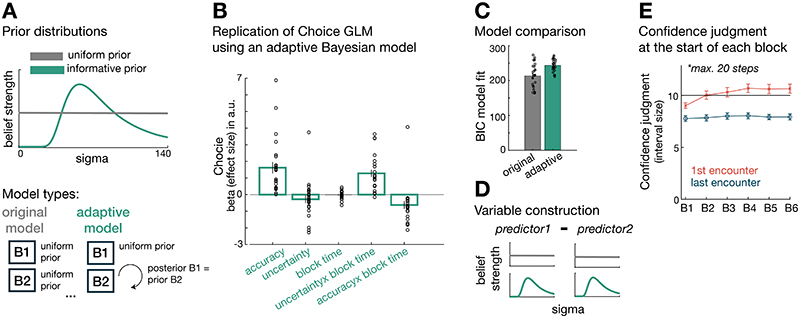
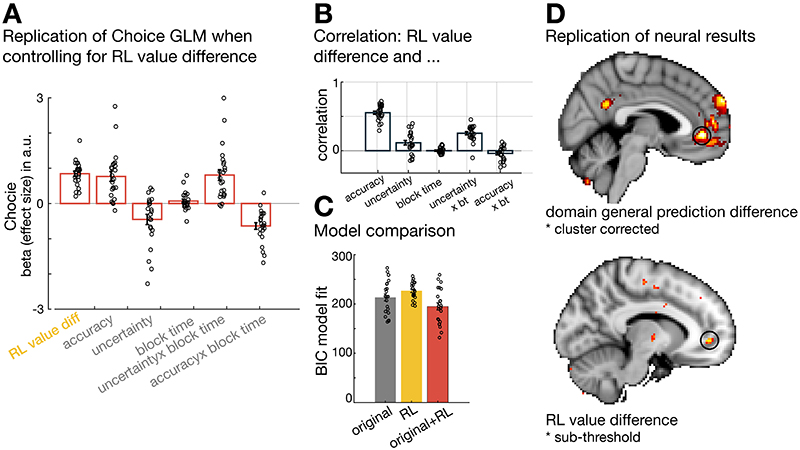
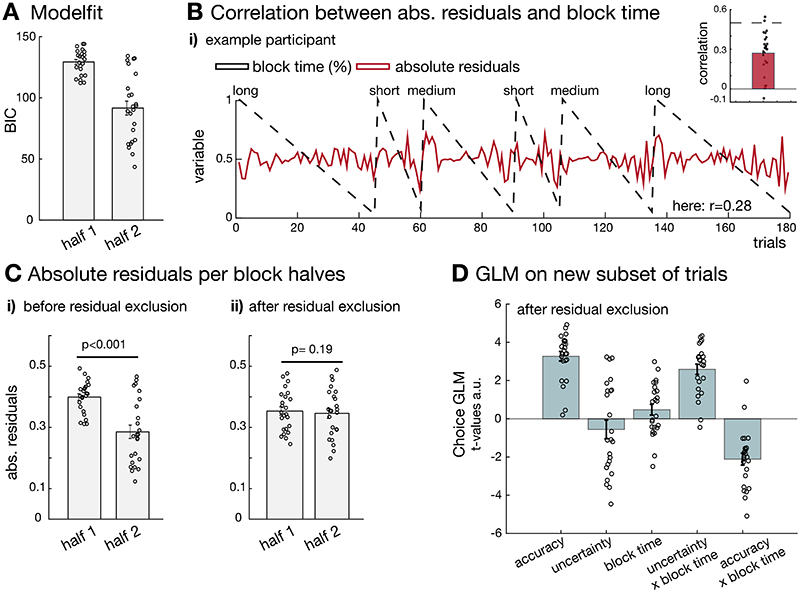
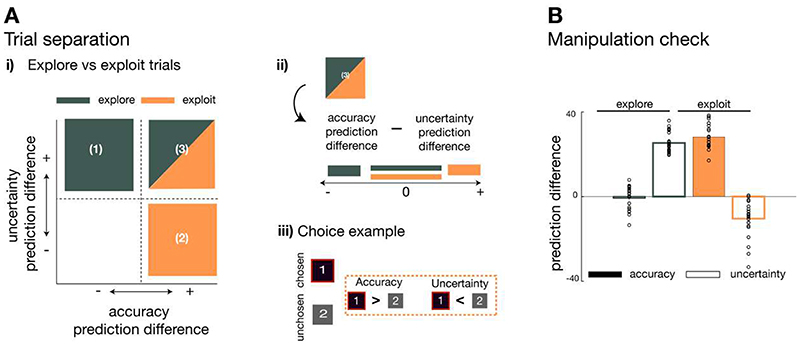
Environments furnish multiple information sources for making predictions about future events. Here we use behavioural modelling and functional magnetic resonance imaging to describe how humans select predictors that might be most relevant. First, during early encounters with potential predictors, participants' selections were explorative and directed towards subjectively uncertain predictors (positive uncertainty effect). This was particularly the case when many future opportunities remained to exploit knowledge gained. Then, preferences for accurate predictors increased over time, while uncertain predictors were avoided (negative uncertainty effect). The behavioural transition from positive to negative uncertainty-driven selections was accompanied by changes in the representations of belief uncertainty in ventromedial prefrontal cortex (vmPFC). The polarity of uncertainty representations (positive or negative encoding of uncertainty) changed between exploration and exploitation periods. Moreover, the two periods were separated by a third transitional period in which beliefs about predictors' accuracy predominated. The vmPFC signals a multiplicity of decision variables, the strength and polarity of which vary with behavioural context.


Conflict of interest statement

Competing interest

The authors declare no financial or non-financial competing interests.

Figures

Figure 1
Figure 1. Experimental Task and Design.
(A) Trial timeline. In each trial, participants made two choices. First, a binary choice between two predictors (coloured boxes; decision phase) to receive information about a target’s location on a circle. The goal was to choose predictors that accurately predicted the target location. The length of a black bar at the bottom of the screen informed participants about the number of remaining trials in the current block. Second, participants indicated their belief in the accuracy of the chosen predictor by modifying the size (dotted lines) of an interval symmetrical around the reference point (confidence phase). In the outcome phase, the target location (star) and any points earned were indicated. Two possible example outcomes are illustrated. In the above case, the participant’s prediction was incorrect as the target fell outside the interval, resulting in a null payoff. In the bottom case, the target fell within the interval, resulting in a positive payoff. Positive payoffs increase with narrower intervals as long as the target falls within the interval. (B) Design. (B-i) Participants transitioned through blocks of different numbers of trials (time horizons). (B-ii) Each time horizon introduced four new predictors (illustrated as boxes) that were categorised into two good (green and yellow boxes) and two bad predictors (orange and blue boxes) according to how well they predicted the target. The quality of predictions was determined by the angular error between target and reference location with a smaller angular error representing better target predictions.
Figure 2
Figure 2. Task statistics, Bayesian model, and choice hypotheses.
(A) Panels depict the mapping between observations during the task (i), their statistical properties (ii), and subjective beliefs about these properties derived with Bayes’ rule (iii;iv). (A-i) A predictor’s performance can be evaluated by the angular error at each trial (left panel), and by comparing angular errors between predictors across observations (right panel). Better predictors have on average smaller angular errors (green is better than orange). (A-ii) Predictors’ angular errors were derived from normal distributions centred on the true target location. Critically, the normal distributions for good and bad predictors differed in their standard deviation (sigma): smaller sigma’s reflected smaller angular errors, i.e. more accurate predictions of the true target location. Learning about a predictor’s angular error across time corresponded to forming beliefs about a predictor’s sigma value. (A-iii) To capture this learning process, we used Bayesian modelling and derived trial-wise belief distributions over sigma for each predictor. In other words, we estimated a probability density function that expressed the belief strength in each possible sigma over a large range of sigmas, and that was updated with each new observation via Bayes’ rule. The coloured vertical lines indicate the true underlying sigmas of the predictors and the black distributions reflect the Bayesian approximation after extensive training. (A-iv) We captured two separable estimates about participants’ beliefs concerning predictors: an estimate of the accuracy of a predictor (the mode of the distribution indicated by the position of the vertical line on the abscissa) and the uncertainty in that belief (width of the belief distribution). (B) In all panels, light to dark orange represents earlier and later trials, respectively, in a block. Left: Prior beliefs are updated after observing the angular error in the trial’s outcome phase, resulting in a posterior belief. The posterior belief forms the prior for the next encounter with the same predictor. Right: Belief distribution when selecting the same predictor multiple times. Across time, the belief distribution will converge towards the true value of sigma (here, true sigma is 50). (C) Experimental hypotheses. Note that panels depict an illustration of hypothesized effect sizes of accuracy and uncertainty on choice akin to logistic GLM analyses of choice. (C-i) Participants’ patterns of explore/exploit choices should systematically change over the course of the blocks. At the beginning of a block (light orange area), participants should pursue the more uncertain predictor, that is choices should be driven by a positive uncertainty effect, but this tendency should reverse over time. Accurate predictors should be sought out throughout (positive accuracy effect), but particularly towards the end of the block (dark orange area) when the value of exploration diminishes. (C-ii) At the time of initial choices (indicated by black boxes in inset), the value of exploration should be modulated by the time horizon and choices towards uncertain predictors should systematically increase if there are more trials remaining in which to exploit the knowledge gained, i.e. in longer horizons (vice versa for accuracy-driven choices).
Figure 3
Figure 3. Dissociable effects of accuracy and uncertainty on predictor selections and subjective confidence judgments.
(A) Decision phase. By using logistic GLM analyses we predict leftward predictor selection as a function of several variables (coded as left minus right). In general, participants preferred accurate predictors (accuracy: t(23)=7.5, p<0.001, d=1.52,95% confidence interval=[0.8 1.45]). There was no credible evidence for an uncertainty effect on behaviour (t(23)=-1.9, p= 0.07, d=-0.39,95% confidence interval=[-0.51 0.018], Bayes factor10=1.05, %error=1.1017e-4). However, uncertainty and accuracy exerted different effects depending on when choices were made: uncertain predictors were explored when many trials remained (positive interaction term with percentage of remaining trials, i.e. block time; t(23)=5.8, p<0.001, d=1.18,95% confidence interval=[0.53 1.1]), whereas decisions were accuracy-driven as the end of a block approached (negative interaction effect with block time; t(23)=7.5, p<0.001, d=-1.53,95% confidence interval=[-0.91 -0.52]). (B) Decision phase. (B-i) Trials were binned into first and second halves of each block (independent of time horizon length) to examine the interaction effects shown in panel A. Earlier choices (i.e. first half) were more uncertainty-driven compared to later (i.e. second half) choices when uncertainty was avoided (paired-test early vs late: t(23) = -8.1, p<0.001, d=1.66, 95%confidence interval=[1.06 1.8]). In contrast, accuracy determined choices throughout both early and late block halves, but increasingly so in the second half (paired t-test early vs late: t(23) =-4.2, p<0.001, d=-0.85,95%confidence interval=[-1.63 -0.55]). Both accuracy and uncertainty changed differently across block halves (paired t-test between differences of block halves for accuracy and uncertainty: t(23) = -8.1, p<0.001, d=-1.7, 95% confidence interval =[-2.27 -1.02]). (B-ii) Accuracy and uncertainty effects on choice also varied as a function of how many trials still remained within a block: differences in the initial choice patterns (first 15 trials; see inset) across horizons showed that the exploration of uncertain predictors was more pronounced when horizons were longer while shorter horizons demanded more rapid exploitation of predictors estimated as most accurate (3x2 ANOVA: F(2,46)=36.7, p<0.001, η2=0.62). (C) Confidence phase. Trial-by-trial confidence judgments increased (i.e. the confidence interval size decreased) when selecting predictors that were believed to be accurate (t(23)=11.7, p<0.001, d=2.4, 95%confidence interval=[0.66 0.98]) but decreased when predictors were believed to be uncertain according to the Bayesian model (t(23)=-10.4, p<0.001, d=-2.12,95% confidence interval=[-1.1 -0.73]. Note that we used the inverse of the confidence interval such that a greater confidence index also represents higher confidence. (n = 24; error bars are SEM across participants).
Figure 4
Figure 4. Modulation of uncertainty prediction difference in vmPFC according to behavioural mode.
(A) Across all trials, a negative uncertainty (i) and positive accuracy (ii) prediction differences covaried with activation in vmPFC. (B) We found a polarity change in the impact uncertainty exerted on predictor selection at a behavioural level; initial trials in longer horizons were more likely to be explorative and directed towards more uncertain predictors while behaviour in later trials was more exploitative and directed away from uncertain predictors, in other words they selected certain predictors (see labels on y-axis). We tested for a neural uncertainty polarity change in vmPFC comparing behavioural modes of exploration and exploitation, respectively, representing a positive and then negative uncertainty prediction difference. (C) Time courses extracted from vmPFC for both chosen and unchosen components of an uncertainty prediction difference signal during exploration (i) and exploitation (ii). VmPFC BOLD activity changed in accordance with the behavioural results; it transitioned from activity positively related to uncertainty prediction difference (positively encoding the uncertainty of the chosen predictor as opposed to the unchosen predictor) during initial choices to activity negatively related to uncertainty prediction difference (negatively encoding the uncertainty of the chosen predictor as opposed to the unchosen predictor) in later trials. All effects were time-locked to the decision phase. (n = 24; error bars are SEM across participants; whole-brain effects family-wise error cluster corrected with z > 2.3 and p < 0.05). (D) The relationship between accuracy and uncertainty prediction differences used for all neural analyses across all trials (left) exploration trials (centre), and exploitation trials (right). Average correlations between accuracy and uncertainty prediction differences across all participants are reported at the bottom of each panel, while panels show variables across time taken from a representative participant for each analysis. Accuracy and uncertainty prediction differences are similarly decorrelated in all other analyses (for details on correlation, see Supplementary Figure 1, 2).
Figure 5
Figure 5. Whole brain maps for uncertainty prediction difference during exploration and exploitation.
Illustrations above whole-brain images clarify the polarity (positive or negative) of the uncertainty prediction difference signal represented in vmPFC (indicated by the black circle) during exploitation, exploration and their contrast. (A) During exploitation, activity related to an uncertainty prediction difference was restricted to a region centred on vmPFC and was represented with a negative polarity (see inset). (B) However, during exploration uncertainty prediction difference was represented with a positive polarity and associated with an extended network including vmPFC but also dorsomedial frontal areas peaking in dorsal anterior cingulate cortex (dACC) (see also Supplementary Figure 6). (C) Difference in uncertainty prediction difference between exploration and exploitation. Contrasting activations between the behavioural modes of exploration and exploitation confirmed the presence of mode-specific (e.g. dACC) and mode-general (e.g. vmPFC) activations. Note that the sign of activation patterns resulting from a contrast between exploration and exploitation need to be interpreted with reference to the levels of activity found in the exploration and exploitation phases with respect to baseline (see illustration above each whole-brain map) (n = 24; whole-brain effects family-wise error cluster corrected with z > 2.3 and p < 0.05).
Figure 6
Figure 6. Interaction of repetition and uncertainty representation in vmPFC.
(A) The percentage of choice repetitions during exploitation was significantly higher than during exploration (paired t-test explore vs exploit: t(23)=-16.2, p <0.001, d= -3.3,95% confidence interval = [-0.36 -0.28]). Also note that within the two phases, this indicates a relative predominance of repetitions versus no repetitions in exploitation, but a relative predominance of no repetition choices versus repetitions in exploration. (B) VmPFC activity increased when participants repeated the same predictor selection as they had made on the last encounter with the predictor (grey time course; repetition is coded as “repeat – no repeat”; t(23) = 4, p <0.001, d= 0.8,95% confidence interval=[0.017 0.06]). Moreover, we found a significant interaction effect of repetition × chosen uncertainty (red time course; t(23) = -3.4, p =0.002, d= -0.7,95% confidence interval=[-0.07 -0.02]). The interaction effect is illustrated in the right panel by decomposing it into the binned effects of chosen uncertainty during “repetition” and “no repetition” trials at the time of the interaction effect time course peak. This indicates that the increase in BOLD response accompanying choice repetition was even stronger if participants were very certain about their choice (i.e. negative uncertainty during repetition; green bar in right panel); whereas in case of switching choices, the BOLD signal increased as a function of chosen uncertainty (i.e. positive uncertainty; blue bar in right panel). Note that the statistical test comparing the blue and green bars was performed in the leftward panel of B by testing the interaction effect against zero (n = 24; error bars are SEM across participants).
Figure 7
Figure 7. Accuracy processing mediates uncertainty polarity change from exploration to exploitation.
(A)Transition trials (Supplementary Figure 9A) occurred later than exploratory selections and earlier than exploitative selections (left panel) (explore vs transition: t(23)=6, p<0.001, d=1.2, 95%confidence interval= [0.056 0.12]; transition vs exploit: t(23)=-2.8, p=0.01, d=-0.57, 95%confidence interval= [-0.04 -0.006]). We hypothesized activation in vmPFC to be correlated with positive uncertainty, accuracy and negative uncertainty prediction differences between predictors, but at different times during the experiment (see illustration, right panel). (B) During transition trials, activation in vmPFC covaried with the difference in the accuracy between the chosen and unchosen predictor, i.e. accuracy prediction difference (t(23) = 3.5, p= 0.002, d=0.71,95% confidence interval=[0.03 0.1]. (C-i) Participants who showed a stronger vmPFC accuracy prediction difference during the transition period (variability around time course peak from panel b), also integrated more drastically the uncertainty between predictors across time into their choice behaviour (uncertainty × block time from Figure 3A; r= 0.58, p= 0.007, 95% confidence interval=[0.23 0.8]). (ii) For illustration, this means that participants with stronger accuracy-related vmPFC activation had a stronger change in integrating uncertainty across time, i.e. a stronger slope in the uncertainty × block time effect. The illustration depicts two example participants, dark orange indicates a subject with both a strong vmPFC accuracy activation and pronounced behavioural change in how uncertainty was used to drive choice behaviour. By contrast, the participant indicated in light orange shows a weak vmPFC BOLD accuracy effect and only a small change in how uncertainty was used over time. These findings support the idea that the transition between positive uncertainty-driven exploration to negative uncertainty-driven exploitation is mediated by representing the accuracy between predictors. (n = 24; error bars are SEM across participants).
Figure 8
Figure 8. Summary. From exploration to exploitation: polarity of subjective uncertainty in vmPFC changes with behavioural mode.
At the beginning of a block, choices are exploratory and directed towards uncertain predictors (like a shuffle mode when playing music, left panel). VmPFC and an extended network centred in dACC represent the difference in uncertainty between the predictors that might be selected. With time passing, participants learn about the predictors’ accuracy through observing how well they predict an outcome. A participant’s belief in the accuracy of the predictors exerts the predominant influence on vmPFC activity during this transition phase (middle panel). Towards the end of a block, vmPFC activity represents the difference in negative uncertainty, in other words the certainty between predictors. In this exploitative period, choices are repeatedly directed towards certain predictors (like a repeat mode, right panel). We show that vmPFC carries information about a multiplicity of decision variables, the strength and polarity of which vary according to their relevance for the current context of exploration, exploitation or their transition.
None
None
None
None
None

Comment in

  • Imprecise learning and uncertainty.
    Ullsperger M. Ullsperger M. Nat Hum Behav. 2021 Jan;5(1):7-8. doi: 10.1038/s41562-020-00992-8. Nat Hum Behav. 2021. PMID: 33168952 No abstract available.

References

    1. Akaishi R, Kolling N, Brown JW, Rushworth M. Neural Mechanisms of Credit Assignment in a Multicue Environment. J Neurosci. 2016;36:1096–1112. - PMC - PubMed
    1. Leong YC, Radulescu A, Daniel R, DeWoskin V, Niv Y. Dynamic Interaction between Reinforcement Learning and Attention in Multidimensional Environments. Neuron. 2017;93:451–463. - PMC - PubMed
    1. Garrett N, González-Garzón AM, Foulkes L, Levita L, Sharot T. Updating Beliefs under Perceived Threat. J Neurosci. 2018;38:7901–7911. - PMC - PubMed
    1. Charpentier CJ, Bromberg-Martin ES, Sharot T. Valuation of knowledge and ignorance in mesolimbic reward circuitry. Proc Natl Acad Sci USA. 2018;115:E7255–E7264. - PMC - PubMed
    1. Mackintosh NJ. A theory of attention: Variations in the associability of stimuli with reinforcement. Psychological Review. 1975;82:276–298.

Publication types