. 2020 Dec;16(12):1403-1410.
doi: 10.1038/s41589-020-0626-6. Epub 2020 Aug 31.

Covalent inhibition of NSD1 histone methyltransferase

Affiliations

Covalent inhibition of NSD1 histone methyltransferase

Huang Huang et al. Nat Chem Biol. 2020 Dec.

Abstract

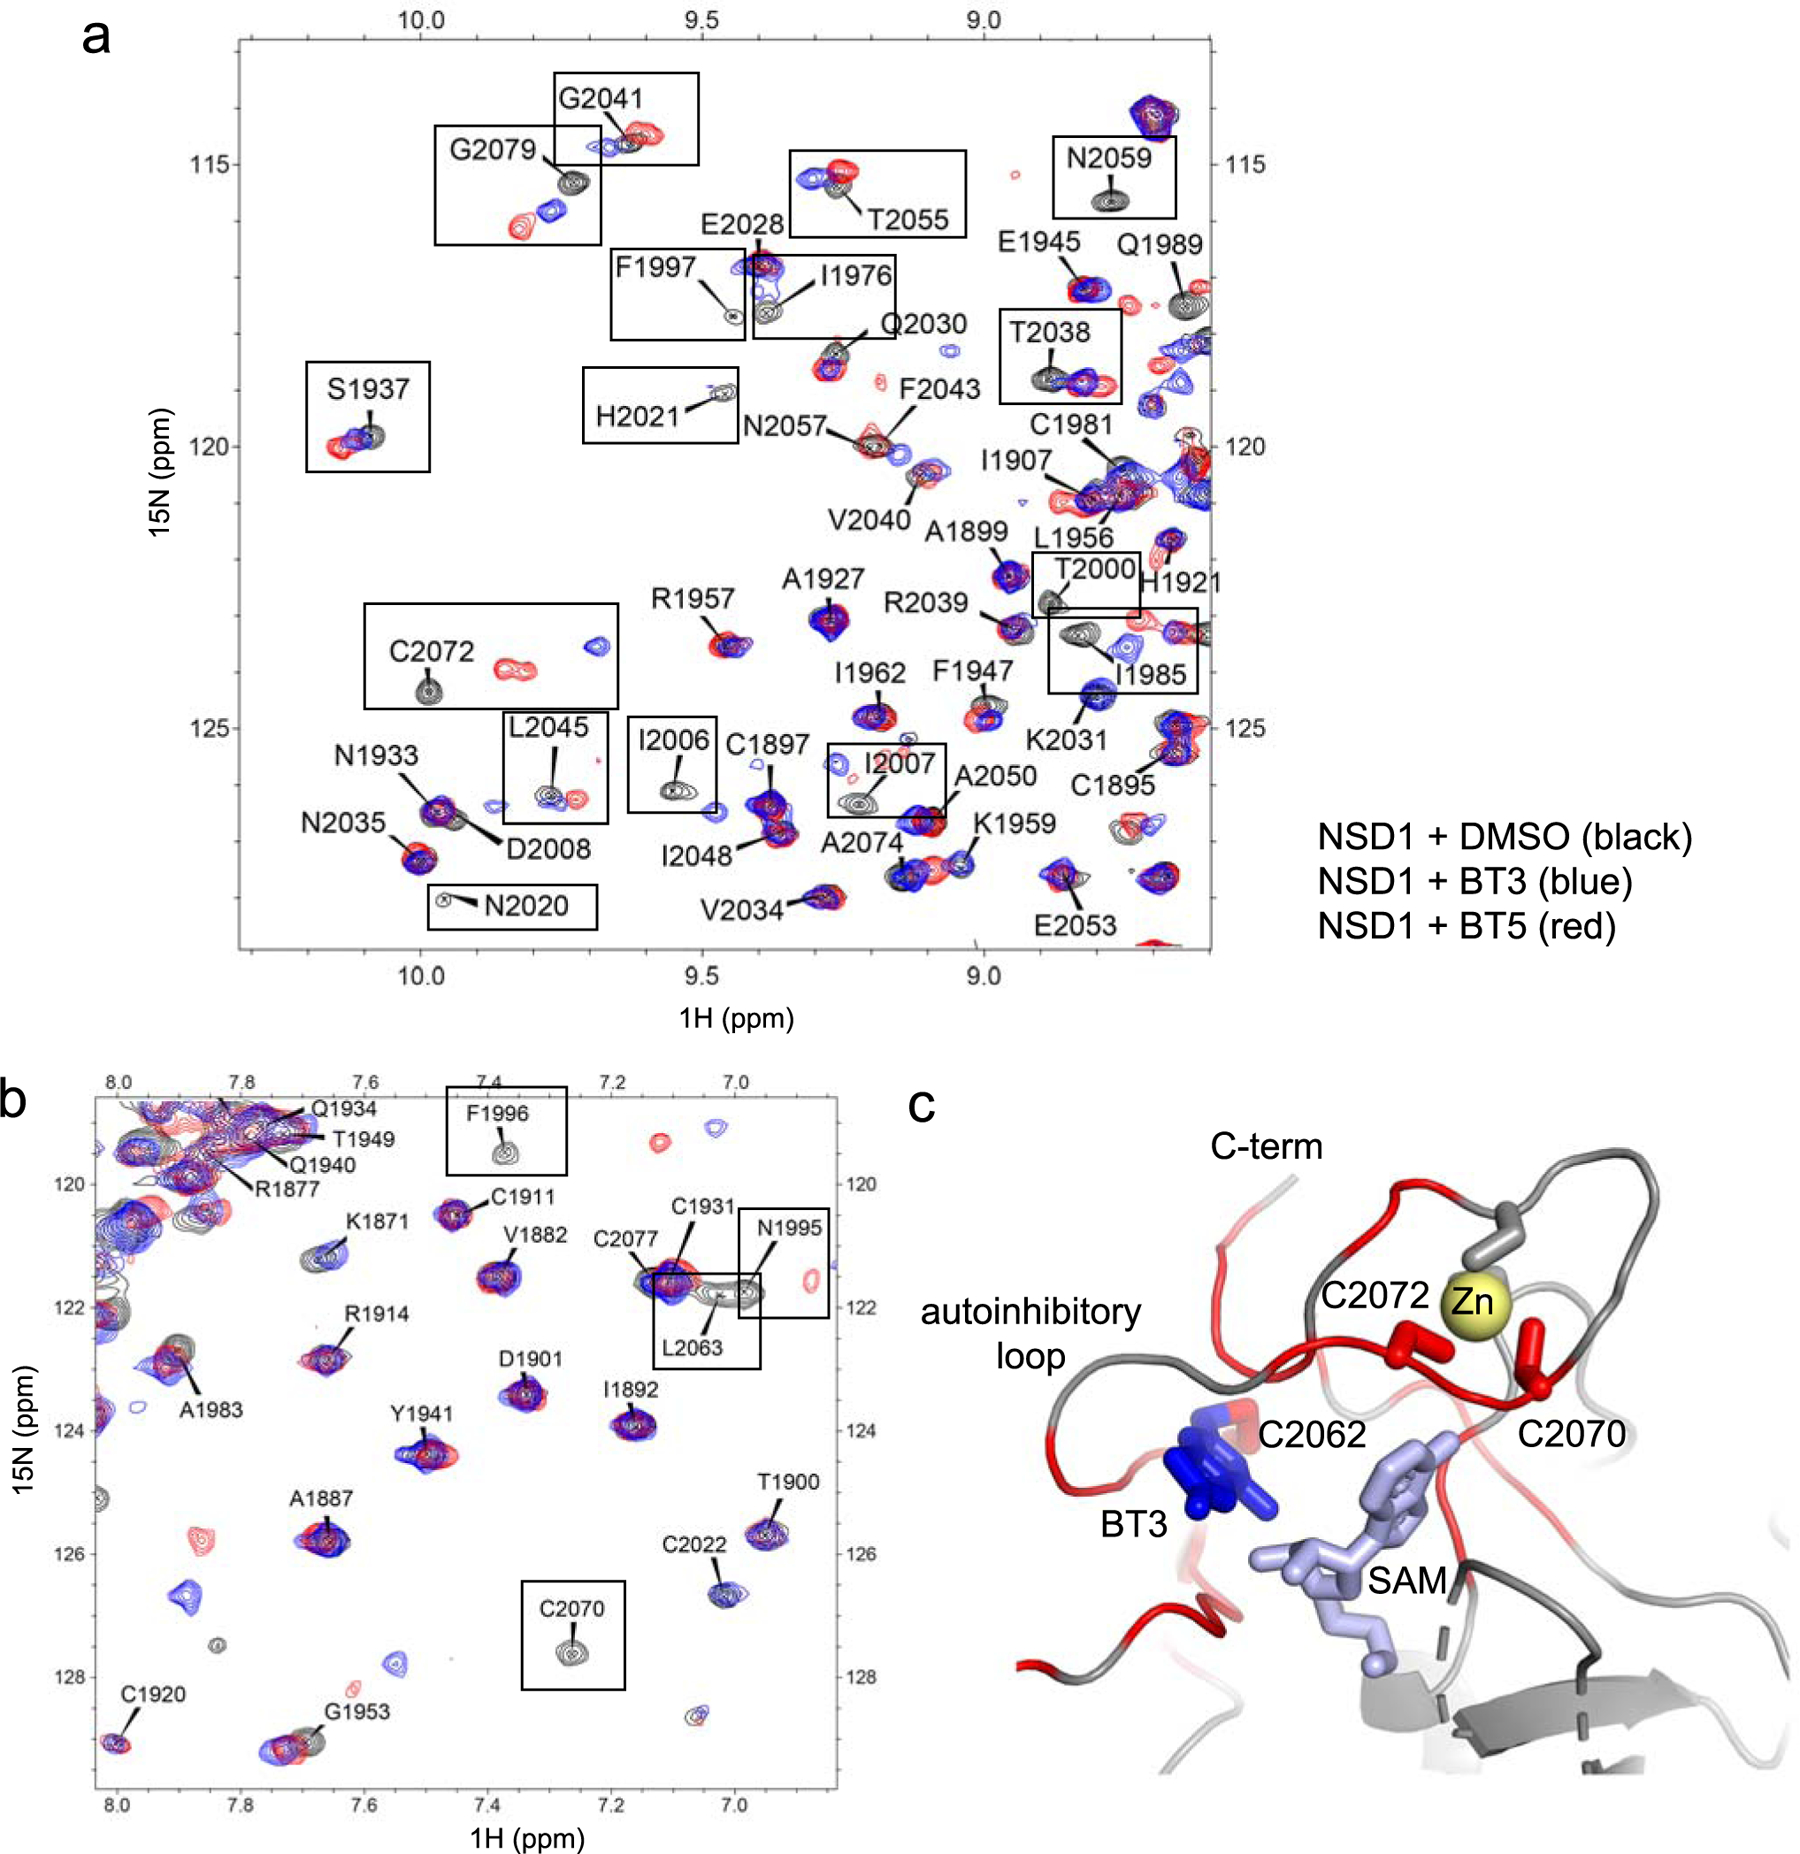
The nuclear receptor-binding SET domain (NSD) family of histone methyltransferases is associated with various malignancies, including aggressive acute leukemia with NUP98-NSD1 translocation. While NSD proteins represent attractive drug targets, their catalytic SET domains exist in autoinhibited conformation, presenting notable challenges for inhibitor development. Here, we employed a fragment-based screening strategy followed by chemical optimization, which resulted in the development of the first-in-class irreversible small-molecule inhibitors of the nuclear receptor-binding SET domain protein 1 (NSD1) SET domain. The crystal structure of NSD1 in complex with covalently bound ligand reveals a conformational change in the autoinhibitory loop of the SET domain and formation of a channel-like pocket suitable for targeting with small molecules. Our covalent lead-compound BT5-demonstrates on-target activity in NUP98-NSD1 leukemia cells, including inhibition of histone H3 lysine 36 dimethylation and downregulation of target genes, and impaired colony formation in an NUP98-NSD1 patient sample. This study will facilitate the development of the next generation of potent and selective inhibitors of the NSD histone methyltransferases.


Figures

Extended Data Fig 1.
Extended Data Fig 1.. Crystal structure of NSD1 SET domain and mapping of the binding of BT2 using NMR.
a) Superposition of the crystal structure of NSD1 SET domain (residues 1863–2085) determined in this work (magenta) onto the previously described crystal structure of NSD1 SET (PDB code 3OOI, green). Positions of the N- and C- termini are labeled and SAM is in blue sticks. b) Ribbon (left) and surface (right) representations of NSD1 SET domain (residues 1863–2085) with mapped residues undergoing strong chemical shift perturbations (ΔσHN > 0.05ppm or ΔσN > 0.5ppm) upon binding of BT2 (shown in red).
Extended Data Fig. 2.
Extended Data Fig. 2.. Crystal structure of NSD1 SET domain in complex with covalently bound compound BT3.
a) The crystal structure of NSD1 SET domain (residues 1863–2085) with bound BT3 (blue), SAM (pale blue) and mapped residues undergoing strong chemical shift perturbations (ΔσHN > 0.05ppm or ΔσN > 0.5ppm) upon binding of BT3 (shown in red). Disulfide-bond dimer of BT3 found in the structure (pale green). The dimer binds in a site that is distant from inhibitor binding and lack of chemical shift perturbations in this area indicates that this represents a crystallization artifact. b) Same as in panel a rotated by 90 deg.
Extended Data Fig. 3.
Extended Data Fig. 3.. BT3 and BT5 bind to the same site on NSD1 SET domain.
(a,b) Comparison of the two different fragments of 1H-15N HSQC spectra of 150 μM NSD1 SET domain (black), with 500 μM compound BT3 (blue) or 300 μM compound BT5 (red). Selected residues perturbed by both compounds BT3 and BT5 are boxed. (c) The crystal structure of NSD1-BT3 complex showing chemical shift perturbations (ΔσHN > 0.05ppm or ΔσN > 0.5ppm) upon binding of BT3 (shown in red). Position of two cysteine residues (C2070 and C2072) involved in Zn coordination and strongly perturbed upon binding of BT3 is shown.
Extended Data Fig. 4.
Extended Data Fig. 4.. Compound BT5 does not bind covalently to NSD1 C2062A SET domain.
(a) MS spectra of 1 μM wild-type NSD1 SET domain incubated with DMSO (left) or 16 μM BT5 (right) for 2 h showing 51% covalent engagement with BT5. (b) MS spectra of 1 μM NSD1 C2062A SET domain incubated with DMSO (left) or 16 μM BT5 (right) for 2 h. No covalent engagement of BT5 is observed (expected mass 30,066 Da). Representative spectra shown are from two independent experiments (n=2).
Extended Data Fig. 5.
Extended Data Fig. 5.. Treatment with BT5 lacks engagement with NSD2 and NSD3 in cells.
CETSA assay in HEK293T cells transfected with FLAG-NSD2 SET (top) or FLAG-NSD3 SET (bottom) constructs treated with DMSO or 5 μM BT5. Cell lysates were incubated for 3 min at indicated temperatures. Experiments were performed two times.
Figure 1.
Figure 1.
Development of NSD1 ligands using fragment-based approach. a) Chemical structures of fragment hit BT1 and improved BT2; b) Characterization of the binding of BT2 to NSD1 SET using ITC. Data are mean ± s.d. from two independent experiments; c) Activity of BT2 in HMT assays with NSD1. Mean IC50 values ± s.d. calculated from two independent experiments. d) Fragment of 1H-15N HSQC spectrum of 150 μM 15N NSD1 SET (black) superimposed onto the spectrum of 150 μM 15N NSD1 SET with 150 μM BT2 (red). Selected residues in the autoinhibitory loop are boxed; e) crystal structure of NSD1 SET domain with mapped residues undergoing strong chemical shift perturbations (ΔσHN > 0.05ppm or ΔσN > 0.5ppm) upon binding of 150 μM BT2 (red). NSD1 SET domain is shown in surface with C2062 in yellow.
Figure 2.
Figure 2.
Crystal structure of NSD1 with covalently bound BT3. a) Chemical structure of BT3. b) MS spectrum of 1 μM NSD1 SET domain incubated with 30 μM BT3 for 18 h at 30 °C. Representative spectrum of two independent experiments. c) Crystal structure of NSD1 SET with covalently bound BT3. Electron density omit map for BT3 contoured at 1 σ is shown as black mesh. BT3 and residues in the binding site are shown as sticks; SAM is blue. d) Details of BT3 binding site. BT3 (orange carbons), selected residues in the binding site (white carbons) and SAM (blue carbons) are shown in sticks. Internal water is shown as red sphere. e) Comparison of the autoinhibitory loop regions between NSD1 SET bound to BT3 (left, autoinhibitory loop in magenta) and ligand free NSD1 SET (right, autoinhibitory loop is green). Protein is in surface representation, SAM (green and magenta) and BT3 (blue) are shown in sticks; f) Conformation of the autoinhibitory loop and the C-terminus in NSD1 SET with bound BT3 (magenta carbons) superimposed onto the structure of ligand-free NSD1 SET (green carbons). Selected residues are presented in sticks and labeled.
Figure 3.
Figure 3.
Characterization of the covalent engagement of irreversible NSD1 inhibitors. a) MS spectra of 1 μM NSD1 SET domain incubated with 10 μM aziridine analogs BT4, BT5, BT6 for 8 h at 32°C. Percent of covalent engagement with NSD1 SET is shown in parenthesis. Representative spectra out of two independent replicates. b) Fragment of 1H-15N HSQC spectrum of 150 μM 15N NSD1 SET (black) superimposed onto spectrum of 150 μM 15N NSD1 SET with 300 μM BT4 (red). Assignment is shown for selected residues undergoing strong chemical shift perturbations including C2062. c,d) Determination of the kinact/KI for binding of BT4 (c) and BT5 (d) to NSD1 using MS. Mean values of kinact, KI and kinact/KI ± s.d. from two independent experiments and representative graphs are shown. e) MS spectra of 1 μM NSD2 and 1 μM NSD3 incubated with 10 μM BT5 for 8 h at 32° C. Representative spectra are shown out of two replicates.
Figure 4.
Figure 4.
Characterization of the activity of NSD1 inhibitors in HMT assays. a,b) Inhibition of NSD1 activity by BT5 after 4 h (a) and 16 h (b) incubation. c) Inhibition of NSD2 and NSD3 by BT5 after 4 h incubation. d) Inhibition of NSD1 by BT6 after 4 h incubation. Mean IC50 values ± s.d. are calculated from two independent experiments, each with n = 3, and representative graphs are shown. e). Activity of 50 μM BT5 tested against panel of histone methyltransferases in HMT assay using technical duplicates. Error bars represent s.d.
Figure 5.
Figure 5.
Treatment with BT5 demonstrates on-target activity in cells. a) CETSA assay in HEK293T cells transfected with Flag-NSD1 SET construct treated overnight (~16 h) with DMSO or 5 μM BT5. Representative gel of two independent experiments. b) HiBiT CETSA in HEK293T cells treated with DMSO or 5 μM BT5. Experiment was performed once with n = 2. c) Growth inhibition of a panel of leukemia cell lines upon treatment with BT5 (NUP98-NSD1, GI50 = 0.87 ± 0.09 μM; HM-2, GI50 = 5.1 ± 0.3 μM; MOZ-TIF2, GI50 = 6.1 ± 0.7 μM; NUP98-HOXA9, GI50 = 7.7 ± 0.6 μM; K562, GI50 > 12.5 μM; MOLM13, GI50 = 7.6 ± 0.7 μM; SET2, GI50 > 12.5 μM) and BT6 (NUP98-NSD1, GI50 = 6.7 ± 0.8 μM) quantified using MTT assay. GI50 values are mean ± s.d. from two independent experiments. d) Levels of H3K36 methylation in HM-2 and NUP98-NSD1 cells. Representative gel of two independent experiments. e,f) Assessment of epigenetic marks in NUP98-NSD1 (e) and HM-2 (f) cells treated with BT5 for 8 days. Representative gel of two independent experiments. g) qPCR analysis of HoxA genes and Meis1 in NUP98-NSD1 cells treated with BT5 for 8 days. Representative data from two independent experiments and analyzed by unpaired two-tailed t-test. h) ChIP-qPCR analysis of H3K36me2, H3K36me3 and H3 occupancy at the promoter of Hoxa9 in NUP98-NSD1 cells treated with DMSO or 2 μM BT5 for 4 days. Representative data of two experiments analyzed by unpaired two-tailed t-test. ns – not significant.
Figure 6.
Figure 6.
Activity of BT5 in primary samples. a) Colony assay in patient sample with NUP98-NSD1 translocation treated with BT5 for 10 days. Data are mean ± s.d. from one experiment with cells plated in triplicates and analyzed by unpaired two-tailed t-test. b) Representative colonies from treatment of NUP98-NSD1 sample with DMSO or 12 μM BT5. c) Expression of HOXA9 and MEIS1 in NUP98-NSD1 sample treated with BT5 for 10 days. Data are mean ± s.d. from one experiment with cells plated in triplicates and analyzed by unpaired two-tailed t-test; ns – not significant. d) Colony assay in patient sample with MLL-ENL translocation treated with BT5 for 10 days. Data are mean ± s.d. from one experiment with cells plated in triplicates and analyzed by unpaired two-tailed t-test. ns – not significant. e) Representative colonies from treatment of MLL-ENL sample with DMSO or 12 μM BT5. f) Colony assay in normal CD34+ cells treated with BT5 for 10 days. Data are mean ± s.d. from one experiment with cells plated in triplicates and analyzed by unpaired two-tailed t-test. ns – not significant. g) Representative colonies from treatment of CD34+ cells with DMSO or 12 μM BT5.

Comment in

References

    1. Bennett RL, Swaroop A, Troche C & Licht JD The Role of Nuclear Receptor-Binding SET Domain Family Histone Lysine Methyltransferases in Cancer. Cold Spring Harb Perspect Med 7 (2017). - PMC - PubMed
    1. Wagner EJ & Carpenter PB Understanding the language of Lys36 methylation at histone H3. Nat Rev Mol Cell Biol 13, 115–126 (2012). - PMC - PubMed
    1. Morishita M & di Luccio E Cancers and the NSD family of histone lysine methyltransferases. Biochim Biophys Acta 1816, 158–163 (2011). - PubMed
    1. Job B et al. Genomic aberrations in lung adenocarcinoma in never smokers. PLoS One 5, e15145 (2010). - PMC - PubMed
    1. Bianco-Miotto T et al. Global levels of specific histone modifications and an epigenetic gene signature predict prostate cancer progression and development. Cancer Epidemiol Biomarkers Prev 19, 2611–2622 (2010). - PubMed

Publication types

MeSH terms