. 2020 Sep;22(9):1049-1055.
doi: 10.1038/s41556-020-0564-2. Epub 2020 Aug 31.

Lipid peroxidation regulates long-range wound detection through 5-lipoxygenase in zebrafish

Affiliations

Lipid peroxidation regulates long-range wound detection through 5-lipoxygenase in zebrafish

Anushka Katikaneni et al. Nat Cell Biol. 2020 Sep.

Erratum in

Abstract

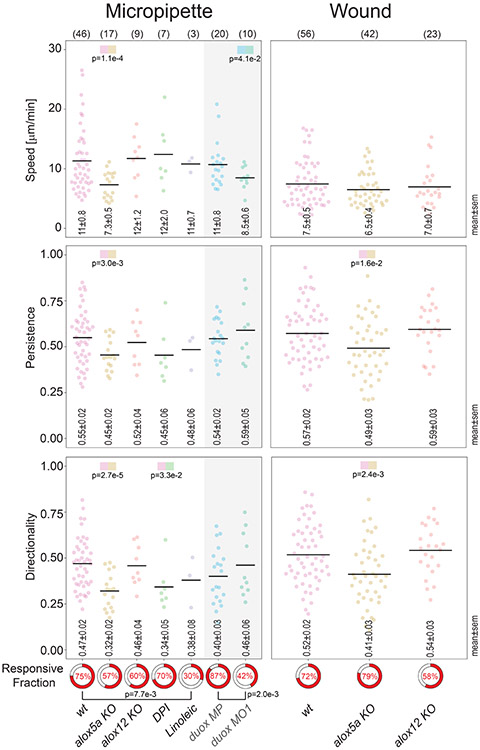
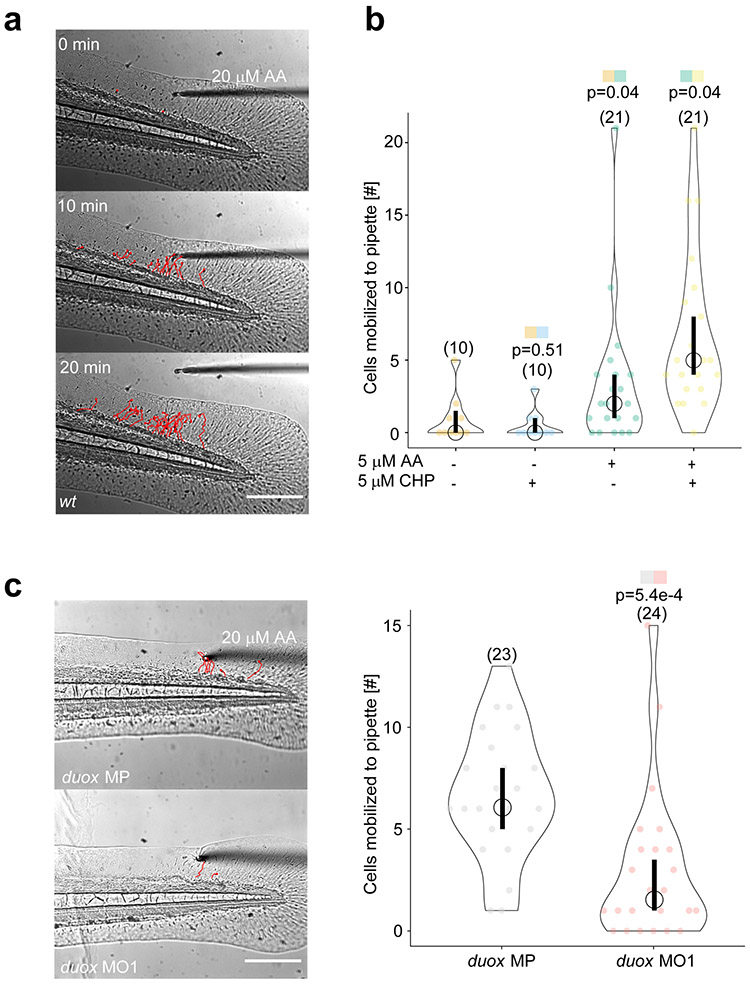
Rapid wound detection by distant leukocytes is essential for antimicrobial defence and post-infection survival1. The reactive oxygen species hydrogen peroxide and the polyunsaturated fatty acid arachidonic acid are among the earliest known mediators of this process2-4. It is unknown whether or how these highly conserved cues collaborate to achieve wound detection over distances of several hundreds of micrometres within a few minutes. To investigate this, we locally applied arachidonic acid and skin-permeable peroxide by micropipette perfusion to unwounded zebrafish tail fins. As in wounds, arachidonic acid rapidly attracted leukocytes through dual oxidase (Duox) and 5-lipoxygenase (Alox5a). Peroxide promoted chemotaxis to arachidonic acid without being chemotactic on its own. Intravital biosensor imaging showed that wound peroxide and arachidonic acid converged on half-millimetre-long lipid peroxidation gradients that promoted leukocyte attraction. Our data suggest that lipid peroxidation functions as a spatial redox relay that enables long-range detection of early wound cues by immune cells, outlining a beneficial role for this otherwise toxic process.


Figures

Extended Data Fig. 1
Extended Data Fig. 1. Additional data supporting Figure 1 and 2.
(a) Leukocyte mobilization to different AA preparations. Circles, median. Bars, 95% confidence interval. Data aggregated from n=10 (Cayman AA), and n=10 (Sigma AA) biologically independent animal experiments. No significant difference (p=0.51) detected between groups by two-sided, heteroscedastic Student’s t-test. (b) CHP stimulates H2O2. Zebrafish tail fins of wild type larvae were loaded with the H2O2 sensor dye acetyl-pentafluorobenzene sulphonyl fluorescein, and then exposed to 5 μM CHP or DMSO control (Ctr). Top panel, representative dye emission images at 0 min and 45 min after CHP exposure. Lower panel, plots (mean ± SEM) of normalized dye fluorescence over 45 min after CHP exposure. Data aggregated from n=15 (Ctr), and n=18 (CHP) biologically independent animal experiments (c) Time-lapse montage of a wave-like tissue degeneration emerging from an AA (20 μM) microperfusion patch site. Pink shade highlights the affected region. Time, hh:mm:ss. Images representative of the 2 out of 241 biologically independent animal experiments with observable waves. (d) Confirmation of duox knockdown by RT-PCR in 2 dpf embryos. Representative for three independent analyses. (e) C11B-imaging of control larvae (Ctr) and larvae treated with 20 μM or 100 μM DPI ~15-30 min after tail fin tip amputation. Upper panel: Representative C11B ratio images. Lower panel: Wound ratio, mean C11B ratio normalized to median baseline ratio ± SEM plotted against wound distance. Inset, boxplots of baseline ratios normalized to control. Central mark, median. Box edges, 25th/75th percentiles. Whiskers, most extreme, non-outlier data points. +, outliers. Data aggregated from n=17 (Ctr, 0 μM DPI), n=9 (20 μM DPI), and n=9 (100 μM DPI) biologically independent animal experiments. Parentheses, number of different animals. Scale bar, 200 μm. Statistical source data can be found at Source data Extended Data Figure 1.
Extended Data Fig. 2
Extended Data Fig. 2. Characterization of the alox12 KO mutant.
(a) Schematic representation of the protein domains of zebrafish 12-lipxoygenase (Alox12). The lipoxygenase domain of Alox12 responsible for enzymatic function was targeted with a short guide RNA (sgRNA). (b) Sanger sequence analysis of cDNA identified a two-base pair deletion at nucleotide position 1011-1012 within exon 10 of alox12. (c) The targeted region of the lipoxygenase domain of zebrafish Alox12 is well conserved compared to human ALOX12. The frameshift mutant alox12 allele contains a premature stop codon in the coding sequence. Asterisks, fully conserved residues. Colons, conservation of strongly similar residues. Periods, conservation of weakly similar residues. (d) Next-Gen Sequencing and CRISPResso analysis of the amplicon containing the sgRNA cut site was performed on genomic DNA from tail fin clips of F2 adult alox12-targeted zebrafish. Alox12-targeted F2 male and female zebrafish exhibited a 2 bp mutation positioned at the proposed sgRNA cut site in greater than 99% of sequence reads over a depth of more than 300 and 400 thousand reads, respectively. Wild type zebrafish displayed background sequence abnormalities below 1% in more than 140 thousand total reads. (e) CRISPResso analysis of F2 male and female zebrafish targeted with the sgRNA against alox12 identifies a single 2 bp indel. An indel is denoted by a blue solid bar and no indel is represented by a red dashed bar. Wildtype zebrafish display no indels in most of the sequence reads.
Extended Data Fig. 3
Extended Data Fig. 3. Characterization of the alox5a KO mutant.
(a) Schematic representation of zebrafish Alox5a. A single guide RNA (sgRNA) was designed to target alox5a for gene disruption within the lipoxygenase domain at exon 7 (bold text). Successful target disruption is predicted to occur at a ScaI restriction enzyme recognition site (AGT^ACT) (highlighted red text) within the genomic DNA (gDNA) sequence, potentially destroying the sequence upon DNA repair. (b) alox5a wild type and knockout mutant alleles. The mutant alox5a allele contains an 8-base pair (bp) deletion resulting in a frameshift and the destruction of the ScaI restriction enzyme recognition site. Red text, mutant alox5a sequence that differs from the wild type sequence. (c) The targeted region of the lipoxygenase domain of zebrafish Alox5a is highly conserved compared to human ALOX5. The mutant alox5a allele contains a premature stop codon in the coding sequence, resulting in a truncated Alox5a. Asterisks, fully conserved residues. Colons, conservation of strongly similar residues. Periods, conservation of weakly similar residues. Red text, mutant Alox5a sequence that differs from the wild type sequence. (d) Heterozygous alox5a larvae were crossed and gDNA from isolated progeny was PCR amplified, ScaI-digested, and analyzed by agarose gel electrophoresis for genotyping. PCR product from the wild type alox5a allele is cleaved into two smaller products upon incubation with ScaI (409 and 693 bp products). The mutant alox5a allele is not cleaved by ScaI (1094 bp product only). Heterozygotes are identified by the combined presence of a cleaved wild type allele and non-cleaved mutant allele (409, 693, and 1094 bp products). Representative of three independent analyses. (e) Sudan black-stained neutrophils in the tail region of zebrafish larvae at 2.5-3 days post fertilization. Shown are three representative animals from a total of 20 different larvae stained per genotype. Scale bar, 200 μm.
Extended Data Fig. 4
Extended Data Fig. 4. Aggregated leukocyte tracking analysis.
Left panels: leukocyte speed, migration persistence, directionality, and responsiveness towards microperfused 20 μM AA tracked over 20 min after patching. Right panels: leukocyte speed, migration persistence, directionality, and responsiveness towards a tail fin wound tracked over 40 min after tail fin injury. Leukocyte speed, migration persistence, directionality was calculated as previously described (see Methods). The Responsive Fractions (red color, pie charts) denote the fractions of animals for which at least two tracks > 50 μm could be reliably measured in the caudal tail fin below the notochord line. Tracking data are only aggregated for responsive animals. Only clearly distinct positions were marked for tracking; stationary leukocytes were not tracked. The tracking analysis was performed on the time lapse data underlying Figure 1c, 2d, 4a, 4b, and an additional AA/DPI pipette experiment, in which leukocyte migration to a micropipette filled with 20 μM AA + 50 μM DPI (DPI, green dots) was tracked. Gray shaded region, duox MO1 morphants were compared to duox MP animals instead of wild type animals, as both samples are also co-morphants for p53 (see Methods). Horizontal bars, mean. Data aggregated from n=46 (wt, Micropipette ), n=17 (alox5a KO, Micropipette), and n=9 (alox12 KO, Micropipette), n=7 (DPI, Micropipette), n=3 (Linoleic, Micropipette), n=20 (duox MP, Micropipette), n=10 (duox MO1, Micropipette), n=56 (wt, Wound), n=42 (alox5a KO, Wound), and n=23 (alox12 KO, Wound) biologically independent animal experiments. P-values with color code, two-sided, heteroscedastic Student’s t-test for pairwise comparison of the indicated color-coded samples. P-value near brackets, two-tailed Fisher’s exact test between Responsive Fractions indicated by brackets. Parentheses, number of different animals. Statistical source data can be found at Source data Extended Data Figure 4.
Extended Data Fig. 5
Extended Data Fig. 5. Cartoon scheme of proposed mechanism.
Wounding activates Duox to produce H2O2 and causes hypotonic (Hypo) shock, which leads to release of PUFAs (including AA). H2O2 reacts with Fe2+ to generate HO∙ by Fenton chemistry. HO∙ reacts with PUFAs/AA to generate long-chain lipid ROS (PUFA-OO∙, PUFA-OOH) that further promote lipid peroxidation, and activate Alox5a to produce leukocyte chemoattractants. If lipid peroxidation slips out of control, it may cause cell death.
Figure 1.
Figure 1.. Oxidative stress enhances wound detection through the arachidonic acid pathway.
(a) Rapid leukocyte migration to 20 μM arachidonic acid (AA) released by micropipette patched onto an intact, larval zebrafish tail fin. Note, leukocytes immediately turn back to the vasculature after the pipette is removed. Red, leukocyte tracks at indicated times after patching. Representative of 3 biologically independent animal experiments. (b) Intact fins perfused with dimethyl sulfoxide (DMSO) carrier control, 5 μM cumene hydroperoxide (CHP), 5 μM AA alone or in combination with CHP. Violin plot depicting the number of leukocytes per animal mobilized towards the pipette tip within 20 min after patching. Data aggregated from n=10 (AA−/CHP−), n=10 (AA−/CHP+), n=21 (AA+/CHP−), and n=21 (AA+/CHP+) biologically independent animal experiments. P-value, two-sided, heteroscedastic Student’s t-test for pairwise comparison of the indicated color-coded samples. Circle, median. Bar, 95% confidence interval. (c) Intact fins of control (duox MP) and duox morphant (duox MO1) larvae perfused with 20 μM AA. Left panel: Representative images of control (duox MP) or duox morphant (duox MO1) tail fins at 20 min after patching. Red, leukocyte tracks. Right panel: Violin plot depicting the number of leukocytes per animal mobilized towards the pipette tip within 20 min after patching. Circle, median. Bar, 95% confidence interval. Data aggregated from n=23 (duox MP), and n=24 (duox MO1) biologically independent animal experiments. P-value, two-sided, heteroscedastic Student’s t-test for pairwise comparison of the indicated color-coded samples. Parentheses, number of different animals. Scale bars, 200 μm. Statistical source data can be found at Source data figure 1.
Figure 2.
Figure 2.. Lipid peroxidation gradients integrate oxidative and osmotic wound cues.
(a) C11B-imaging of control (duox MP) and duox knockdown (duox MO1) zebrafish larvae ~15-30 min after tail fin tip amputation. Upper panel: Representative C11B ratio images. Lower panel: Wound ratio, mean C11B ratio normalized to median baseline ratio ± SEM plotted against wound distance. Inset, boxplots of baseline ratios normalized to control. Central mark, median. Box edges, 25th/75th percentiles. Whiskers, most extreme, non-outlier data points. +, outliers. Data aggregated from n=59 (duox MP), and n=45 (duox MO1) biologically independent animal experiments. (b) C11B-imaging of zebrafish larvae ~15-30 min after tail fin tip amputation in hypotonic (Hypo) or isotonic (Iso: Hypo +135 mM NaCl) bathing solution. Upper panel: Representative C11B ratio images. Lower panel: Wound ratio, mean C11B ratio normalized to median baseline ratio ± SEM plotted against wound distance. Inset, boxplots of baseline ratios normalized to control. Central mark, median. Box edges, 25th/75th percentiles. Whiskers, most extreme, non-outlier data points. +, outliers. Data aggregated from n=19 (Hypo), and n=19 (Iso) biologically independent animal experiments. (c) Violin plot of C11B ratios in unwounded tail fins ~60 min after exposure to 20 μM of the indicated free fatty acids or DMSO carrier control. Circle, median. Bar, 95% confidence interval. P-value, two-sided, heteroscedastic Student’s t-test for pairwise comparison of the indicated color-coded samples. Data aggregated from n=15 (Control), n=19 (Arachidonic), n=18 (Arachidic), n=17 (Linoleic), n=18 (Linolenic), and n=18 (Oleic) biologically independent animal experiments. (d) Left panel: Representative images of wild type (wt) tail fins patched with 20 μM arachidonic (AA) or linoleic (Lin) acid at 20 min after patching. Red, leukocyte tracks. Right panel: Violin plot depicting the number of leukocytes per animal mobilized towards the pipette tip within 20 min after patching. Data aggregated from n=10 (Arachidonic), and n=10 (Linoleic) biologically independent animal experiments. P-value, two-sided, heteroscedastic Student’s t-test for pairwise comparison of the indicated color-coded samples. Circle, median. Bar, 95% confidence interval. Parentheses, number of different animals. Scale bars, 200 μm. Statistical source data can be found at Source data figure 2.
Figure 3.
Figure 3.. Inhibiting lipid peroxidation inhibits wound detection.
(a) C11B-imaging of control larvae and larvae treated with the GPX mimetic ebselen (Ebs, 3 μM) ~15-30 min after tail fin tip amputation. Upper panel: Representative C11B ratio images. Lower panel: Wound ratio, mean C11B ratio normalized to median baseline ratio ± SEM plotted against wound distance. Inset, boxplots of baseline ratios normalized to control. Central mark, median. Box edges, 25th/75th percentiles. Whiskers, most extreme, non-outlier data points. +, outliers. Data aggregated from n=17 (Ctr), and n=20 (Ebs) biologically independent animal experiments. (b) C11B-imaging of control larvae and larvae treated with the lipid radical scavenger liproxstatin-1 (Lpx, 20 μM) ~15-30 min after tail fin tip amputation. Upper panel: Representative C11B ratio images. Lower panel: Wound ratio, mean C11B ratio normalized to median baseline ratio ± SEM plotted against wound distance. Inset, boxplots of baseline ratios normalized to control. Central mark, median. Box edges, 25th/75th percentiles. Whiskers, most extreme, non-outlier data points. +, outliers. Data aggregated from n=17 (Ctr), and n=12 (Lpx) biologically independent animal experiments. (c) Left panel: Representative images of wounded tail fins treated with (Ebs, 3 μM) or DMSO control (Ctr) at 40 min after injury. Red, leukocyte tracks. Right panel: Violin plot depicting the number of leukocytes per animal recruited to a tail fin wound within 40 min after injury. Circles, median. Bars, 95% confidence intervals. Data aggregated from n=55 (Ctr), and n=39 (Ebs) biologically independent animal experiments. P-value, two-sided, heteroscedastic Student’s t-test for pairwise comparison of the indicated color-coded samples. (d) Left panel: Representative images of wounded fish treated with liproxstatin-1 (Lpx, 20 μM), or α-tocopherol (αTOC, 100 μM), or DMSO control (Ctr) at 40 min after injury. Red, leukocyte tracks. Right panel: Violin plot depicting the number of leukocytes per animal recruited to a tail fin wound within 40 min after injury. Circles, median. Bars, 95% confidence intervals. Data aggregated from n=118 (Ctr), n=135 (Lpx), and n=33 (αTOC) biologically independent animal experiments. P-value, two-sided, heteroscedastic Student’s t-test for pairwise comparison of the indicated color-coded samples. Parentheses, number of different animals. Scale bars, 200 μm. Statistical source data can be found at Source data figure 3.
Figure 4.
Figure 4.. Arachidonic acid initiates wound detection through 5-lipoxygenase.
(a) Left panel: Representative images of wild type (wt), alox12 KO, and alox5a KO tail fins patched with 20 μM AA at 20 min after patching. Right panel: Violin plot depicting number of leukocytes per animal mobilized towards the pipette tip within 20 min for each genotype. Circles, median. Bars, 95% confidence intervals. Data aggregated from n=42 (wt), n=16 (alox12 KO), and n=31 (alox5a KO) biologically independent animal experiments. P-value, two-sided, heteroscedastic Student’s t-test for pairwise comparison of the indicated color-coded samples. (b) Left panel: Representative images of wounded wt, alox12 KO, and alox5a KO tail fins at 40 min after injury. Right panel: Violin plot depicting number of leukocytes per animal recruited towards the tail fin wound within 40 min after injury for each genotype. Data aggregated from n=246 (wt), n=192 (alox12 KO), and n=71 (alox5a KO) biologically independent animal experiments. P-value, two-sided, heteroscedastic Student’s t-test for pairwise comparison of the indicated color-coded samples. Circles, median. Bars, 95% confidence interval. (c) C11B ratios of wt, alox12 KO, and alox5a KO larvae ~15-30 min after tail fin amputation. Wound ratio, mean C11B ratio normalized to median baseline ratio ± SEM plotted against wound distance. Inset, boxplots of baseline ratios normalized to control. Central mark, median. Box edges, 25th/75th percentiles. Whiskers, most extreme, non-outlier data points. +, outliers. Data aggregated from n=149 (wt), n=77 (alox12 KO), and n=74 (alox5a KO) biologically independent animal experiments. (d) Superposition of the calibrated wound H2O2 gradient (blue, published in Figure 3D and 4 of Jelcic & Enyedi, 2017 ) and the lipid peroxidation gradient (red, duox MP, Figure 2a) at ~ 15-30 min after tail fin tip amputation. Data presented as mean values ± SEM. Parentheses, number of different animals. Scale bars, 200 μm. Statistical source data can be found at Source data figure 4.

Comment in

Similar articles

Cited by

References

    1. Huang C & Niethammer P Tissue damage signaling is a prerequisite for protective neutrophil recruitment to microbial infection in zebrafish. Immunity 48, 1006–1013.e6 (2018). - PMC - PubMed
    1. Niethammer P, Grabher C, Look AT & Mitchison TJ A tissue-scale gradient of hydrogen peroxide mediates rapid wound detection in zebrafish. Nature 459, 996–999 (2009). - PMC - PubMed
    1. Yoo SK, Starnes TW, Deng Q & Huttenlocher A Lyn is a redox sensor that mediates leukocyte wound attraction in vivo. Nature 480, 109–112 (2011). - PMC - PubMed
    1. Enyedi B, Kala S, Nikolich-Zugich T & Niethammer P Tissue damage detection by osmotic surveillance. Nat. Cell Biol 15, 1123–1130 (2013). - PMC - PubMed
    1. Enyedi B & Niethammer P Mechanisms of epithelial wound detection. Trends Cell Biol. 25, 398–407 (2015). - PMC - PubMed

Publication types

MeSH terms