. 2020 Sep;22(9):1042-1048.
doi: 10.1038/s41556-020-0565-1. Epub 2020 Aug 31.

Ferroptosis occurs through an osmotic mechanism and propagates independently of cell rupture

Affiliations

Ferroptosis occurs through an osmotic mechanism and propagates independently of cell rupture

Michelle Riegman et al. Nat Cell Biol. 2020 Sep.

Abstract

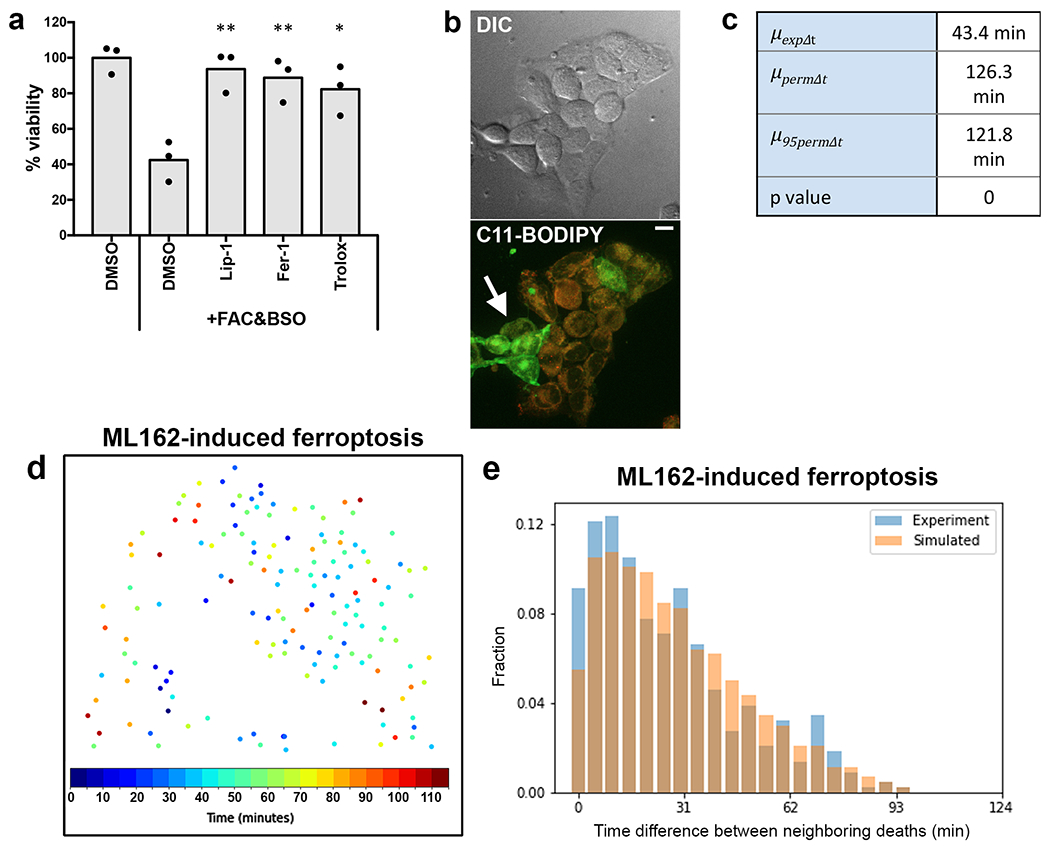
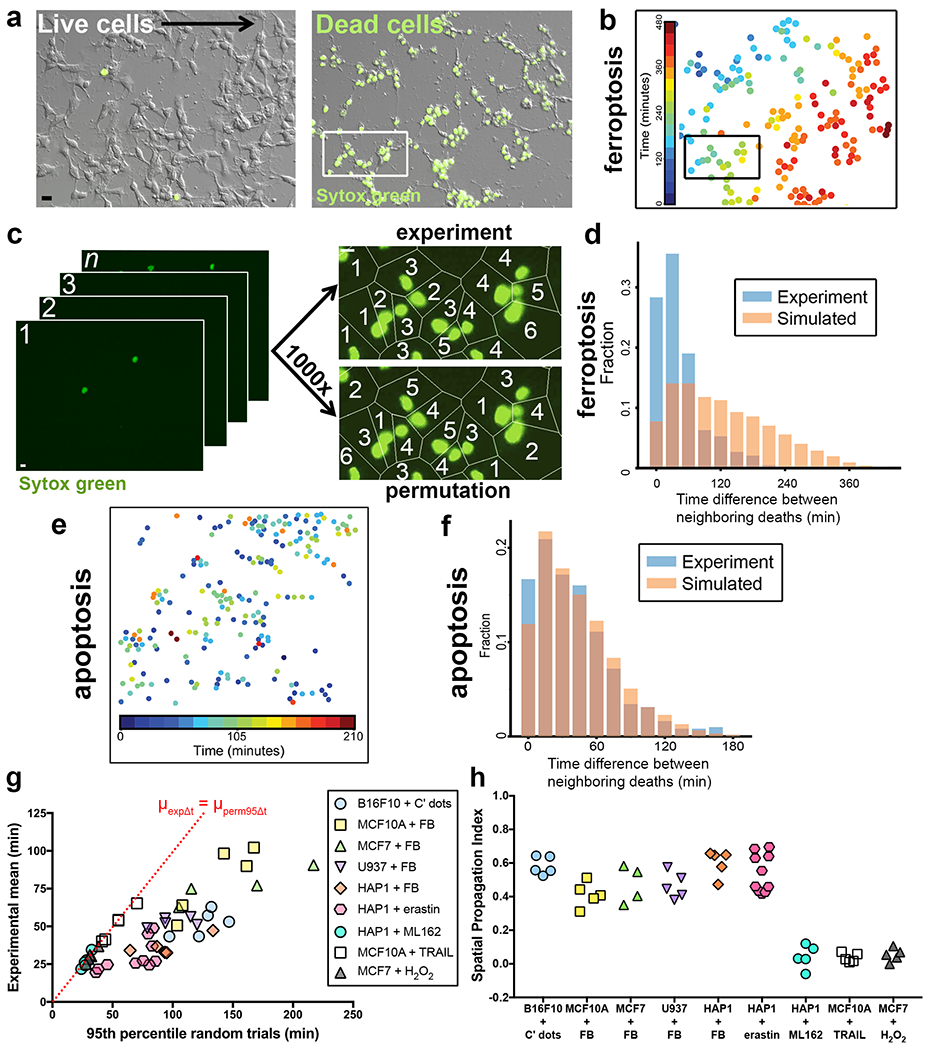
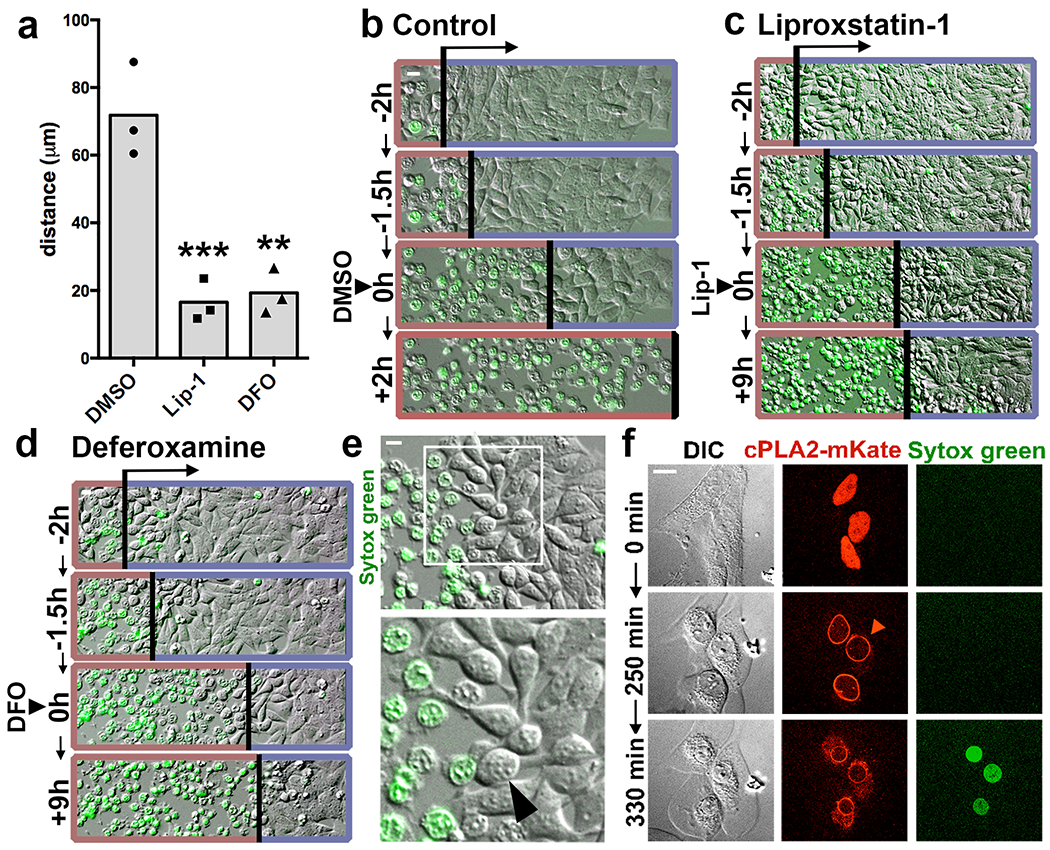
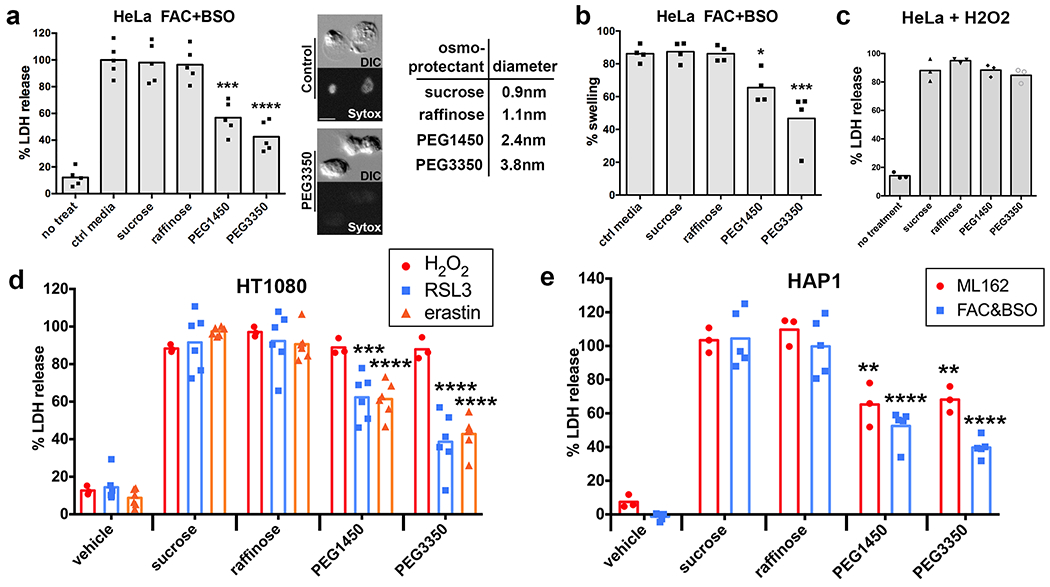
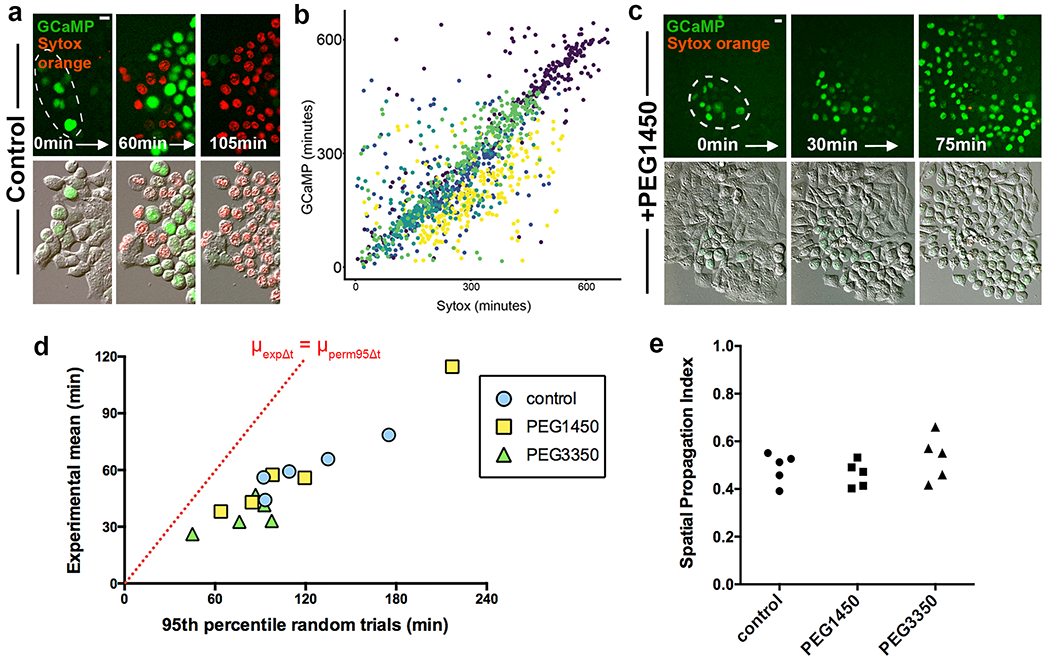
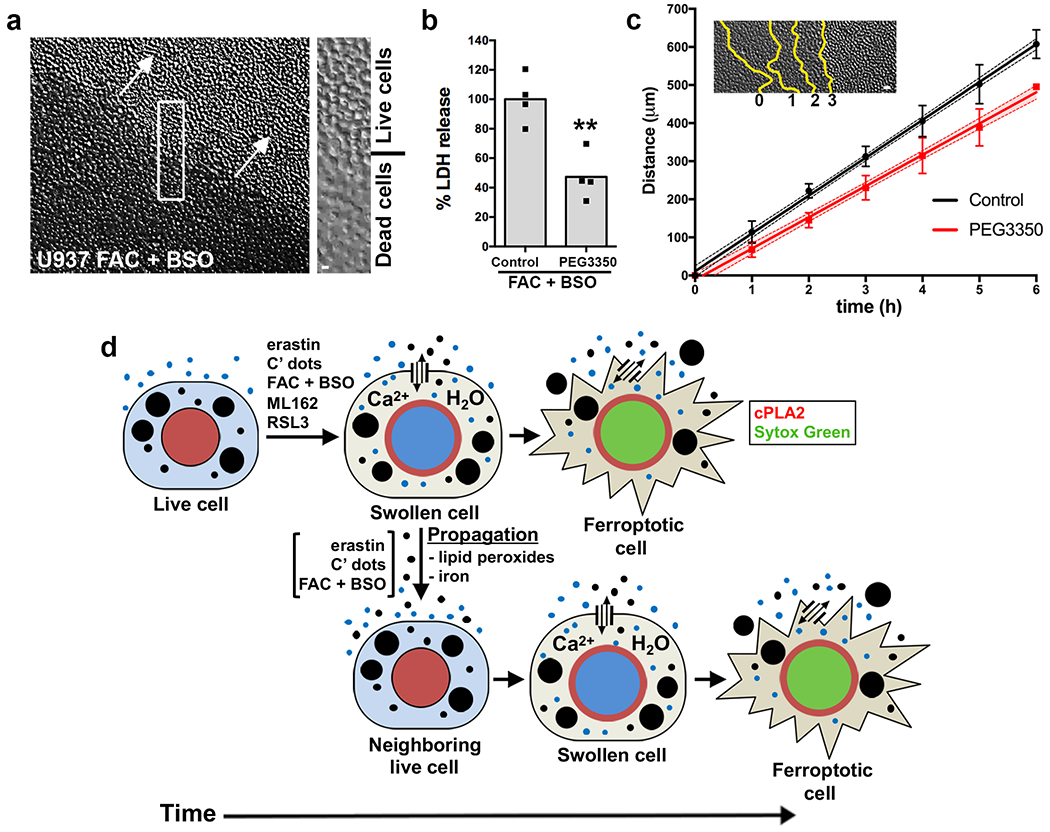
Ferroptosis is a regulated form of necrotic cell death that is caused by the accumulation of oxidized phospholipids, leading to membrane damage and cell lysis1,2. Although other types of necrotic death such as pyroptosis and necroptosis are mediated by active mechanisms of execution3-6, ferroptosis is thought to result from the accumulation of unrepaired cell damage1. Previous studies have suggested that ferroptosis has the ability to spread through cell populations in a wave-like manner, resulting in a distinct spatiotemporal pattern of cell death7,8. Here we investigate the mechanism of ferroptosis execution and discover that ferroptotic cell rupture is mediated by plasma membrane pores, similarly to cell lysis in pyroptosis and necroptosis3,4. We further find that intercellular propagation of death occurs following treatment with some ferroptosis-inducing agents, including erastin2,9 and C' dot nanoparticles8, but not upon direct inhibition of the ferroptosis-inhibiting enzyme glutathione peroxidase 4 (GPX4)10. Propagation of a ferroptosis-inducing signal occurs upstream of cell rupture and involves the spreading of a cell swelling effect through cell populations in a lipid peroxide- and iron-dependent manner.


Conflict of interest statement

Competing Interests

Memorial Sloan-Kettering Cancer Center and three investigators involved in this study (M.S.B., U.W., and M.O.) have financial interests in Elucida Oncology, Inc. Research involving C’ dots may involve one or more U.S. or international patent applications.

Figures

Extended Data Fig. 1
Extended Data Fig. 1. Treatment of cells with FAC and BSO induces ferroptosis.
(a) Viability of HAP1 cells after treatment with FAC and BSO and either DMSO or ferroptosis inhibitors as measured by crystal violet staining. N = three independent experiments. Dunnett’s test; **p=0.0024 for Lip-1; **p=0.0045 for Fer-1; *p=0.0107 for Trolox. (b) Confocal images of HAP1 cells treated with FAC and BSO and stained with C11-BODIPY581/591. Non-oxidized probe is shown in red, oxidized probe is shown in green (arrow). Scale bar = 10μm. Images are representative of three independent experiments. (c) Values from the analysis of the experiment shown in panels 1c and d. Note that the experimental mean time difference between neighbors (μexpΔt) is much smaller than the mean (μpermΔt) and 95th percentile (μpermΔt) obtained from the randomly permuted data. (d) Spatiotemporal distribution of cell death in HAP1 cells treated with ML162 to induce ferroptosis. Each dot represents a cell from a single movie representative of five fields of view from one experiment. Colors indicate relative times of cell death as determined by SYTOX Green staining. (e) Distribution of experimental time differences between neighboring deaths in blue and averaged distribution of the corresponding permuted data in orange. Data belong to the experiment shown in panel d and are representative of five fields of view from one experiment. Statistical source data can be found at Source data Extended Data Figure 1.
Figure 1
Figure 1
Ferroptosis exhibits non-random spatiotemporal patterns. (a) B16F10 cells treated with C’ dot nanoparticles in amino acid-free (-AA) media to induce ferroptosis. Images show DIC and SYTOX Green; SYTOX-positive cells are dead. Scale bar = 20μm. Images are representative of five movies from one experiment. (b) Nuclei of ferroptotic cells in panel a, pseudocolored to indicate relative timing of cell death, as determined by time-lapse microscopy. See Supplementary Video 1. (c) Schematic summarizing our method to quantify cell death patterns. Images from time-lapse microscopy (left) are processed to determine relative timing of neighboring cell deaths (top right image, “experiment”) versus permuted trials (bottom right image, “permutation”) to detect potential non-random patterns. Images match insets in panels a and b. Scale bar = 10μm (d) Distribution of time differences between neighboring deaths (Δt) from experiment in panels a-c shown in blue, versus averaged distribution of the set of random permutations shown in orange. Graph shows fraction of total deaths with given time differences.. (e) Spatiotemporal distribution of apoptosis in MCF10A cells treated with TRAIL. Each dot represents a cell; colors indicate relative times of cell death as determined by cell morphology. Data are representative of five fields of view from one experiment. (f) Distribution of experimental time differences between neighboring deaths (Δt) in blue and averaged distribution of Δts from the corresponding permuted data in orange. Data belong to the experiment shown in panel e. (g) Ferroptosis, apoptosis, and H2O2-induced necrosis show non-random spatiotemporal patterns. Graph shows μexpΔt vs. μperm95Δt of different cell lines undergoing ferroptosis induced by the indicated treatment (FB = FAC+BSO), apoptosis induced with TRAIL, or necrosis induced with H2O2. Dashed line indicates μexpΔt = μperm95Δt. Each data point represents one movie. Data are from two independent experiments for MCF7+H2O2 and one experiment for all other conditions. (h) Spatial Propagation Index generated from data in panel e.
Figure 2
Figure 2
Ferroptosis spreading requires lipid peroxidation and iron and involves cell swelling. (a) Distance of ferroptosis spreading in HAP1 cells incubated with FAC and BSO, and treated with Liproxstatin-1 (Lip-1), Deferoxamine (DFO), or DMSO control after wave initiation. Distance was quantified 2h after drug addition. N = three independent experiments, averaged across three or four microscopic fields of view per replicate. Dunnett’s test; ***p=0.0008, **p=0.001. (b-d) Representative images from experiments quantified in panel a. Timing of treatment with DMSO (b), Lip-1 (c), or DFO (d) is indicated as 0h. Images show DIC and SYTOX Green fluorescence. Death waves are indicated by an arrow and a red border, live cells are indicated with a blue border on each image. Note Lip-1 and DFO-treated cells are shown 9 hours after treatment (+9h), versus 2 hours after treatment for DMSO (+2h). See Supplementary Video 3. (e) HAP1 cells treated with FAC and BSO round prior to ferroptotic cell rupture (arrowhead). Images are representative of four independent experiments. (f) The cell swelling marker cPLA2-mKate translocates to the nuclear envelope (arrowhead) prior to SYTOX Green labeling in HeLa cells treated with FAC and BSO. See Supplementary Video 4. Images are representative of two independent experiments. All scale bars = 10μm. Statistical source data can be found at Source data figure 2.
Figure 3
Figure 3
Ferroptotic cell rupture is inhibited by osmoprotectants. (a) Percent lactate dehydrogenase (LDH) released from ferroptotic HeLa cells treated with FAC and BSO and the indicated osmoprotectants: sucrose, raffinose, PEG1450, and PEG3350. Images show DIC and Sytox Green fluorescence for Hela cells treated with FAC + BSO in the presence or absence of PEG3350. Scale bar = 10μm. Diameters of osmoprotectants are shown in the table. N=5 biologically independent experiments. Dunnett’s test; ***p=0.0001, ****p=0.0001. (b) Swelling of ferroptotic HeLa cells treated with FAC and BSO as measured by recruitment of cPLA2-mKate to the nuclear envelope, determined by time-lapse microscopy. N=4 biologically independent experiments. Dunnett’s test; *p=0.0318, ***p=0.0002. (c) LDH release by HeLa cells treated with H2O2 and the indicated osmoprotectants, relative to HeLa cells treated with H2O2 only. N=3 biologically independent experiments. Dunnett’s test; all comparisons not significant. Raffinose: p=0.307, PEG1450: p=0.9999, PEG3350: p=0.7764. (d, e) LDH release in HT1080 cells treated with H2O2, RSL3, or erastin and HAP1 cells treated with ML162 or FAC and BSO and the indicated osmoprotectants, relative to the treatment alone. N=6 (RSL3 and erastin), 3 (H2O2 and ML162), or 5 (FAC + BSO) biologically independent experiments. Dunnett’s test; RSL3+PEG1450: p=0.0067, erastin+PEG1450: p=0.0001, RSL3+PEG3350: p=0.0001, erastin+PEG3350: p=0.0001, ML162+PEG1450: p=0.003, FAC&BSO+PEG1450: p=0.0001, ML162+PEG3350: p=0.0048, FAC&BSO+PEG3350: p=0.0001. Statistical source data can be found at Source data figure 3.
Figure 4
Figure 4
Ferroptosis spreading involves calcium flux and does not require cell rupture. (a) Images show spreading of GCaMP fluorescence (green) prior to cell rupture marked by SYTOX Orange (red) in HAP1 cells treated with FAC and BSO. Dashed circles show origin of death spreading. Note that cells lose GCaMP fluorescence upon cell rupture, likely due to GCaMP efflux. See Supplementary Video 6. Images are representative of three independent experiments. (b) Correlation between relative timing of GCaMP fluorescence and SYTOX labeling in HAP1 cells treated with FAC and BSO. Each dot represents a cell and each color represents a different field of view. Data from one experiment.. (c) Images show spreading of GCaMP fluorescence (green) and SYTOX Orange (red) in HAP1 cells treated with FAC and BSO and PEG1450. Dashed circles show origin of death spreading. Note that PEG1450-treated cells maintain GCaMP fluorescence and do not label with SYTOX Orange, unlike control cells in panel a. See Supplementary Video 7. Images are representative of three independent experiments. (d) Graph showing μexpΔt vs. μperm95Δt of movies of HAP1 cells treated with FAC and BSO and the indicated osmoprotectants, analyzed using GCaMP fluorescence. Dashed line indicates μexpΔt = μperm95Δt. Each data point represents one movie. Data are from one experiment. (e) Spatial Propagation Index calculated for experiments shown in panel d. All scale bars = 10μm. Statistical source data can be found at Source data figure 4.
Figure 5
Figure 5
PEG3350 slows ferroptosis propagation (a) Wave-like spreading of ferroptosis in U937 cells treated with FAC and BSO, imaged by DIC microscopy. Arrows indicate direction of wave spreading; inset shows boundary between live and dead cells. See Supplementary Video 8. Image is representative of four independent experiments. Scale bar = 10μm (b) Percent LDH release in U937 cells treated with FAC and BSO in control and PEG3350-treated conditions. Data are from four biological replicates. **p=0.004 and was obtained using a two-sided t-test. (c) Wave-like spreading of ferroptosis is slower in the presence of PEG3350. Inset shows a representative example of death progression at each time point indicated by yellow lines. Graph shows distance over time of wave spreading in U937 cells treated with FAC and BSO. Data points indicate means from five independent waves per condition; error bars represent SD; line shows linear regression and its 95% confidence interval (shaded regions). Scale bar = 25μm. (d) Model for osmotic regulation of ferroptosis and cell death propagation. Ferroptosis induction involves the opening of plasma membrane pores that allow for solute exchange with the external environment, leading to cell swelling that occurs priors to cell death and is marked by cPLA2 translocation to the nuclear membrane (red). After swelling, ferroptotic cells undergo rupture and death marked by the rapid influx of death-indicating dyes such as Sytox Green. When ferroptosis is induced by treatment with erastin, C’ dots, or FAC and BSO, but not by treatment with the GPX4 inhibitor ML162, death propagates to neighboring cells in an iron and lipid peroxide-dependent manner, through a signal that is sent independently of cell rupture. Statistical source data can be found at Source data figure 5.

Comment in

Similar articles

Cited by

References

    1. Stockwell BR et al. Ferroptosis: A Regulated Cell Death Nexus Linking Metabolism, Redox Biology, and Disease. Cell 171, 273–285 (2017). - PMC - PubMed
    1. Dixon SJ et al. Ferroptosis: an iron-dependent form of nonapoptotic cell death. Cell 149, 1060–1072 (2012). - PMC - PubMed
    1. Ros U et al. Necroptosis Execution Is Mediated by Plasma Membrane Nanopores Independent of Calcium. Cell Rep 19, 175–187 (2017). - PMC - PubMed
    1. Fink SL & Cookson BT Caspase-1-dependent pore formation during pyroptosis leads to osmotic lysis of infected host macrophages. Cell Microbiol 8, 1812–1825 (2006). - PubMed
    1. Degterev A et al. Chemical inhibitor of nonapoptotic cell death with therapeutic potential for ischemic brain injury. Nat Chem Biol 1, 112–119 (2005). - PubMed

Publication types

Substances