. 2021 Feb;39(2):186-197.
doi: 10.1038/s41587-020-0651-8. Epub 2020 Aug 31.

Single-cell metabolic profiling of human cytotoxic T cells

Affiliations

Single-cell metabolic profiling of human cytotoxic T cells

Felix J Hartmann et al. Nat Biotechnol. 2021 Feb.

Abstract

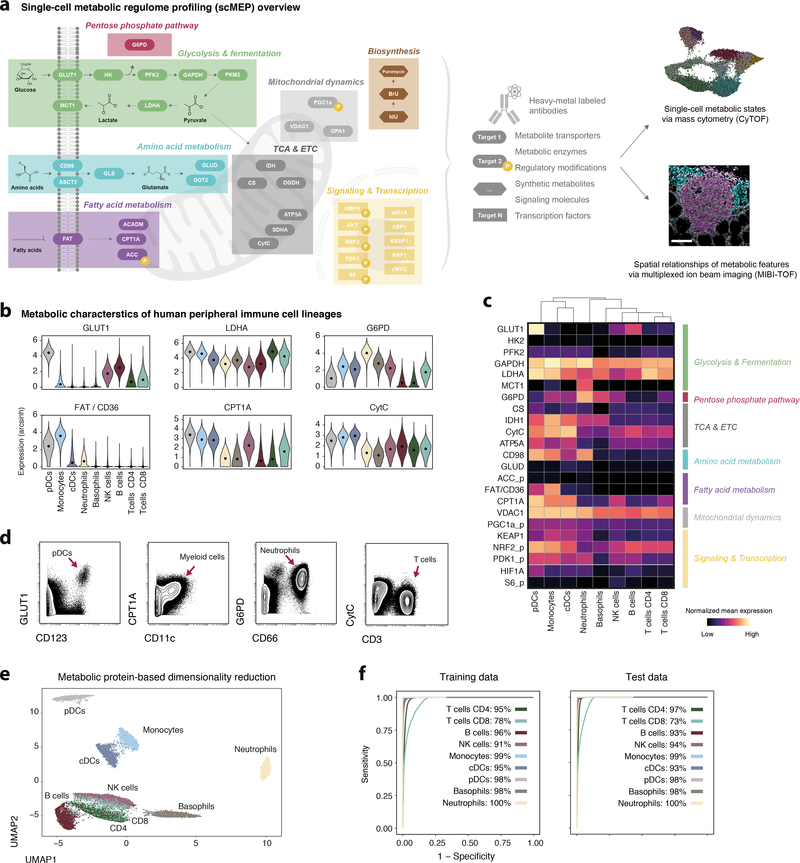
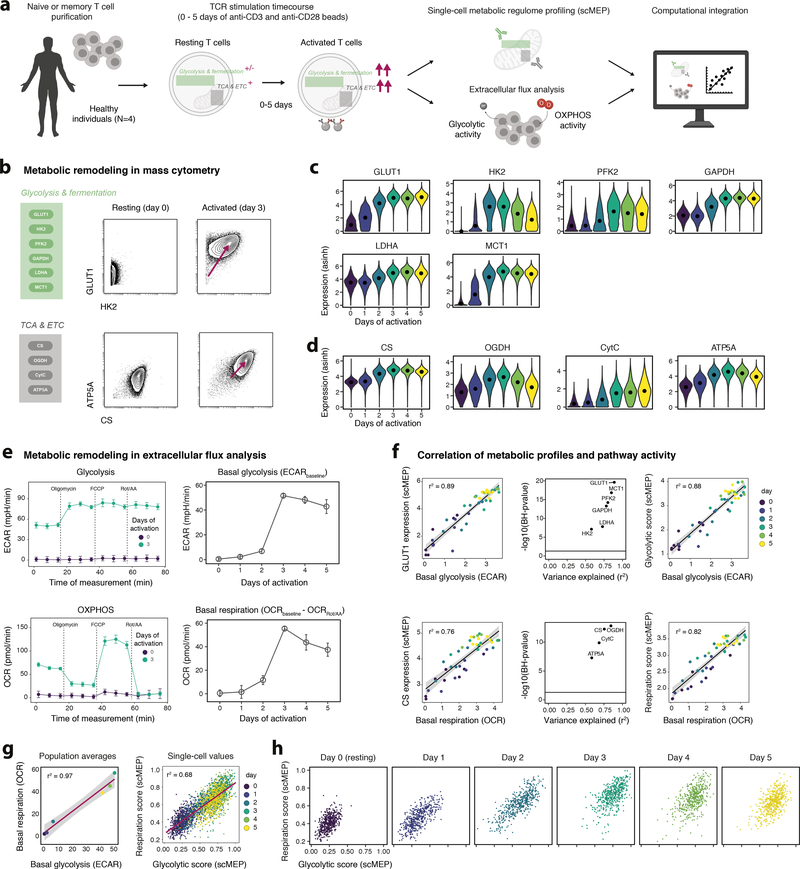
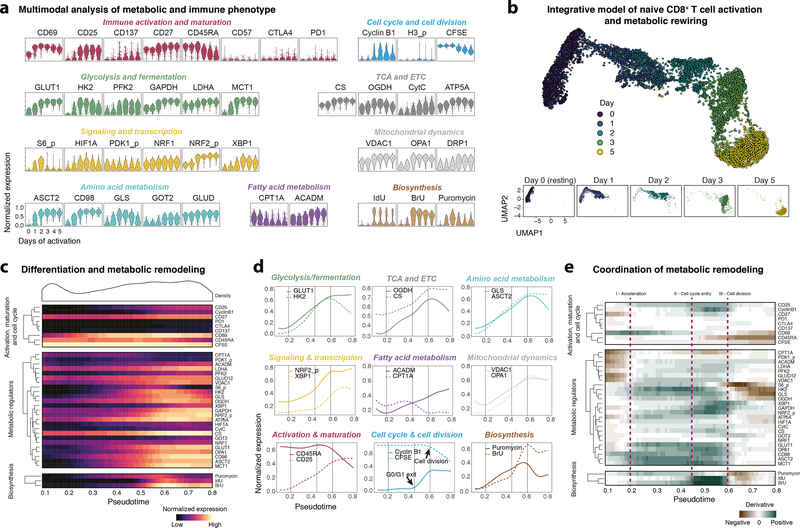
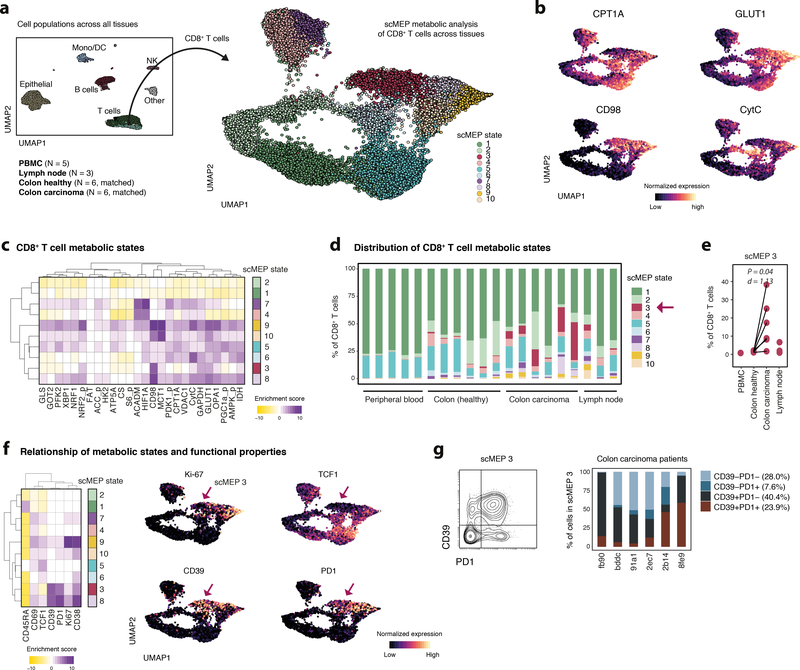
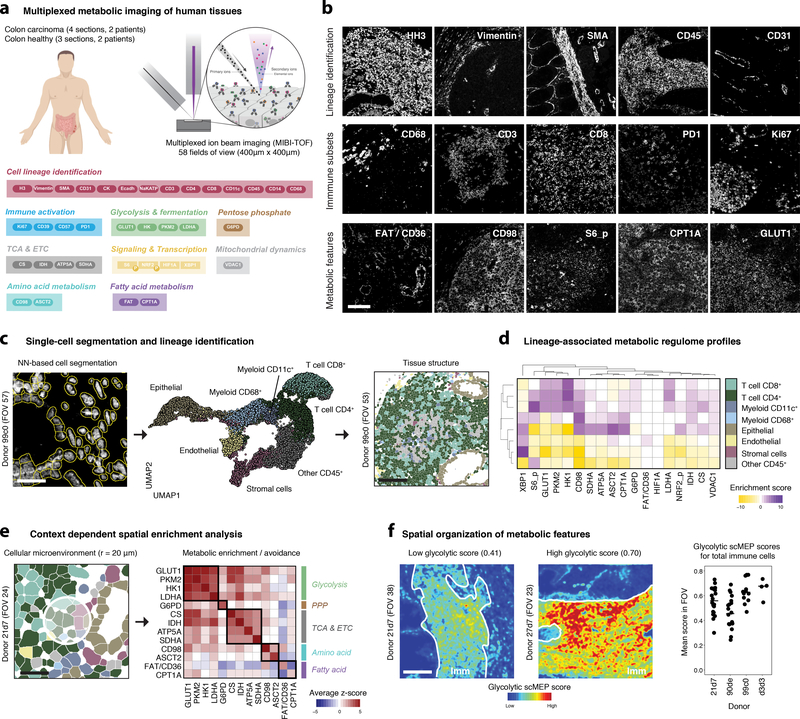
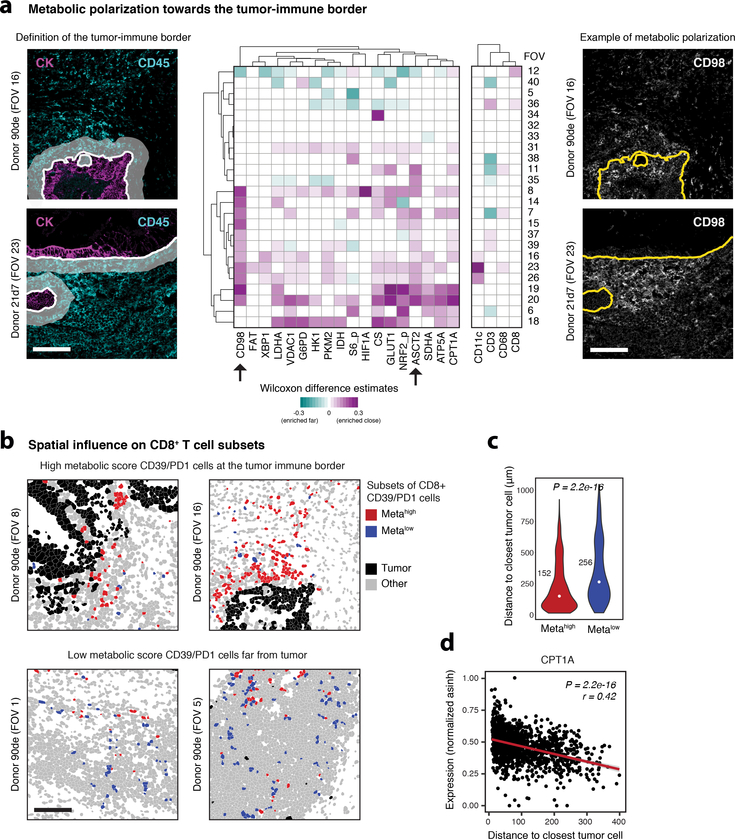
Cellular metabolism regulates immune cell activation, differentiation and effector functions, but current metabolic approaches lack single-cell resolution and simultaneous characterization of cellular phenotype. In this study, we developed an approach to characterize the metabolic regulome of single cells together with their phenotypic identity. The method, termed single-cell metabolic regulome profiling (scMEP), quantifies proteins that regulate metabolic pathway activity using high-dimensional antibody-based technologies. We employed mass cytometry (cytometry by time of flight, CyTOF) to benchmark scMEP against bulk metabolic assays by reconstructing the metabolic remodeling of in vitro-activated naive and memory CD8+ T cells. We applied the approach to clinical samples and identified tissue-restricted, metabolically repressed cytotoxic T cells in human colorectal carcinoma. Combining our method with multiplexed ion beam imaging by time of flight (MIBI-TOF), we uncovered the spatial organization of metabolic programs in human tissues, which indicated exclusion of metabolically repressed immune cells from the tumor-immune boundary. Overall, our approach enables robust approximation of metabolic and functional states in individual cells.


Conflict of interest statement

Declaration of Interests

The authors declare no competing interest.

Figures

Fig. 1:
Fig. 1:. Single-cell metabolic regulomes organize the human immune system.
a, Conceptual overview of the scMEP approach. Important regulators of metabolic activity were identified and respective antibodies were conjugated to heavy-metal isotopes for their use in mass cytometry (CyTOF) and MIBI-TOF. For a full account of all probes tested in this study see Supplementary Table 1. Scale bar = 100 μm. b, Whole blood of healthy individuals (N = 5, for donor characteristics see Supplementary Table 2) was fixed and stained with an antibody panel of 23 metabolic and 22 immunological antibodies. Cell populations were identified through FlowSOM clustering (Supplementary Figure 2a,b) and annotated into the major immune cell lineages. Shown are examples of (asinh transformed) expression values across identified peripheral immune cell lineages. Black dots represent population medians. c, Normalized (99.9th percentile) mean expression of all assessed metabolic regulators across immune cell lineages. d, Examples of metabolic regulator expression across immune cell lineages. Shown are live, single, CD45+ cells of one representative individual. e, Cells from all five donors were subsampled for equal representation of all immune cell lineages and all donors. Only metabolic regulators (23 features) were used as input data to the UMAP-based dimensionality reduction. Cells are colored by their lineage identity determined as in b. f, L1 regularized linear regression (using only metabolic features) was trained on a subset of donors (N = 3) and tested on a separate set of donors (N = 2). Stated numbers report balanced accuracy for the indicated population.
Fig. 2:
Fig. 2:. Single-cell metabolic regulome profiles of T cell activation dynamics.
a, Experimental setup to benchmark scMEP mass cytometry analysis with bulk metabolic analysis by extracellular flux analysis (Seahorse). b, Examples of mass cytometry-quantified expression levels of glycolytic (top) and TCA/ETC (bottom) enzymes following no (resting, left) and 3 days (right) of activation of naïve T cells. Examples show data of one representative experiment (out of N = 4 independent experiments). c, Expression levels of important determinants of glycolysis on naïve CD8+ T cells. Black dots indicate population medians. d, Expression levels of TCA/ETC components on naïve CD8+ T cells as in c. e, Extracellular flux analysis of bulk cell populations from the same donor as in a-c. Extracellular acidification rate (ECAR; top) and oxygen consumption rate (OCR; bottom) for each measurement following injections of mitochondrial modifiers. FCCP = fluoro-carbonyl cynade phenylhydrazon, Rot = Rotenone, AA = antimycin A. Shown is data from one individual (out of N = 4 independent experiments). Circles and error bars represent mean±s.d. for three technical replicates (wells). f, Correlation between glycolytic and oxidative enzymes (left panel) and basal glycolysis (top row) or basal respiration (bottom row). Mass cytometry and extracellular flux analysis values were asinh transformed. Circles represent mean population values for each donor and are based on technical replicates (single cells in mass cytometry and three replicate wells in flux analysis). Black lines and r2 values represent results of a linear regression model, with black shading representing the 95% confidence interval (CI). Log10 of (Benjamini-Hochberg; BH) false discovery rate (FDR)-adjusted P-values and r2 values from linear regression models (middle panel). Black line indicates a BH-corrected P-value of 0.05. Protein-based scMEP scores (right) represent the mean expression of all metabolic enzymes within a pathway. Each circle represents the mean scMEP score of a T cell population (naïve or memory). g, Linear correlation of mean (based on three technical replicates) flux analysis values (left) and single-cell scMEP scores (right) of naïve CD8+ T cell populations, calculated as in f. Shown is data from one individual (out of N = 4 independent experiments). Red lines and r2 values represent results of a linear regression model, with black shading representing the 95% CI. h, scMEP scores as in g, visualized for each day.
Fig. 3:
Fig. 3:. Integrative modeling of metabolic rewiring reveals determinants of human T cell activation.
a, Normalized (99.9th percentile) expression of metabolic and phenotypic proteins by naïve CD8+ T cells across different days of activation. Shown are cells from one representative donor (N = 3 independent donors). Black dots indicate population medians. b, Cells were subsampled for equal representation of the indicated days of activation. Metabolic and other features (with the exception of IdU and H3 phosphorylation) were used as input to UMAP dimensionality reduction and visualization. Cells are colored by their day of activation (top) and shown separately for each day of activation (bottom). c, Cells as in b were used as input to SCORPIUS trajectory inference using the same features as in b. Data was grouped into 100 bins based on pseudotime. Heatmap depicts mean (scaled) expression levels of the indicated feature in the according pseudotime bin. Density (top) shows cell distribution along the pseudotime axis. d, Examples of continuous (smoothed) protein expression along pseudotime, calculated as in c and grouped by metabolic pathway. Vertical lines indicate important inflection points in the trajectory. Inflection points were chosen based on coordinated changes in the slope (see e) across the indicated metabolic regulators and divide T cell metabolic remodeling into distinct stages. e, Slope (first derivative) of protein expression across pseudotime as in c.
Fig. 4:
Fig. 4:. Cytotoxic T cell metabolic states reflect tissue of residence.
Healthy donor PBMC (N = 5), lymph node biopsies (N = 3) as well as single-cell suspensions from colorectal carcinoma (N = 6) and matched adjacent healthy sections (N = 6, see Supplementary Table 2) were barcoded, stained and acquired on a mass cytometer. a, Major cell lineages from all samples and tissues were identified through FlowSOM clustering. UMAP-dimensionality reduction was calculated using subsampled data from all lineages and all available features. Cells are colored by their FlowSOM-based lineage definition (left). Total CD8+ T cells from all samples were selected and metabolic regulators were used to define 10 scMEP states using FlowSOM. UMAP-dimensionality reduction was calculated using subsampled data and only metabolic features. Cells are colored by their scMEP state (right). b, UMAP visualization of CD8+ T cell scMEP states as in a, colored by normalized expression of the indicated metabolic proteins. c, Marker enrichment modeling (MEM) was used to visualize enrichment (purple) or depletion (yellow) of metabolic protein expression across CD8+ T cell scMEP states. d, Frequencies of scMEP states across individual samples. e, Statistical comparison of scMEP state frequencies (see also Supplementary Figure 9f). P-values were calculated using a two-sided, paired t-test between healthy and malignant colon sections from the same patient. Welch correction was applied to account for potentially differing variances. Effect size is represented as Cohen’s d. Estimate = −13.8, t-statistic = −2.76, CI −26.7 to −0.97, 5 degrees of freedom, BH FDR = 0.198. f, MEM of immunological markers (not used for metabolic clustering) across scMEP states (left). UMAP visualization as in a,b with cells colored by their normalized expression value of the indicated marker. g, Biaxial representation of cells from scMEP3 pooled from all colorectal carcinoma samples (left). Frequencies of cells within scMEP3, gated as PD1+ and CD39+ across all colorectal carcinoma samples (right).
Fig. 5:
Fig. 5:. Imaging-based scMEP analysis reveals spatial influences on the organization of metabolic features.
a, FFPE colon-sections from colorectal carcinoma patients (N = 2) and healthy controls (N = 2) were stained with a panel of 36 antibodies. A total of 58 fields of view (FOV), each 400 μm by 400 μm, were acquired by MIBI-TOF. b, Exemplary grayscale images of features used for lineage identification (top), immune activation and subsets (middle) and their metabolic characterization (bottom). See also Supplementary Figure 12. Scale bar = 100 μm. c, A pixel-based classifier was applied to automatically identify single-cells within these images (left, scale bar = 25 μm). FlowSOM was used to identify the main cell lineages based on their lineage marker expression values. Single-cell data was projected onto two-dimensions using UMAP and colored by their cell lineage identity (middle). Clustered single-cell data can be mapped back onto the original segmented images to investigate spatial influences (right, scale bar = 100 μm). d, Metabolic regulome profiles of cell lineages as identified in c are represented as MEM scores. e, Cellular microenvironments were defined as cells present within a 20 μm radius (based on cell centroids) of any given index cell. Colors indicate cell lineage as in d (left, scale bar = 25 μm). Within all such groups, spatial enrichments were calculated by comparing the distributions of metabolic protein expression with a random subsampling of the same cell lineage composition. Enrichments (red) and avoidances (blue) are visualized as average z-scores across all FOVs. Black outlines indicate proteins within the same metabolic pathway (right). f, Spatial scMEP scores for a given metabolic pathway were calculated by averaging (and blurring) pixel-based expression values of all metabolic markers within a pathway. Areas of immune cell infiltration were outlined manually based on CD45 staining (left and middle, scale bar = 100 μm). Circles represent mean glycolytic scMEP scores for all CD45+ cells within a FOV (right). Black lines indicate donor means.
Fig. 6:
Fig. 6:. Metabolic polarization at the tumor-immune boundary in human colorectal carcinoma.
a, Immune cells within a 20 μm radius of malignant epithelial cells were classified as located within the tumor-immune border (left, scale bar = 100 μm). Shown is data from all 24 FOVs that contain a tumor-immune boundary. Two-sided Wilcoxon-rank sum test (FDR-corrected using the BH approach to adjust for multiple hypothesis testing) were used to compare cells close to the border with cells further from the border in each FOV that contained cells of both categories. Heatmap shows Wilcoxon rank sum test-based estimates (representing the median of the difference between samples of the two groups) of enrichment for enriched (magenta) and decreased (cyan) expression on immune cells within the border. Non-significant (BH-adjusted P-value > 0.05) estimates were colored white (middle). Exemplary grayscale images of two FOVs showing polarization of CD98 towards the tumor immune border, indicated in yellow. Scale bar = 100 μm (right). b, CD8+ T cells expressing high levels of CD39 and/or PD1 were clustered into two subsets based on their metabolic features (see Supplementary Figure 13). The two subsets (metahigh and metalow) were visualized in the original images (left top and bottom, scale bar = 100 μm). c, Two-sided Wilcoxon rank sum test of distance to closest malignant epithelial cell for CD39/PD1 cells stratified by metabolic phenotype (P = 2.2e-16). Numbers indicate median distance. d, Linear regression between normalized asinh expression of metabolic enzymes (e.g. CPT1A) and distance to closest tumor cell (bottom right). Red line and values indicate linear regression model (P = 2.2e-16).

Comment in

References

    1. Klein Geltink RI, Kyle RL & Pearce EL Unraveling the Complex Interplay Between T Cell Metabolism and Function. Annu. Rev. Immunol 36, 461–488 (2018). - PMC - PubMed
    1. Olenchock BA, Rathmell JC & Vander Heiden MG Biochemical Underpinnings of Immune Cell Metabolic Phenotypes. Immunity 46, 703–713 (2017). - PMC - PubMed
    1. Buck MD, Sowell RT, Kaech SM & Pearce EL Metabolic Instruction of Immunity. Cell 169, 570–586 (2017). - PMC - PubMed
    1. Xu T et al. Metabolic control of TH17 and induced Treg cell balance by an epigenetic mechanism. Nature 548, 228–233 (2017). - PMC - PubMed
    1. Patel CH, Leone RD, Horton MR & Powell JD Targeting metabolism to regulate immune responses in autoimmunity and cancer. Nat. Rev. Drug Discov 18, 669–688 (2019). - PubMed

Methods-only References

    1. Diggins KE, Greenplate AR, Leelatian N, Wogsland CE & Irish JM Characterizing cell subsets using marker enrichment modeling. Nat. Methods 14, 275–278 (2017). - PMC - PubMed
    1. Van den Bossche J et al. Mitochondrial Dysfunction Prevents Repolarization of Inflammatory Macrophages. Cell Rep. 17, 684–696 (2016). - PubMed
    1. Hartmann FJ et al. Scalable Conjugation and Characterization of Immunoglobulins with Stable Mass Isotope Reporters for Single-Cell Mass Cytometry Analysis. Methods Mol. Biol 1989, 55–81 (2019). - PMC - PubMed
    1. Mei HE, Leipold MD & Maecker HT Platinum-conjugated antibodies for application in mass cytometry. Cytom. Part A 89, 292–300 (2016). - PubMed
    1. Hartmann FJ, Simonds EF & Bendall SC A Universal Live Cell Barcoding-Platform for Multiplexed Human Single Cell Analysis. Sci. Rep 8, 10770 (2018). - PMC - PubMed

Publication types

MeSH terms