. 2020 Oct;17(10):991-1001.
doi: 10.1038/s41592-020-0935-4. Epub 2020 Aug 31.

Massively parallel and time-resolved RNA sequencing in single cells with scNT-seq

Affiliations

Massively parallel and time-resolved RNA sequencing in single cells with scNT-seq

Qi Qiu et al. Nat Methods. 2020 Oct.

Abstract

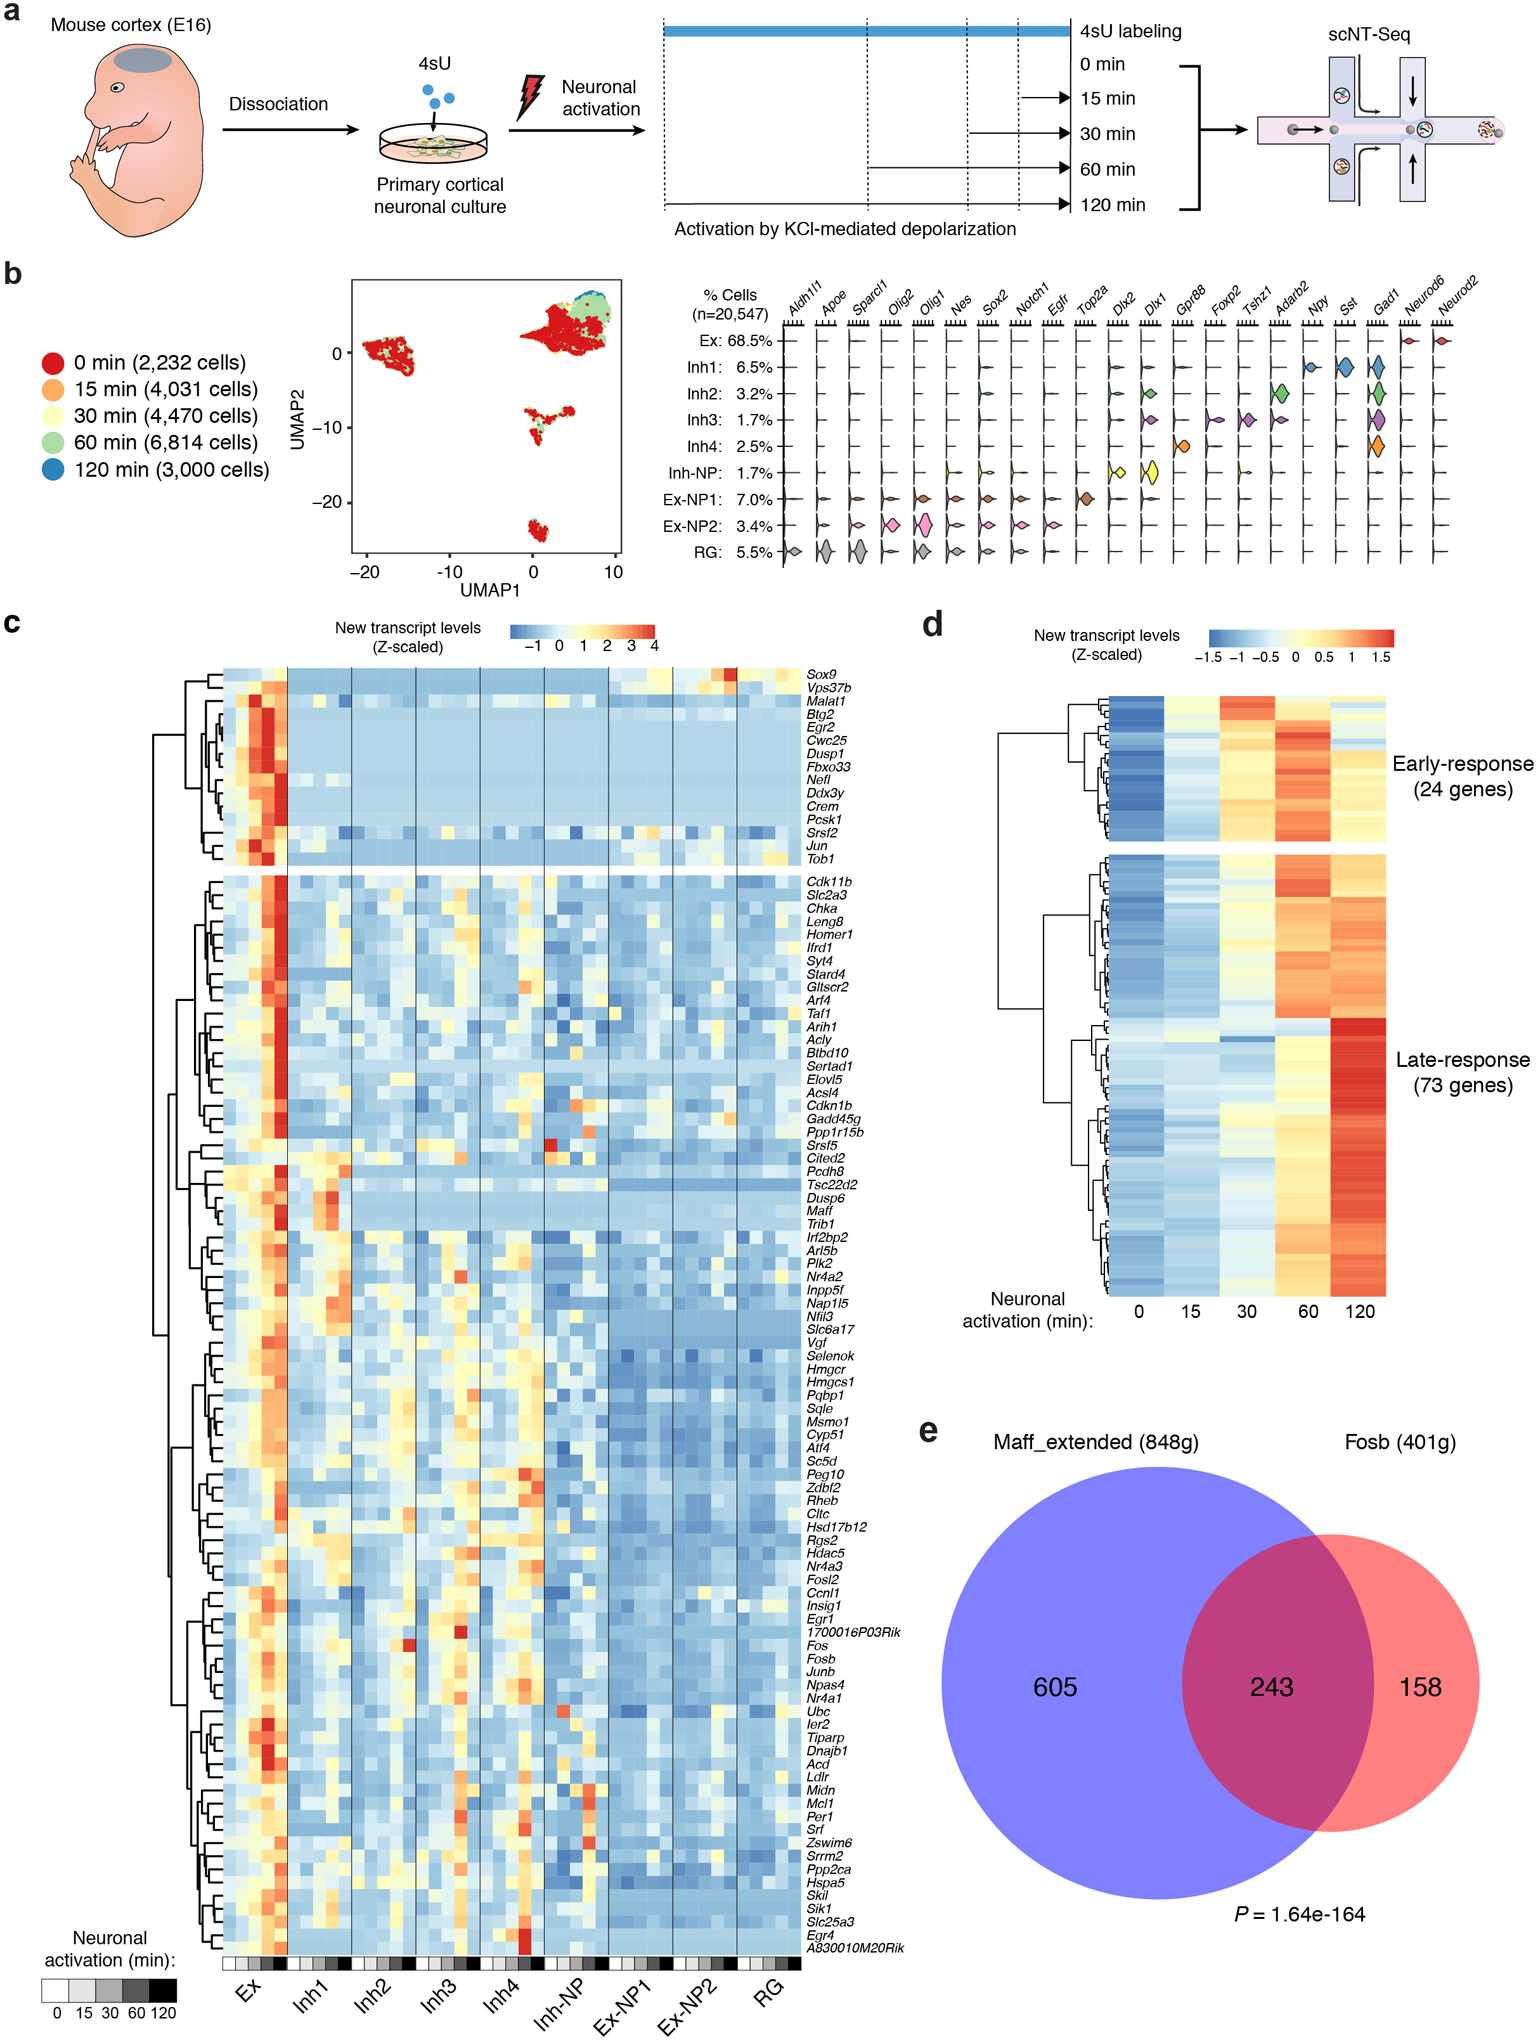
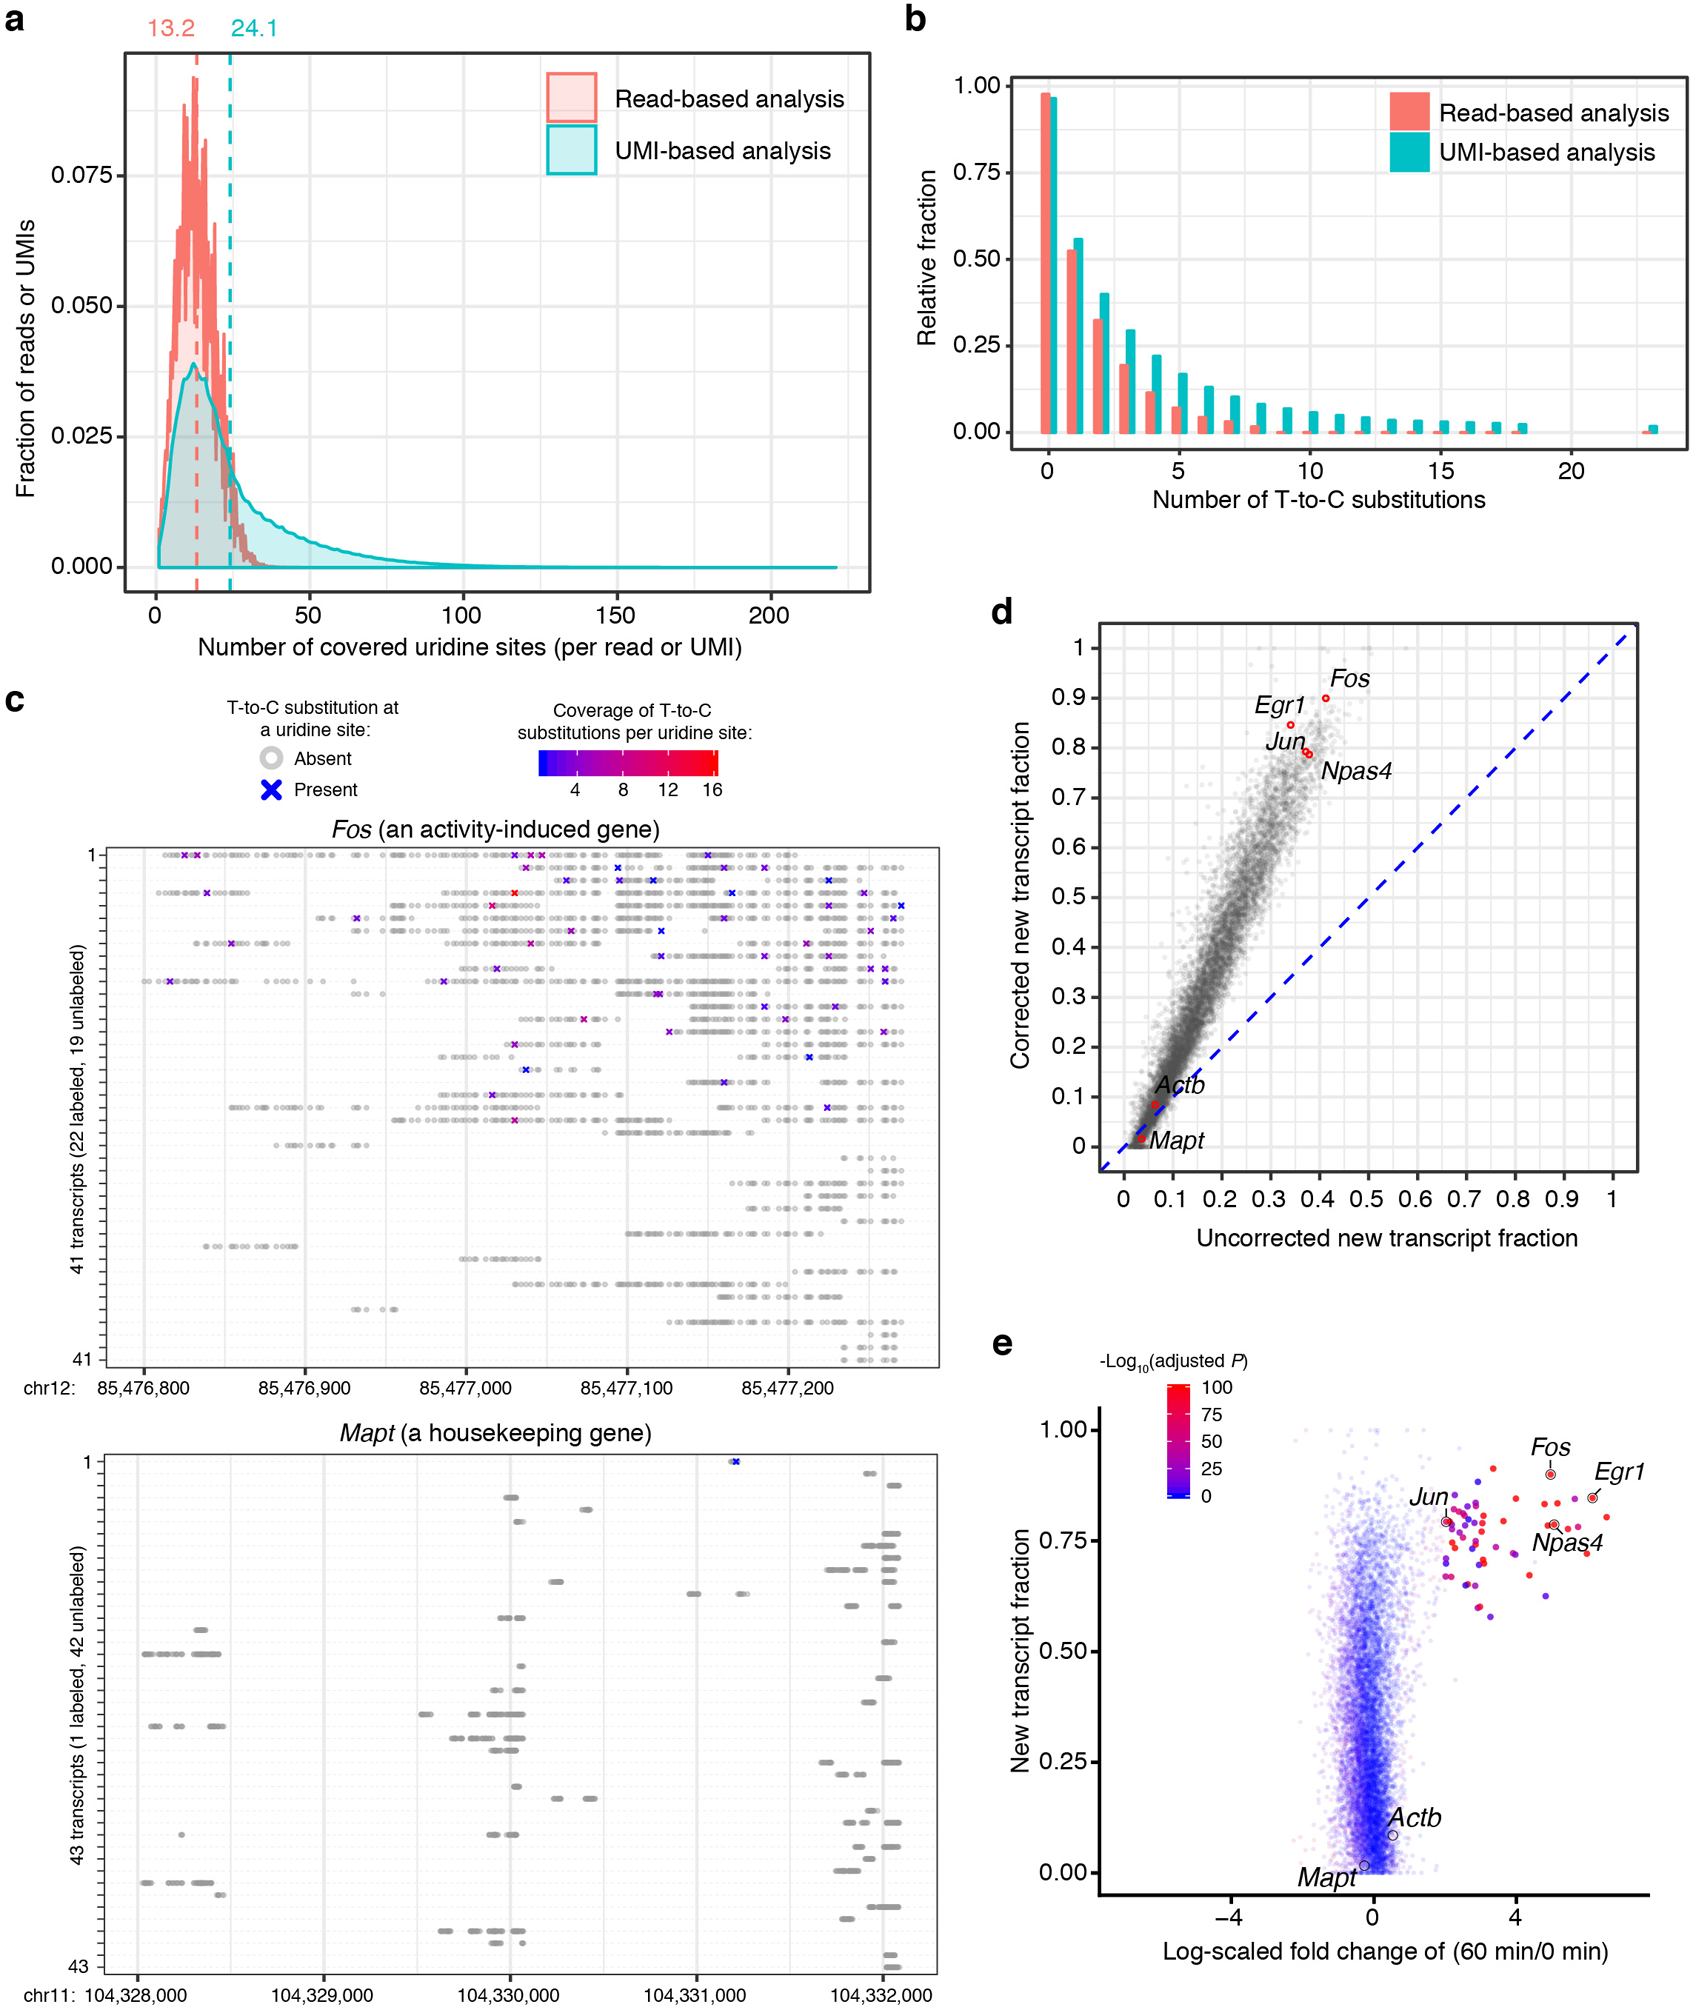
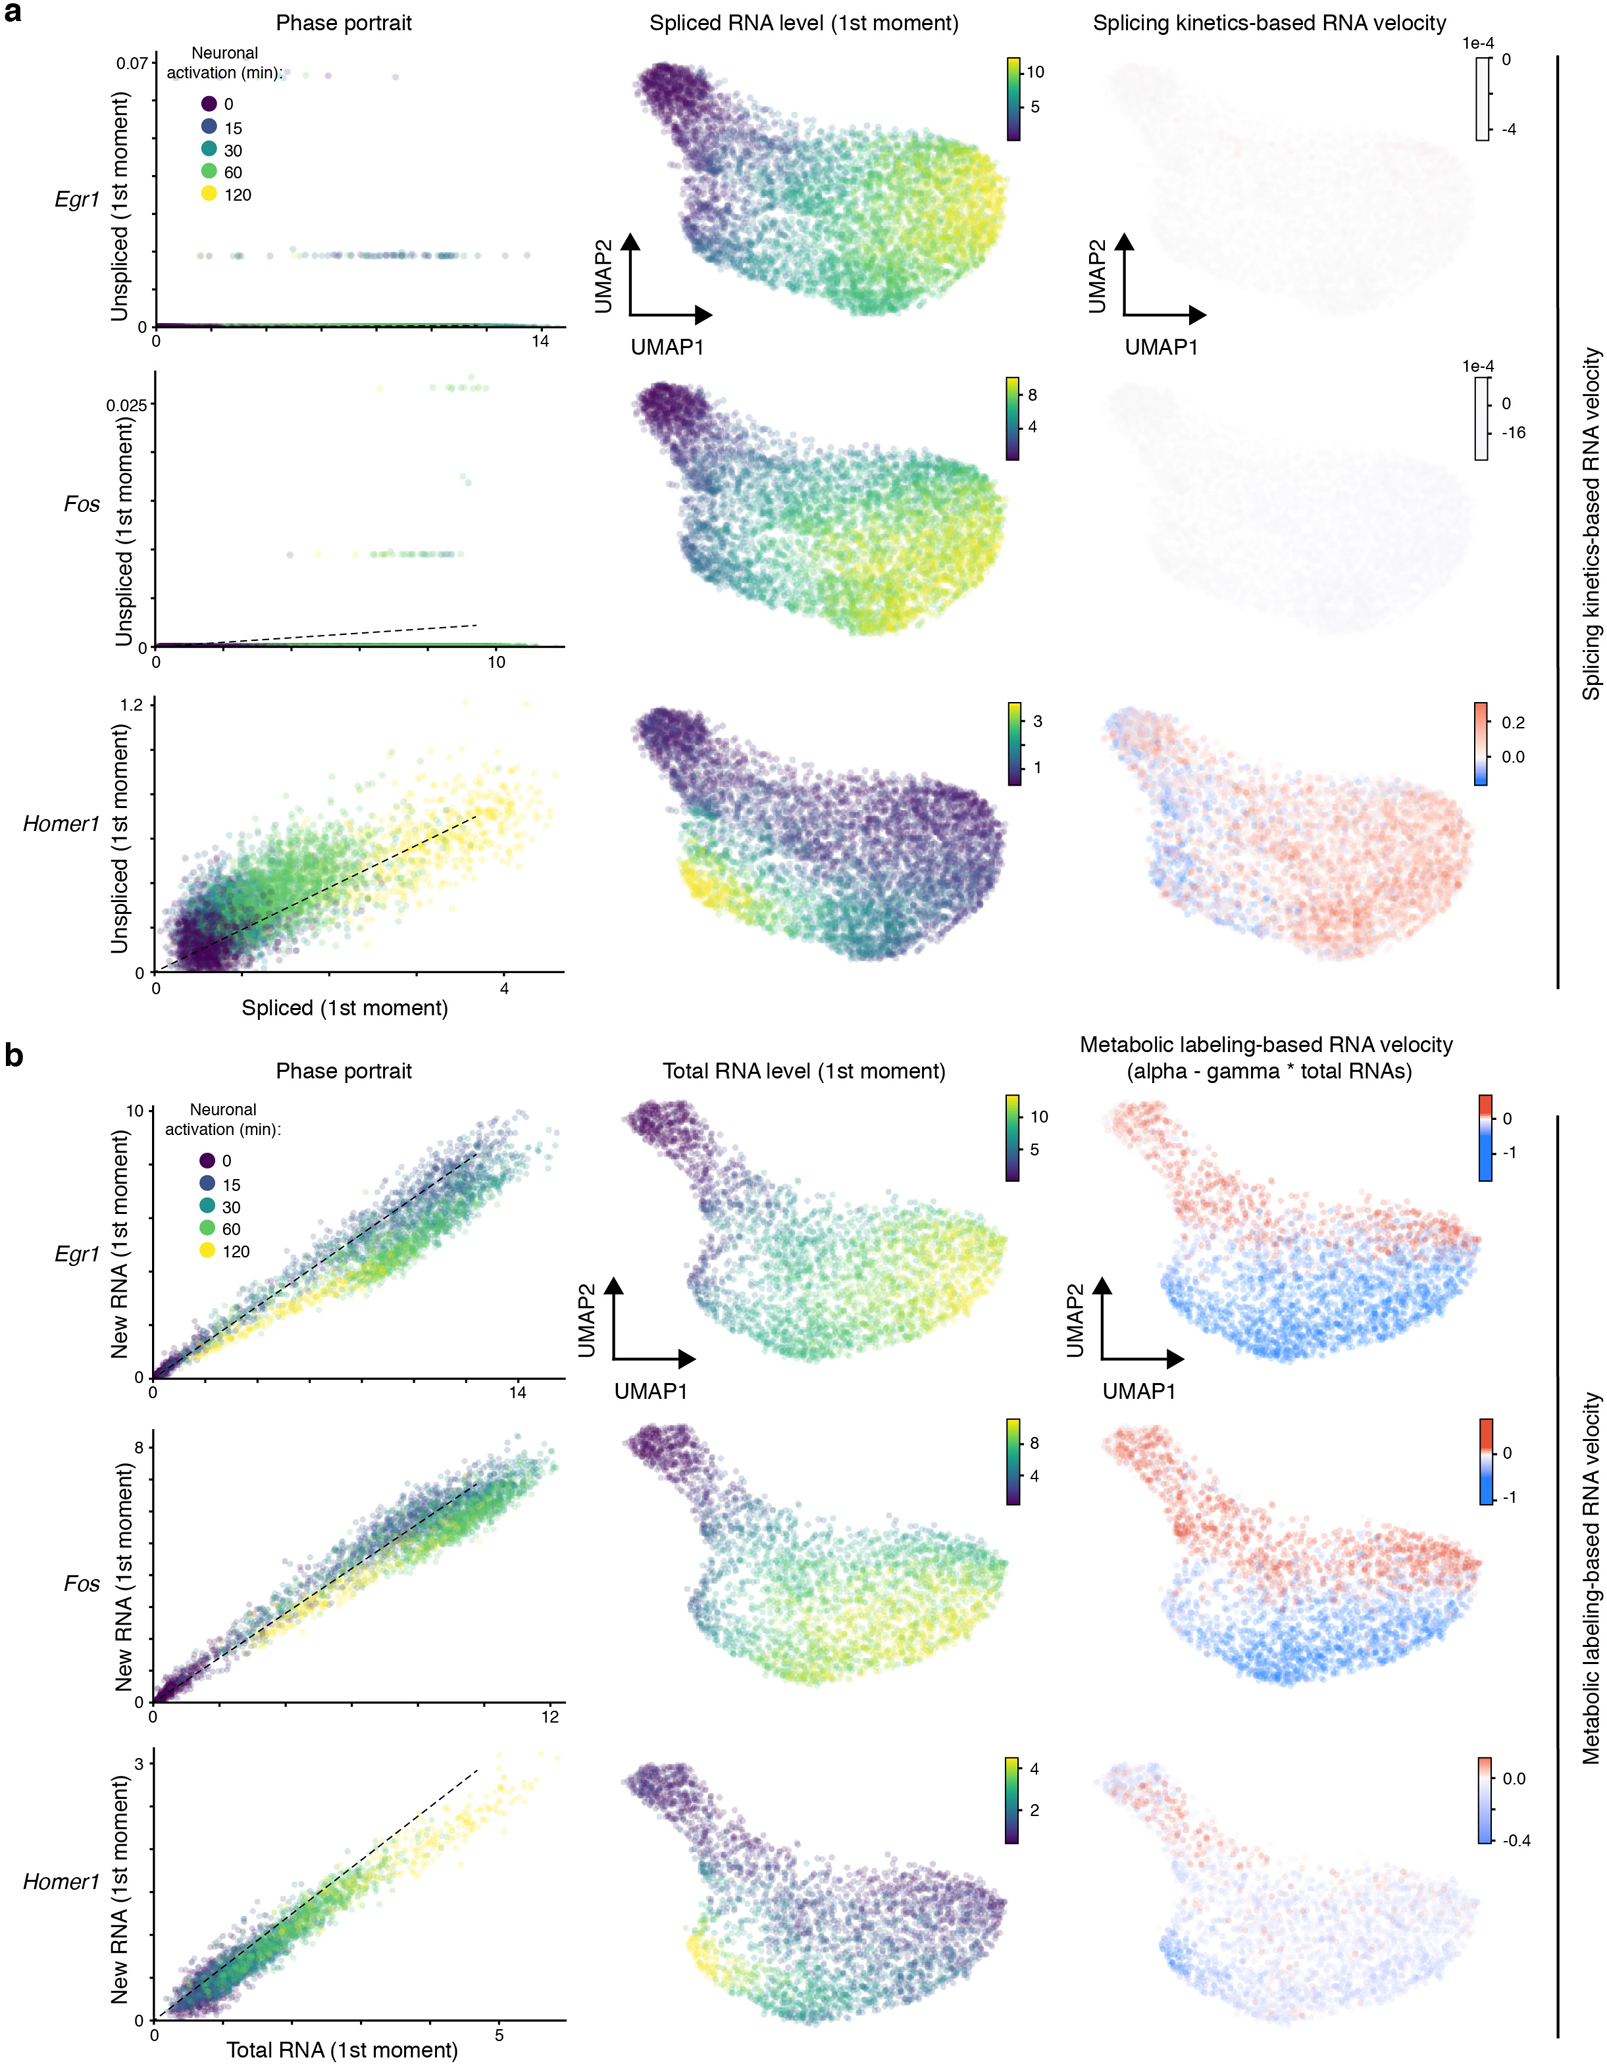
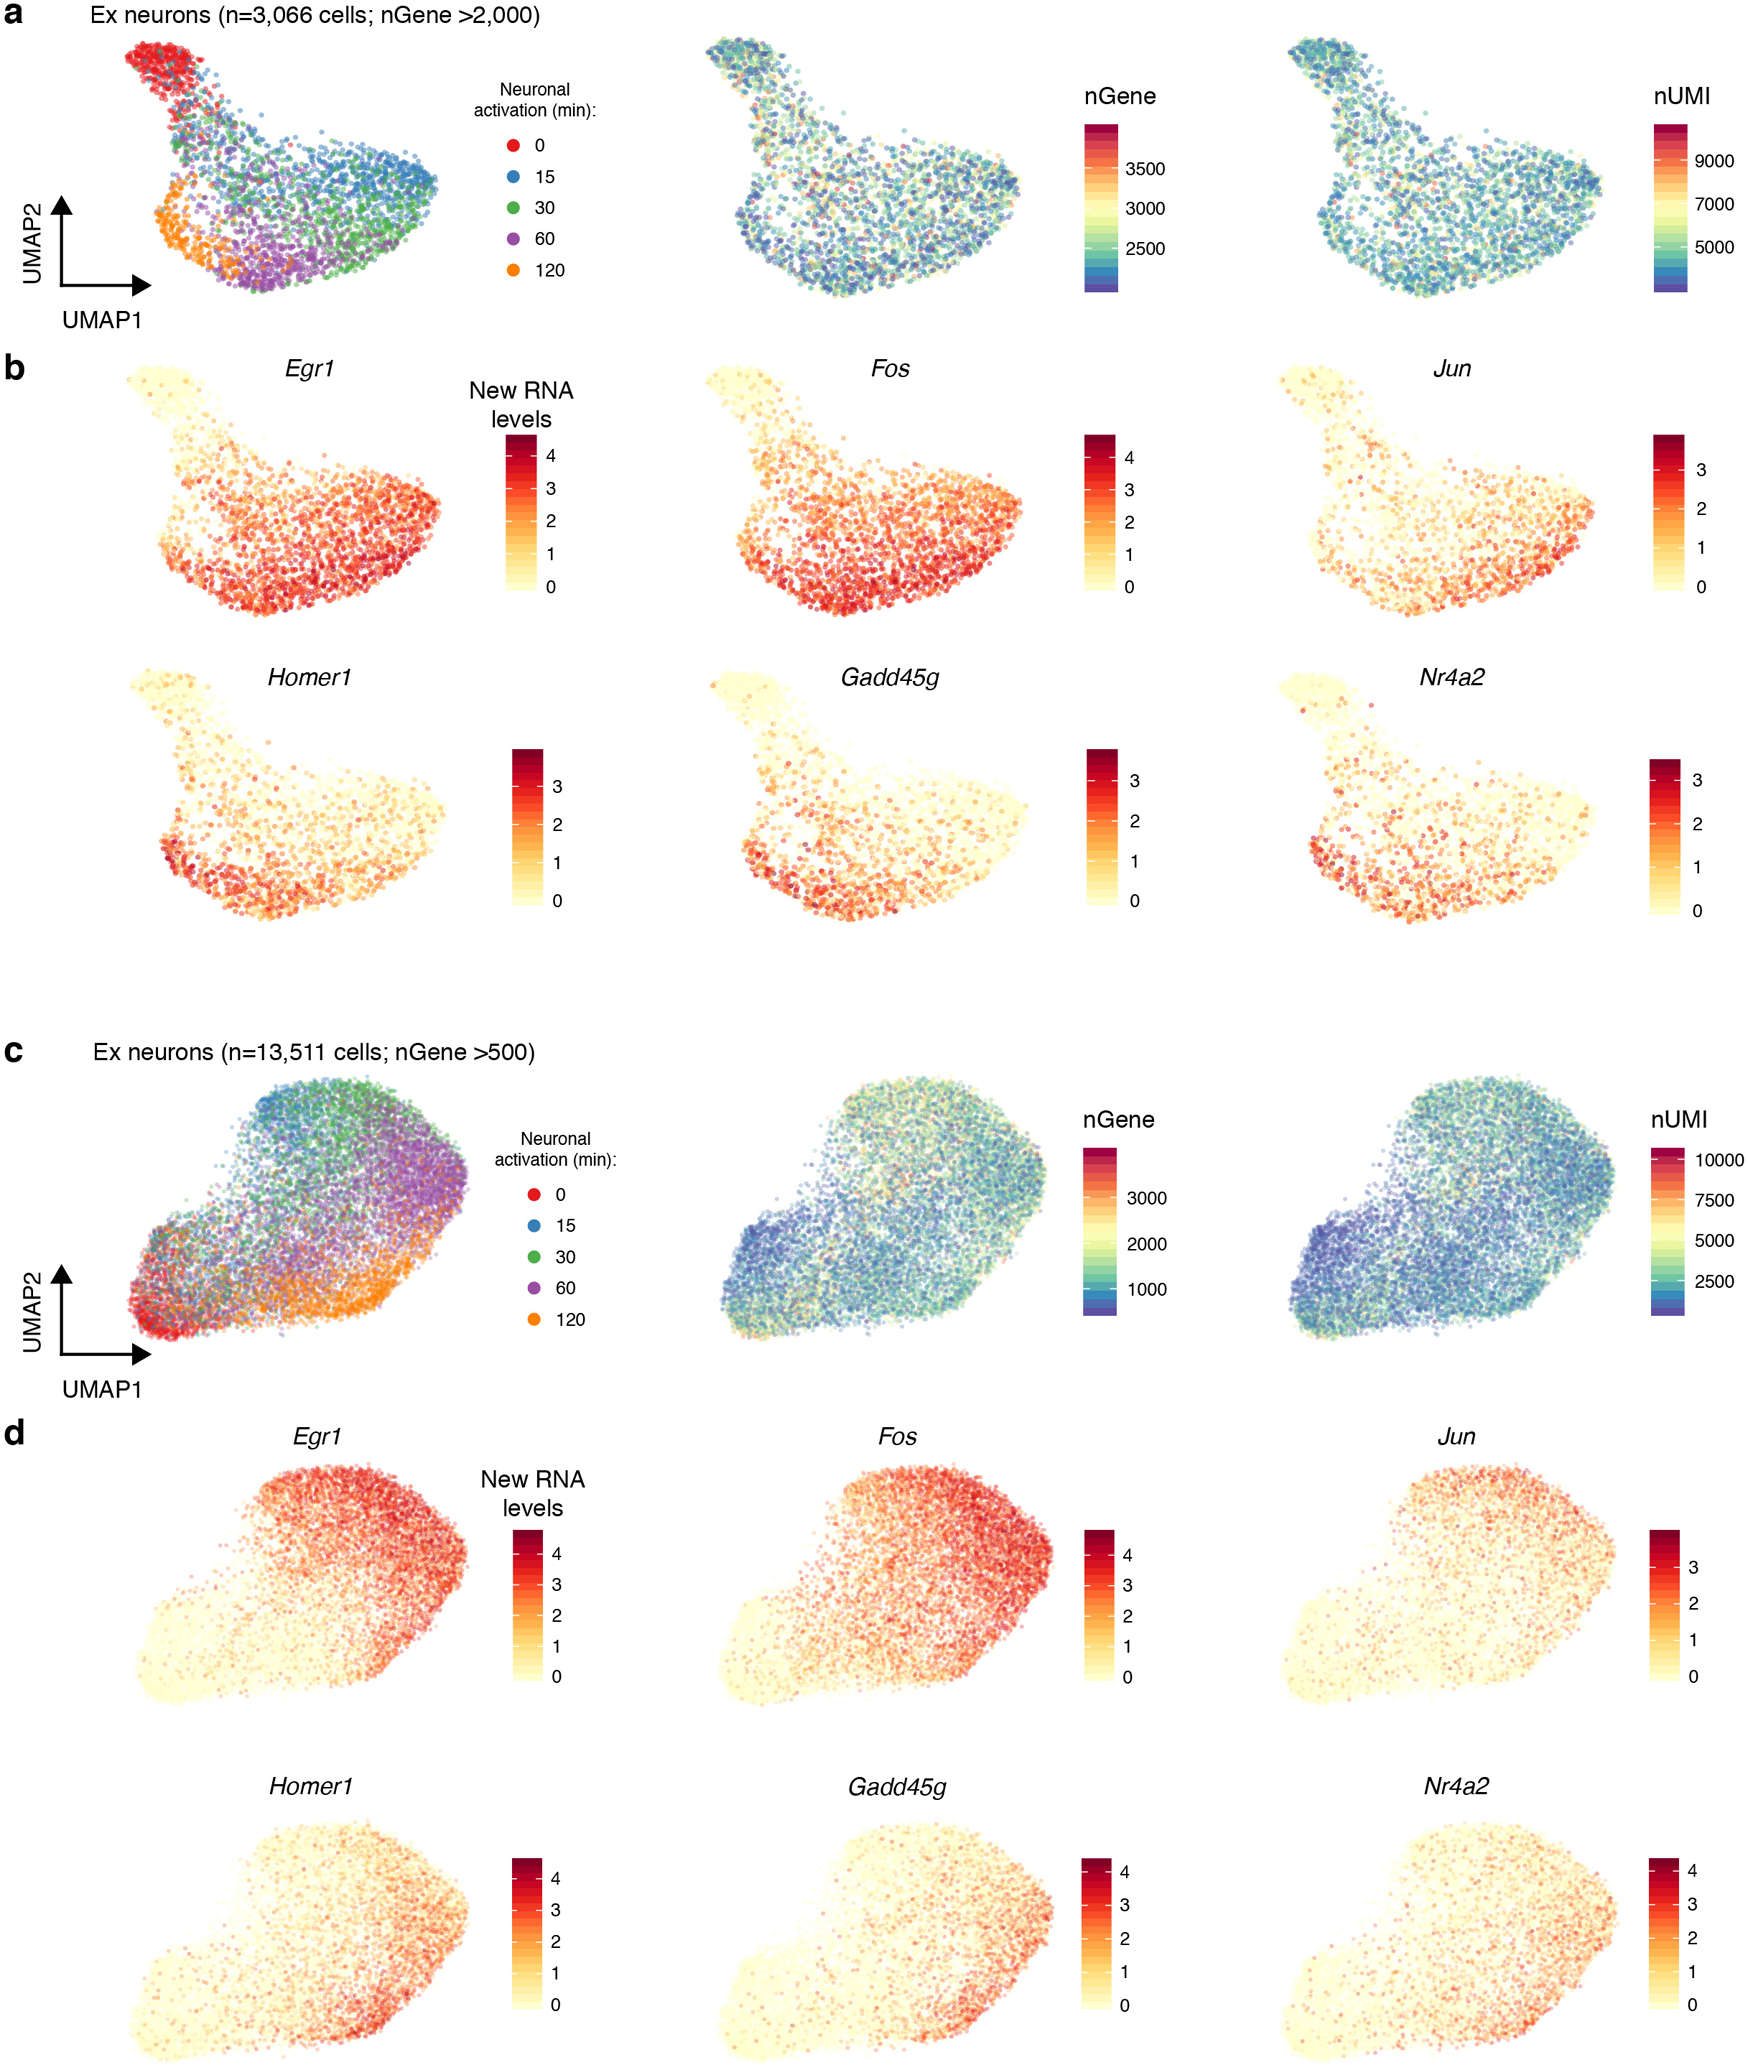
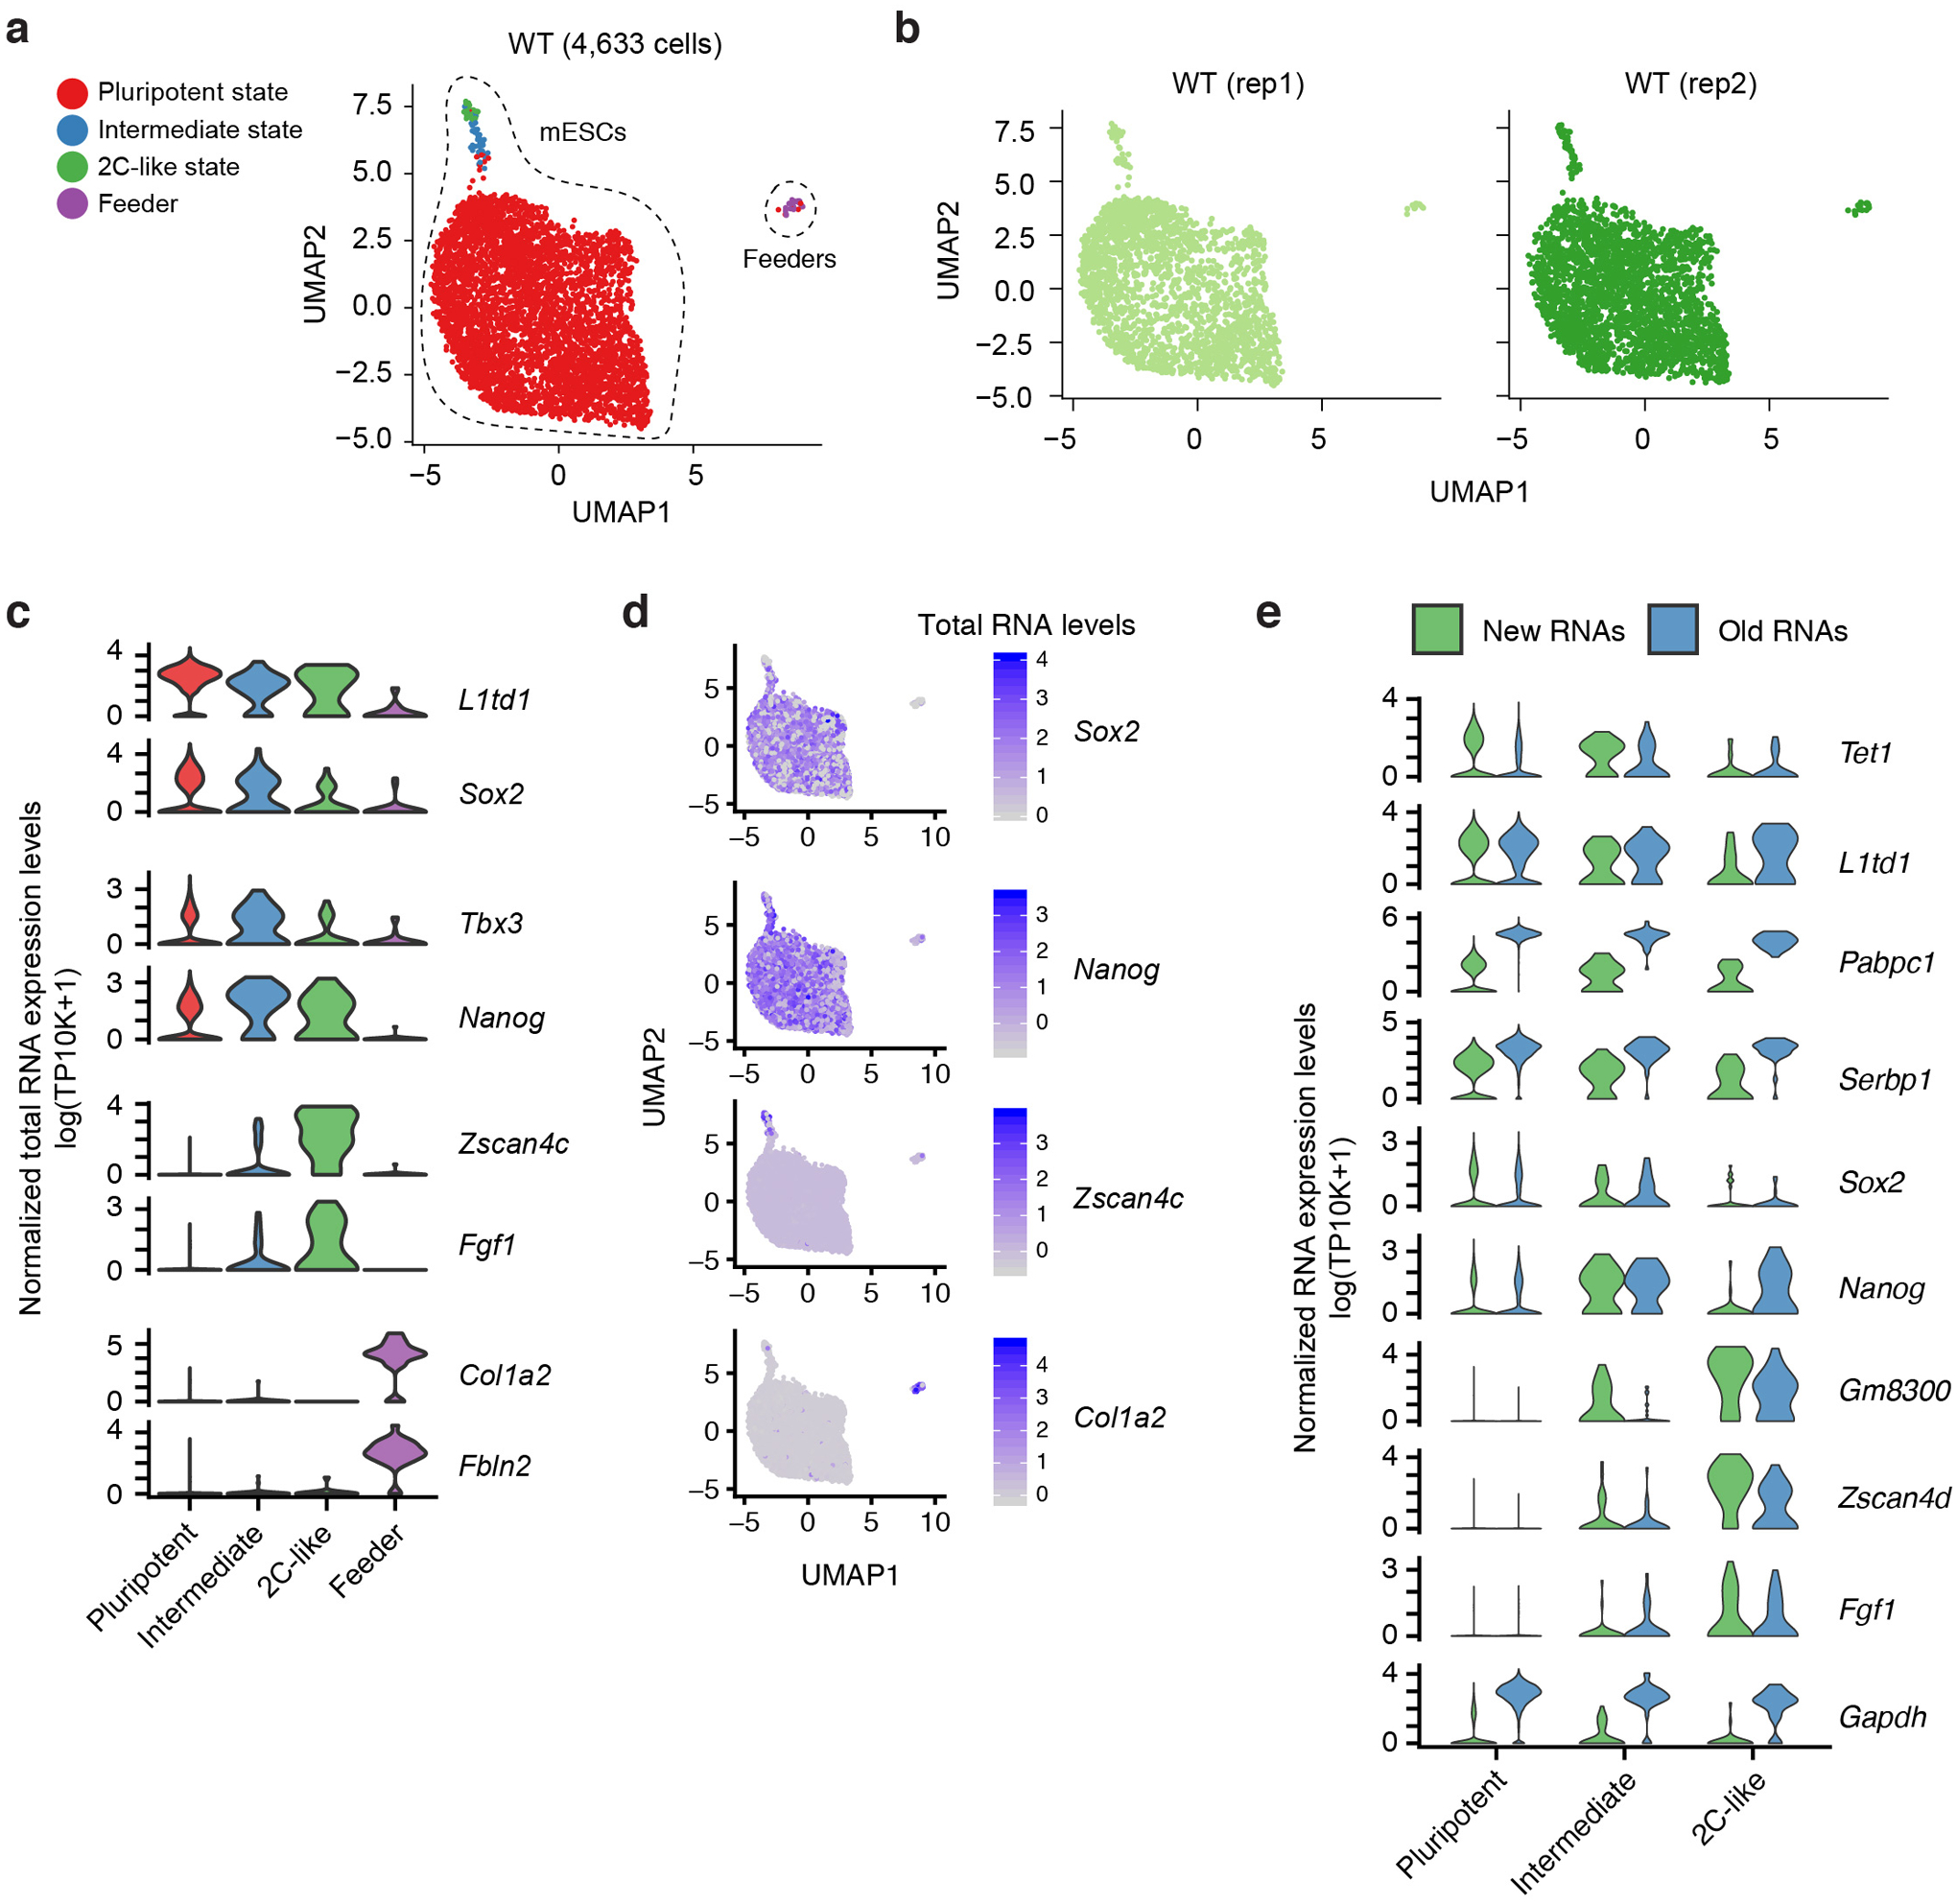
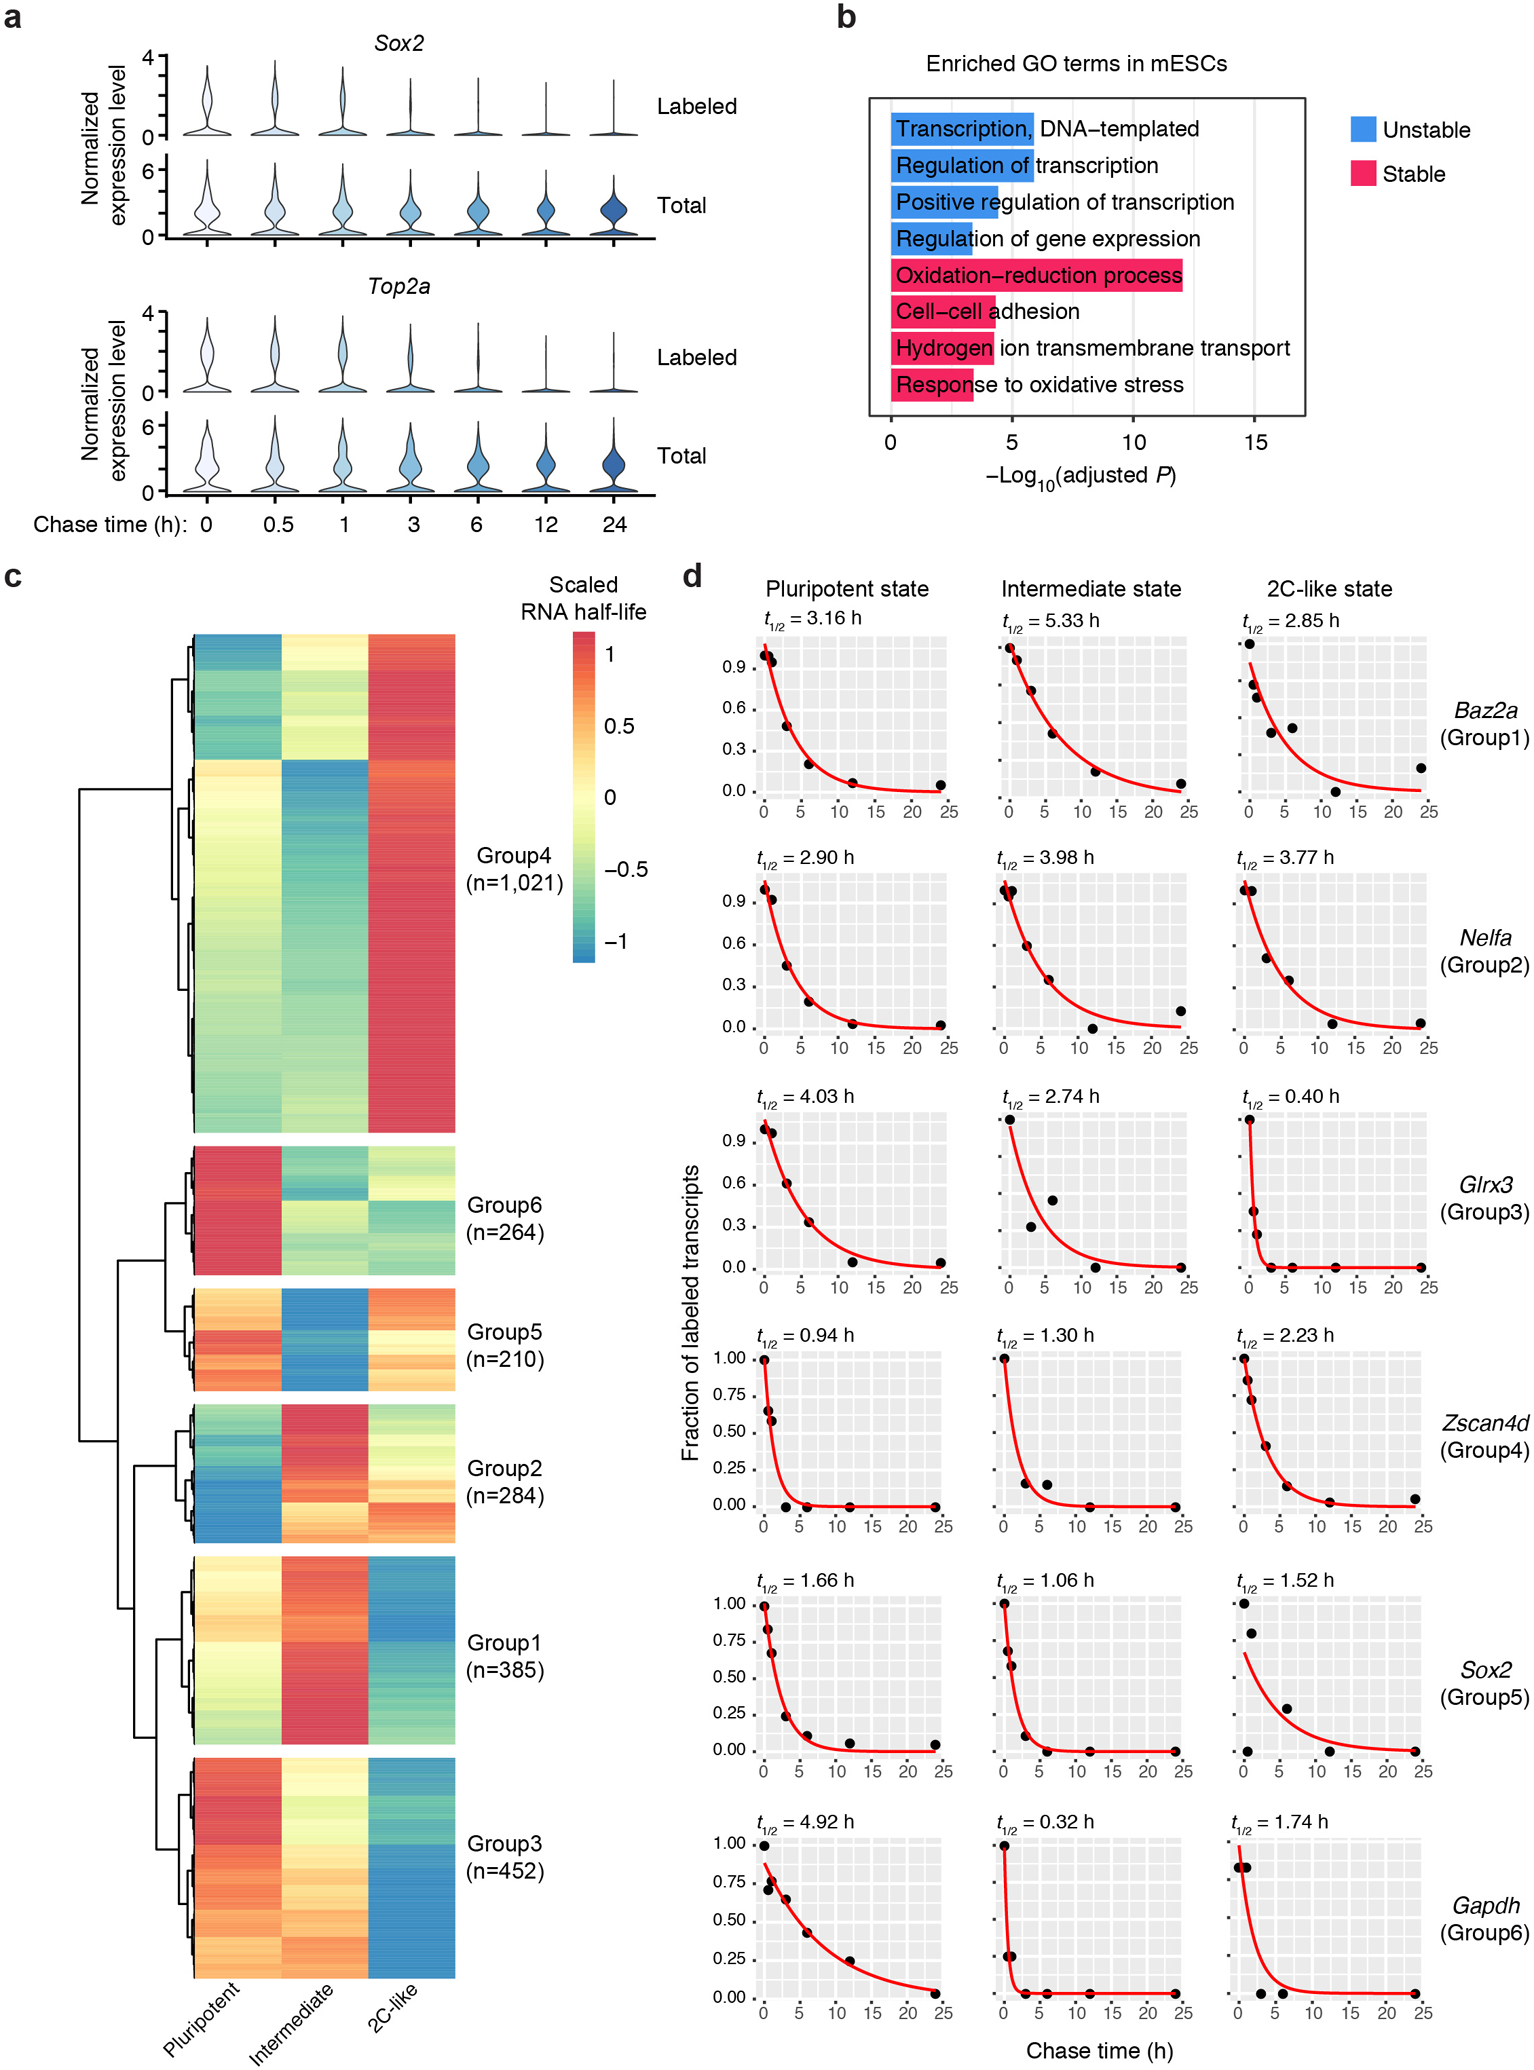
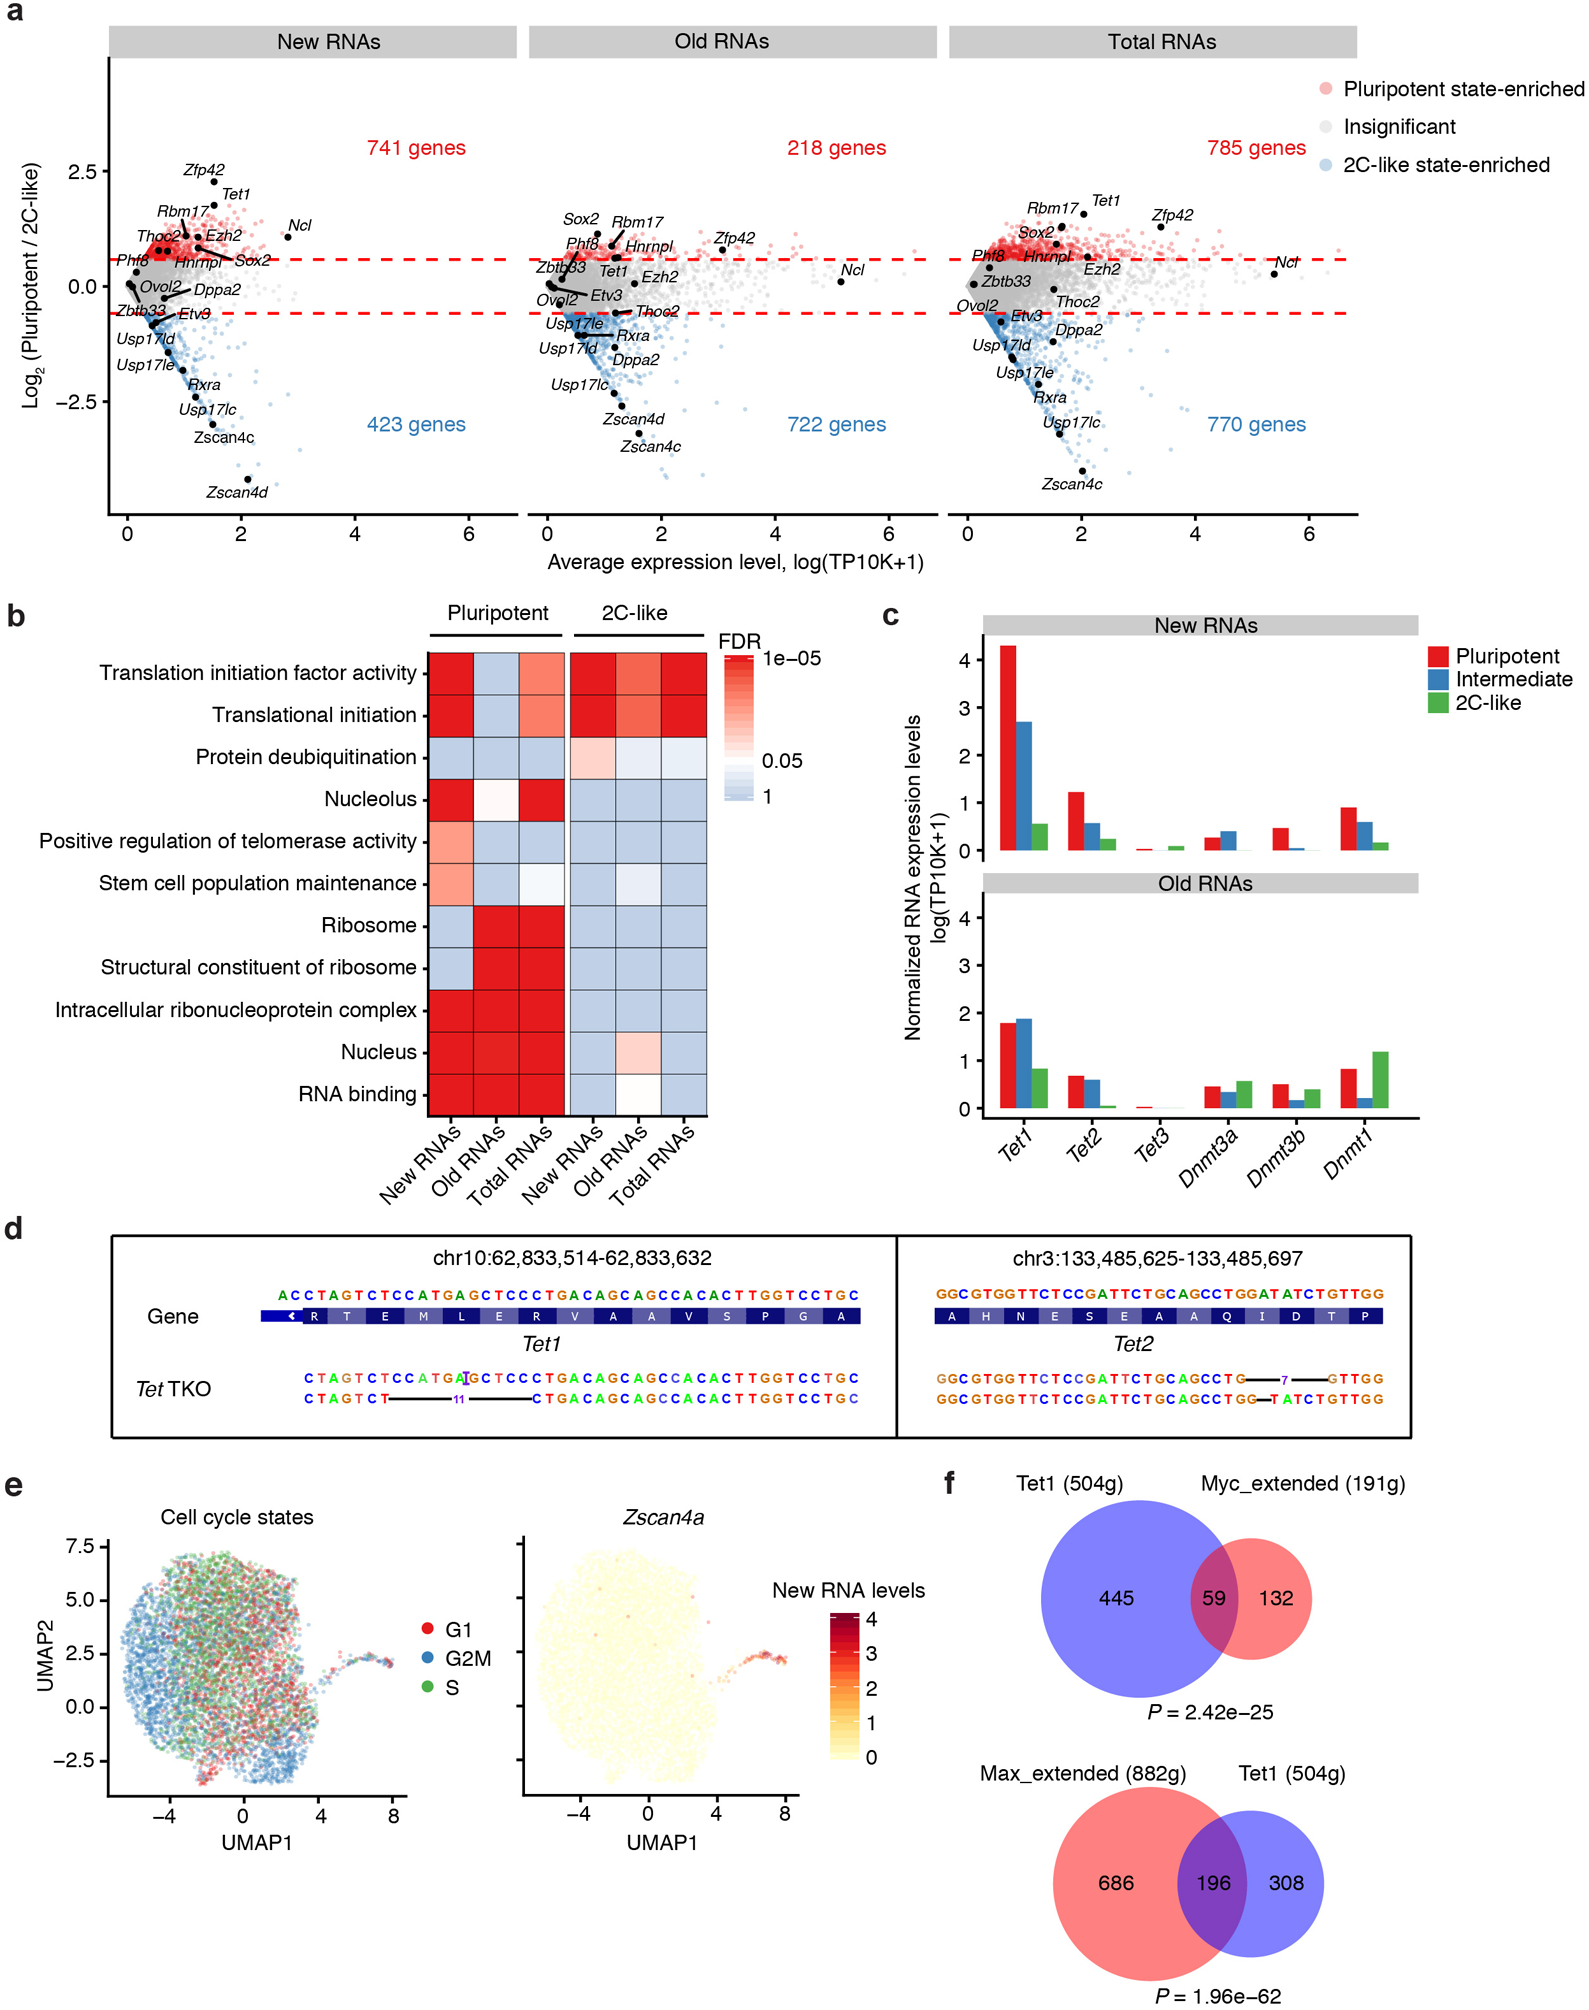
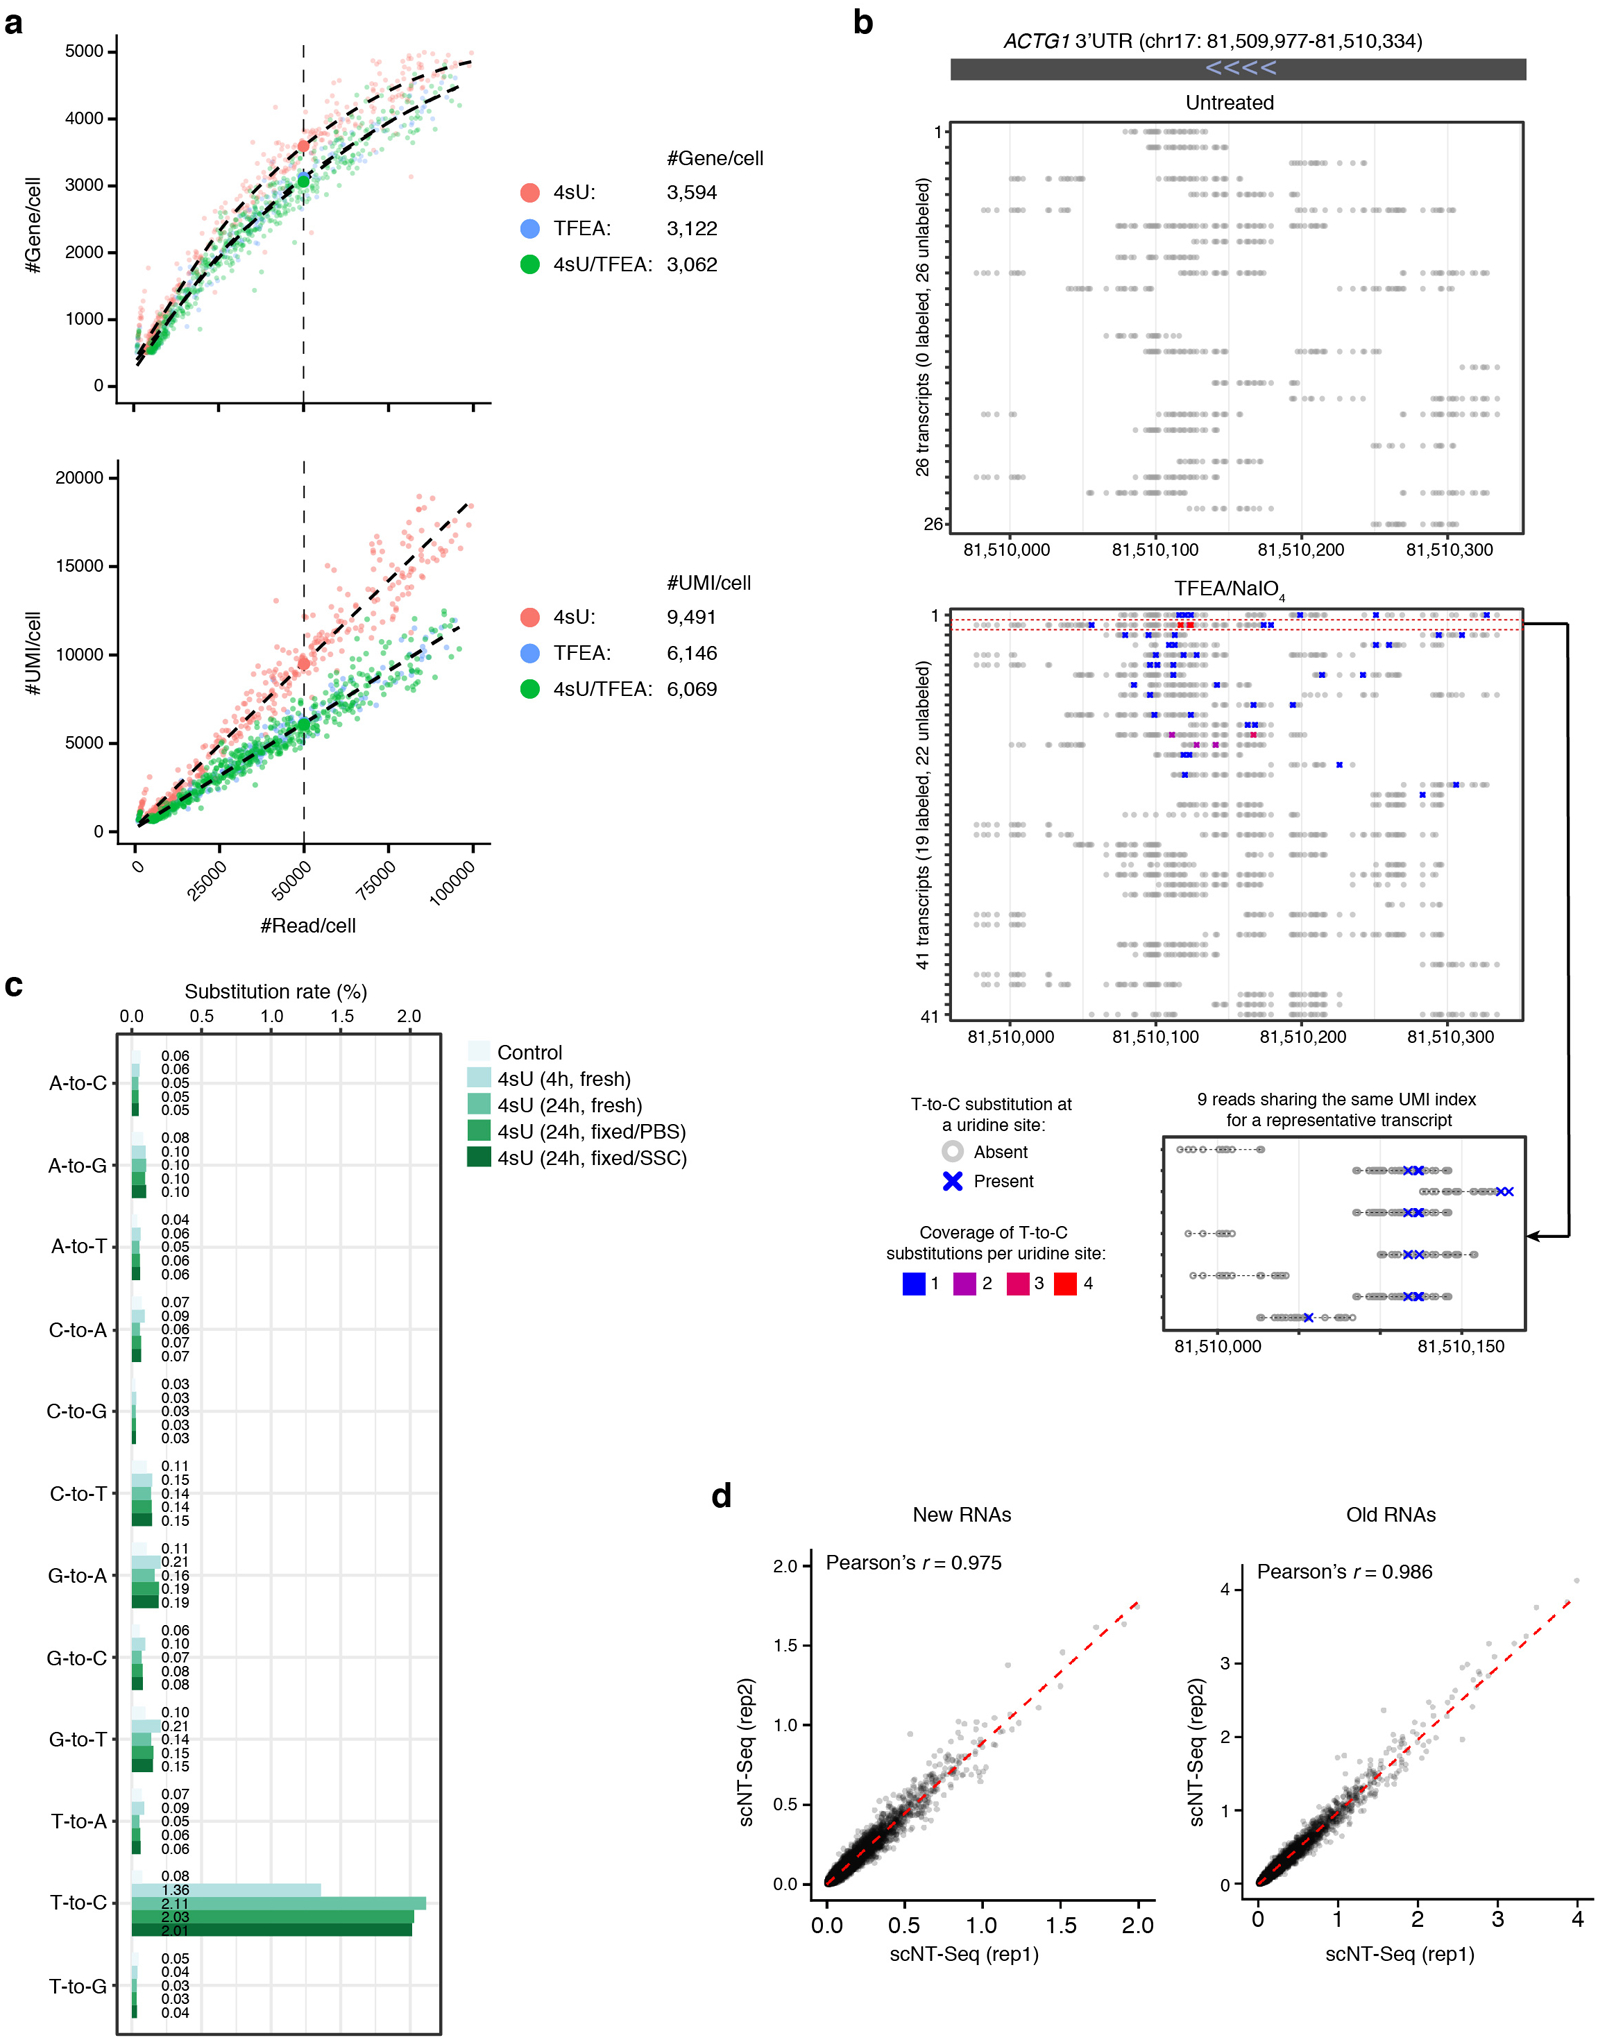
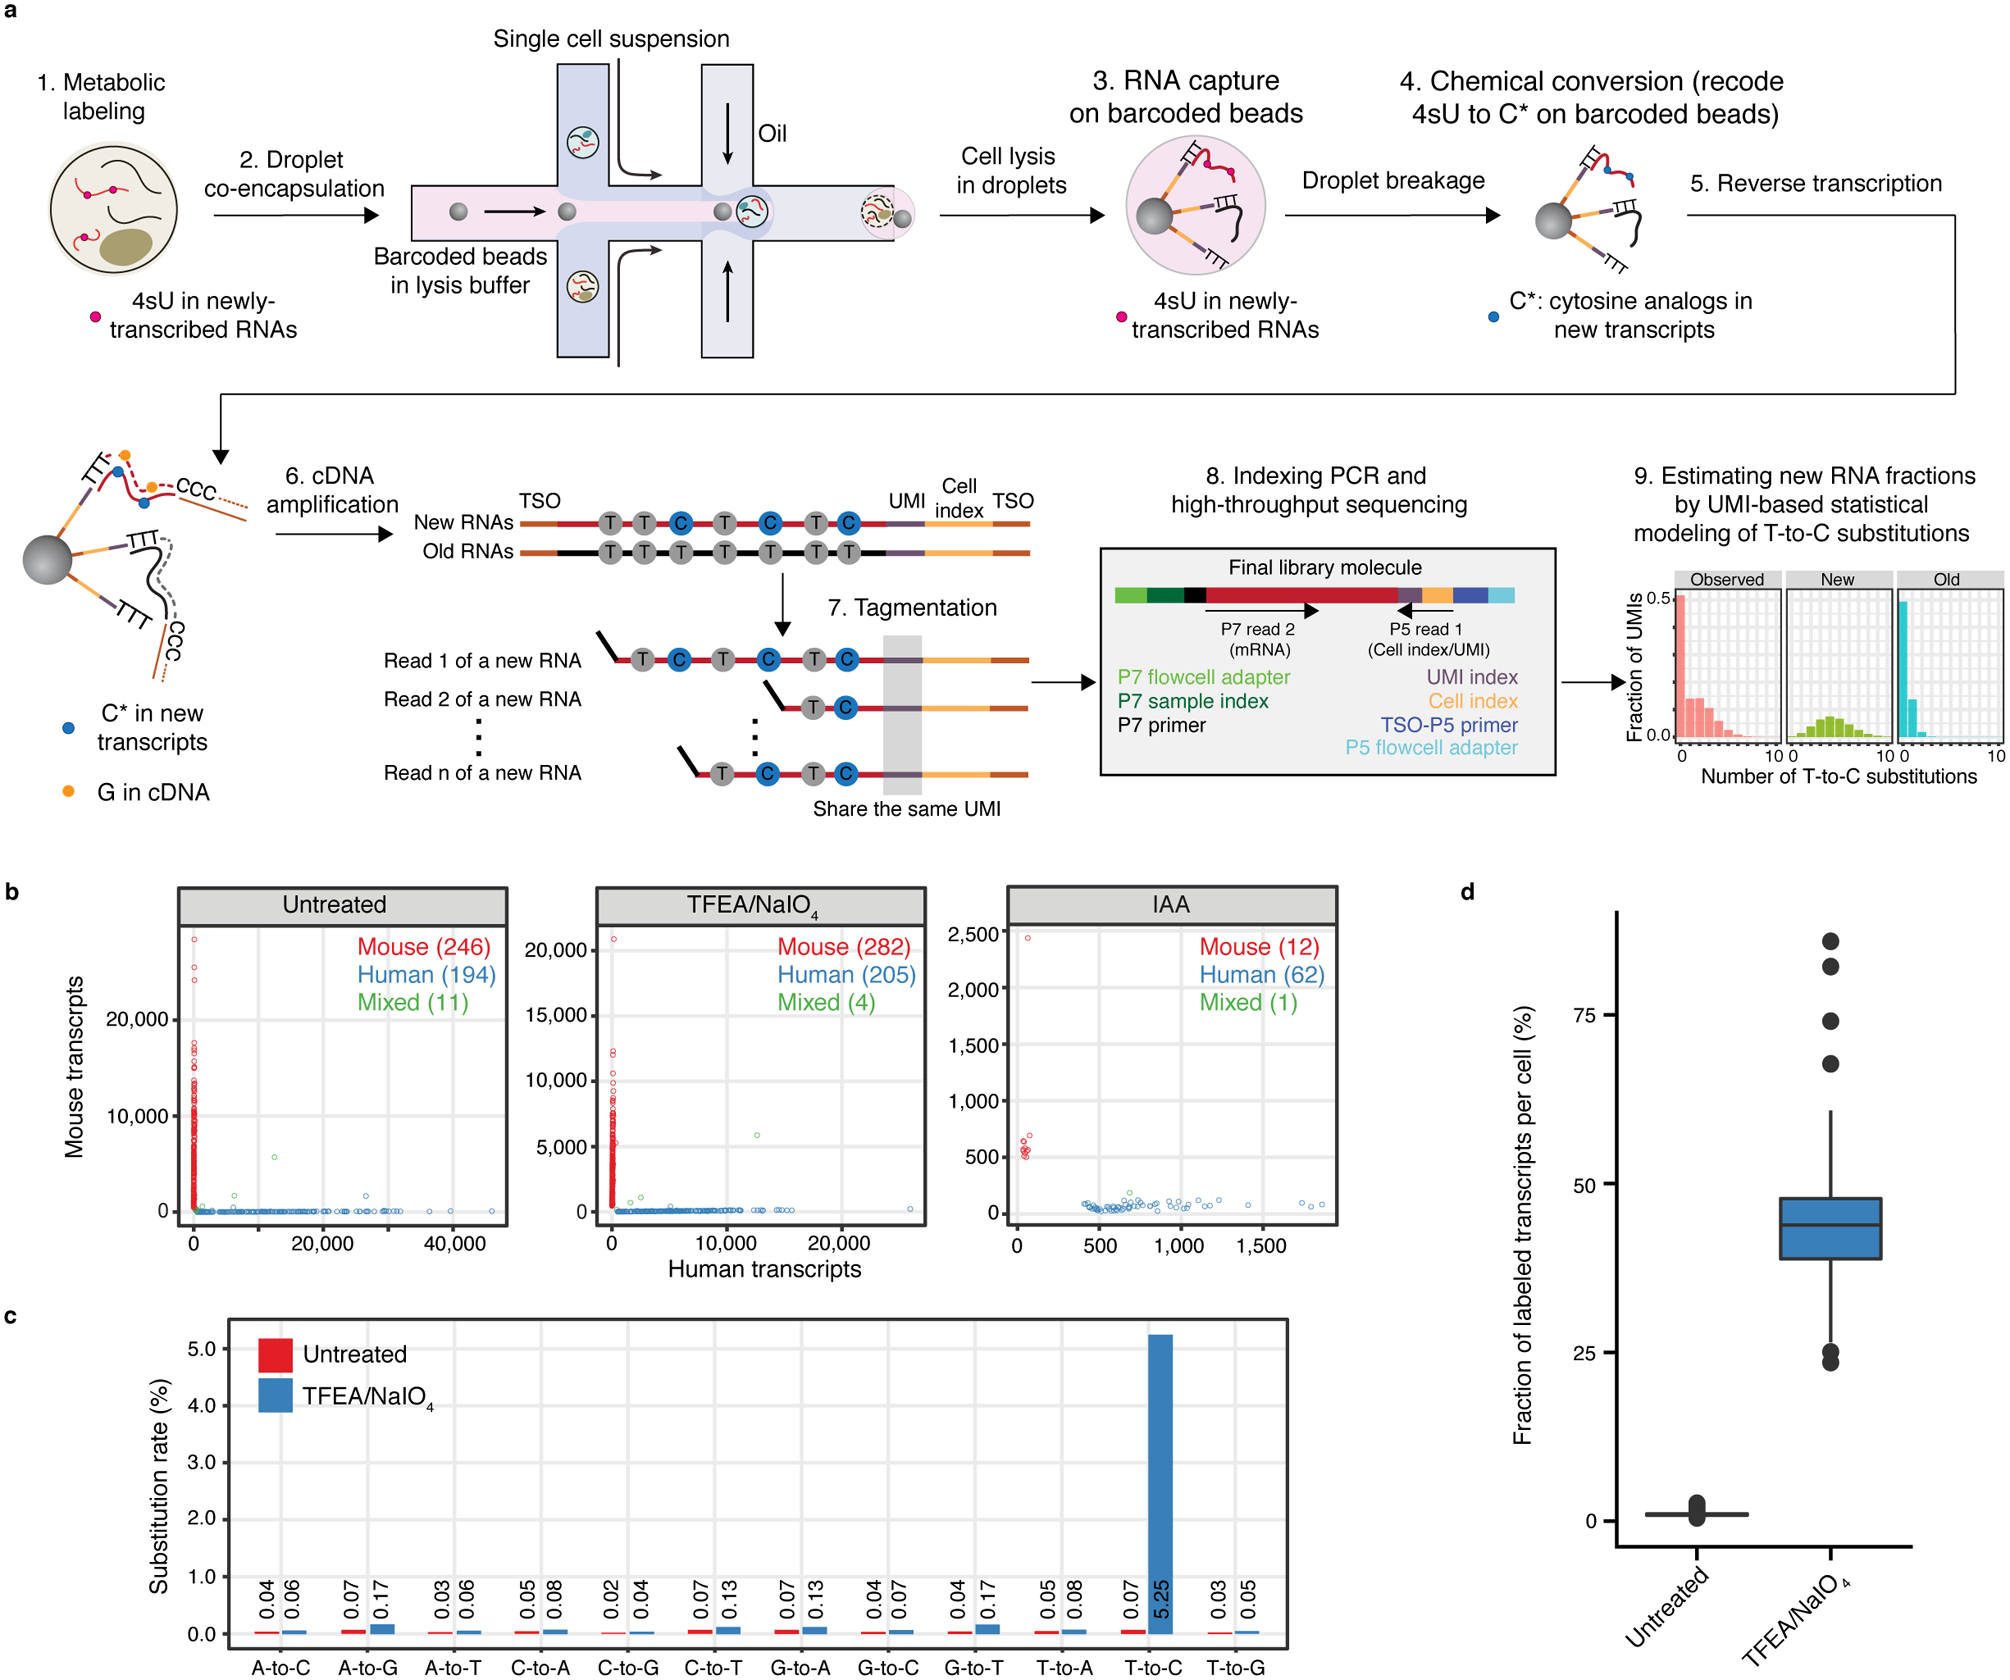
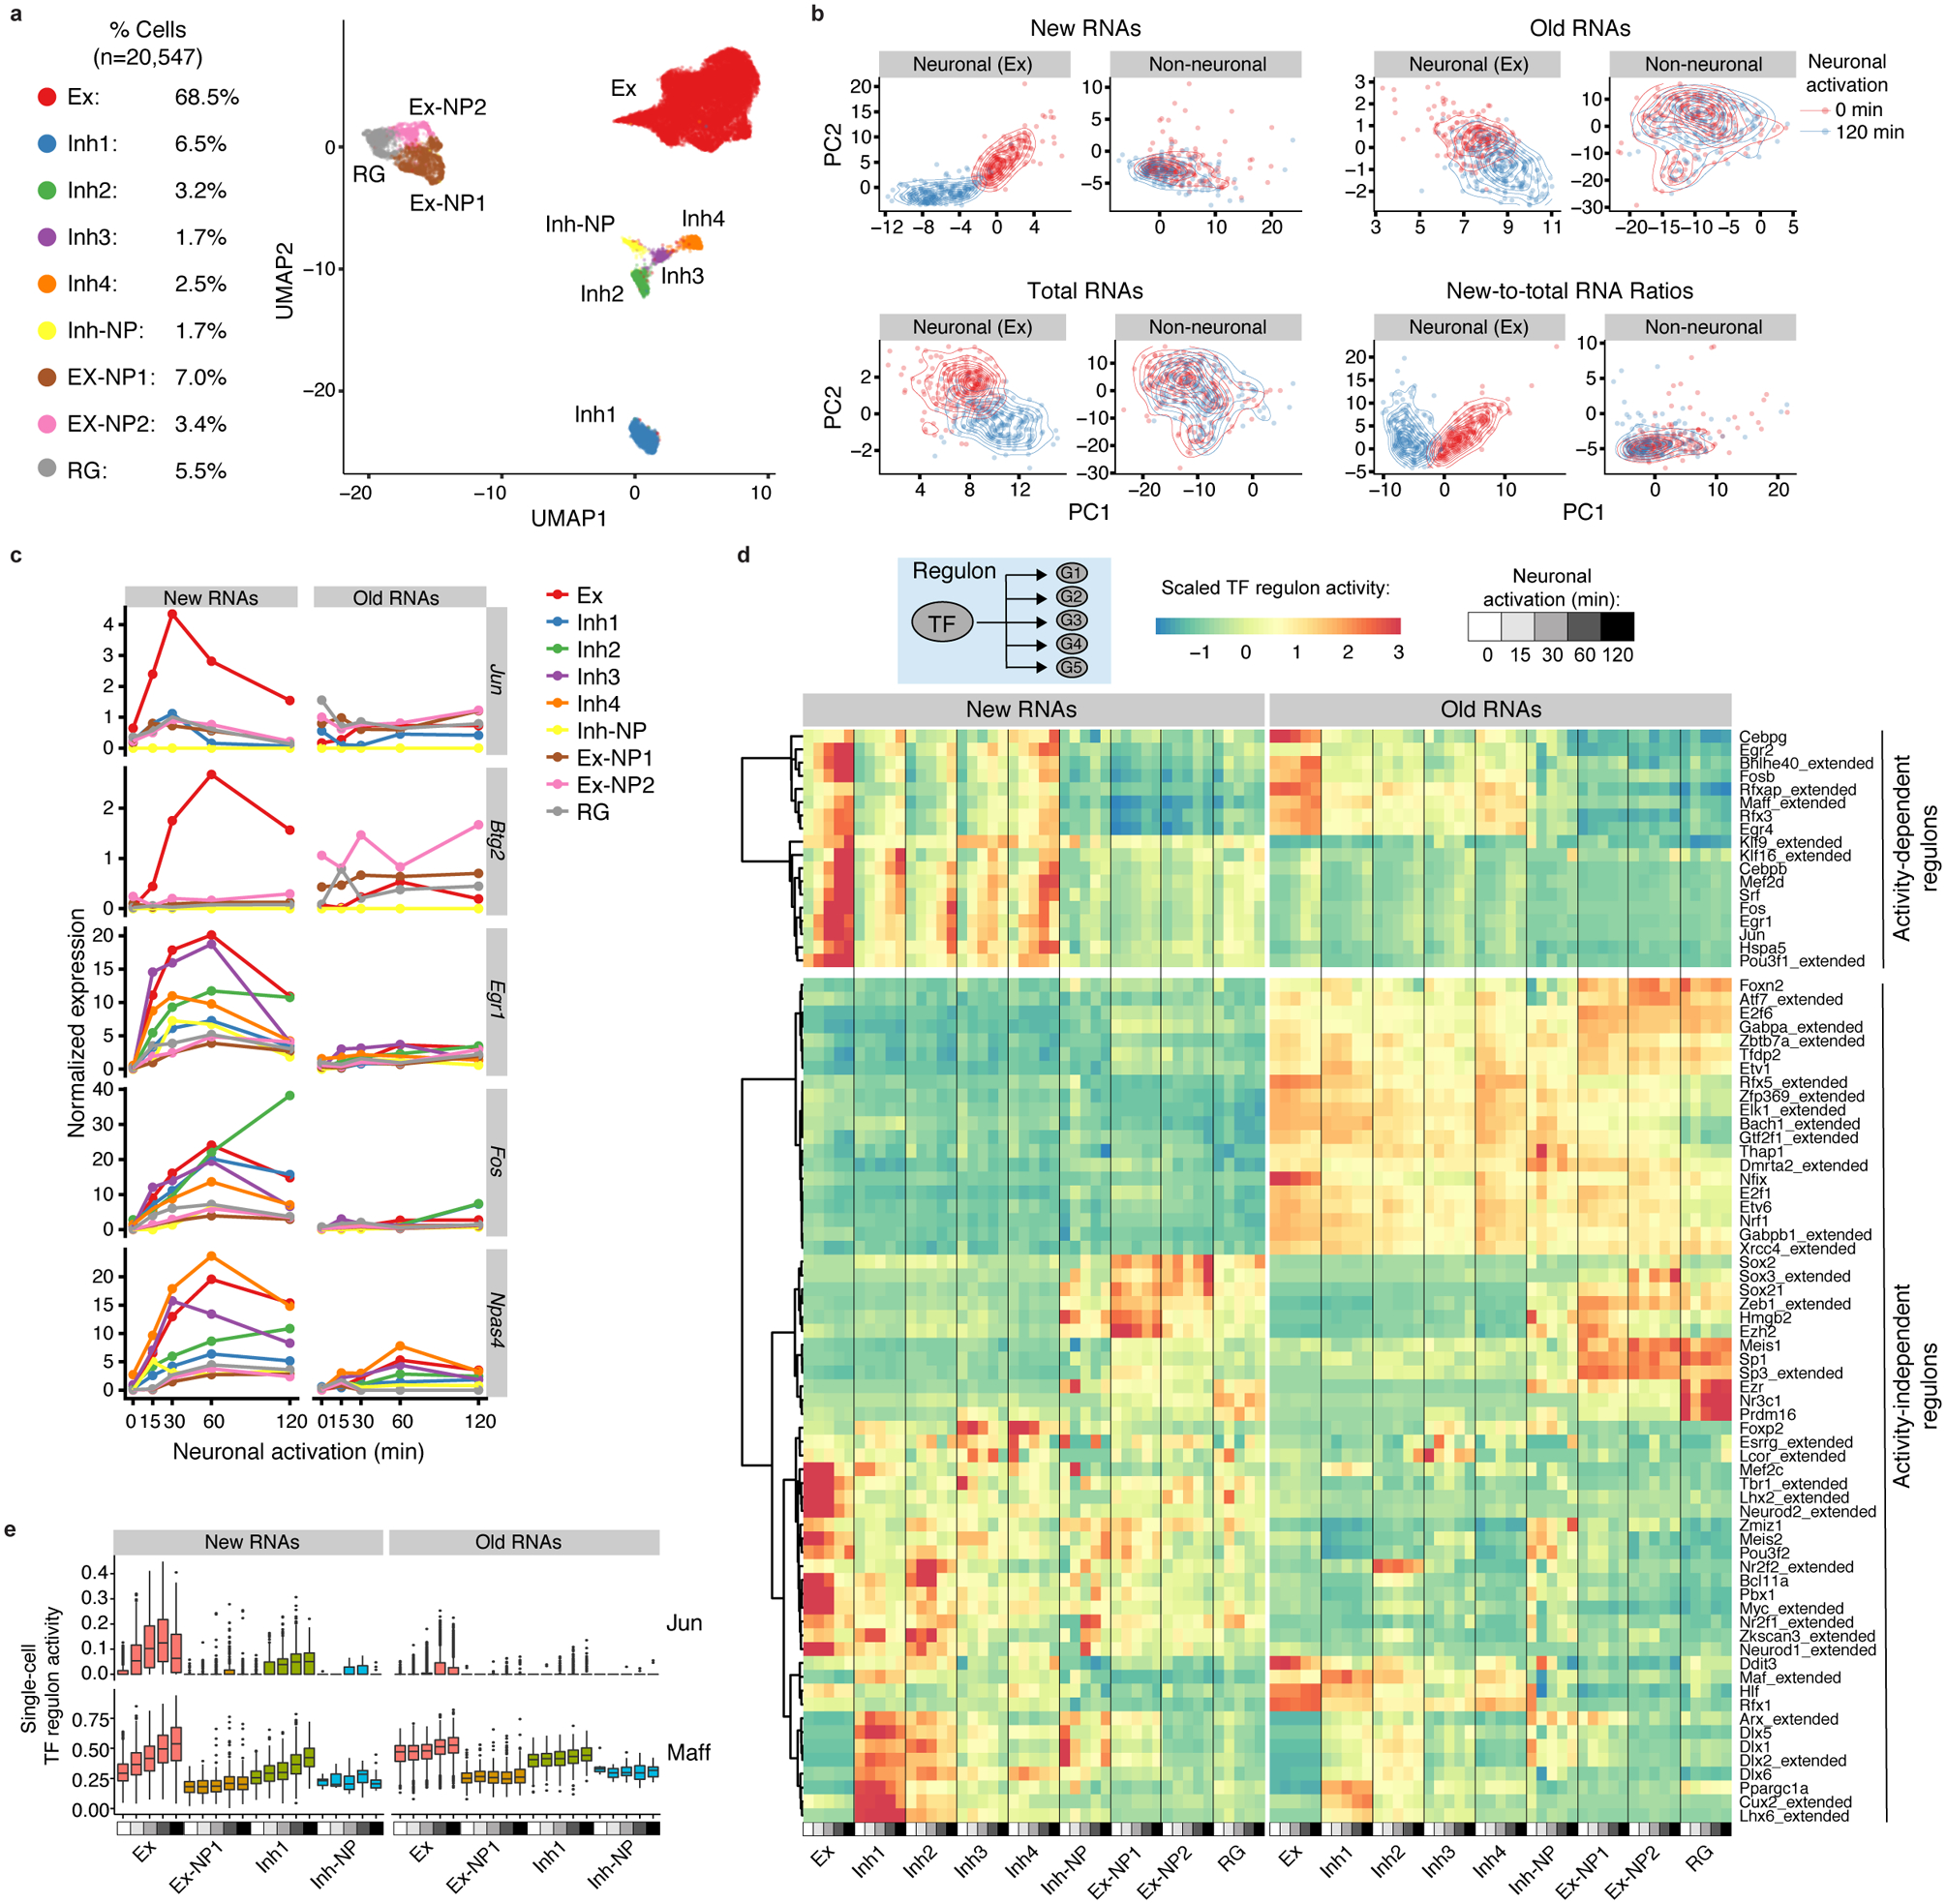
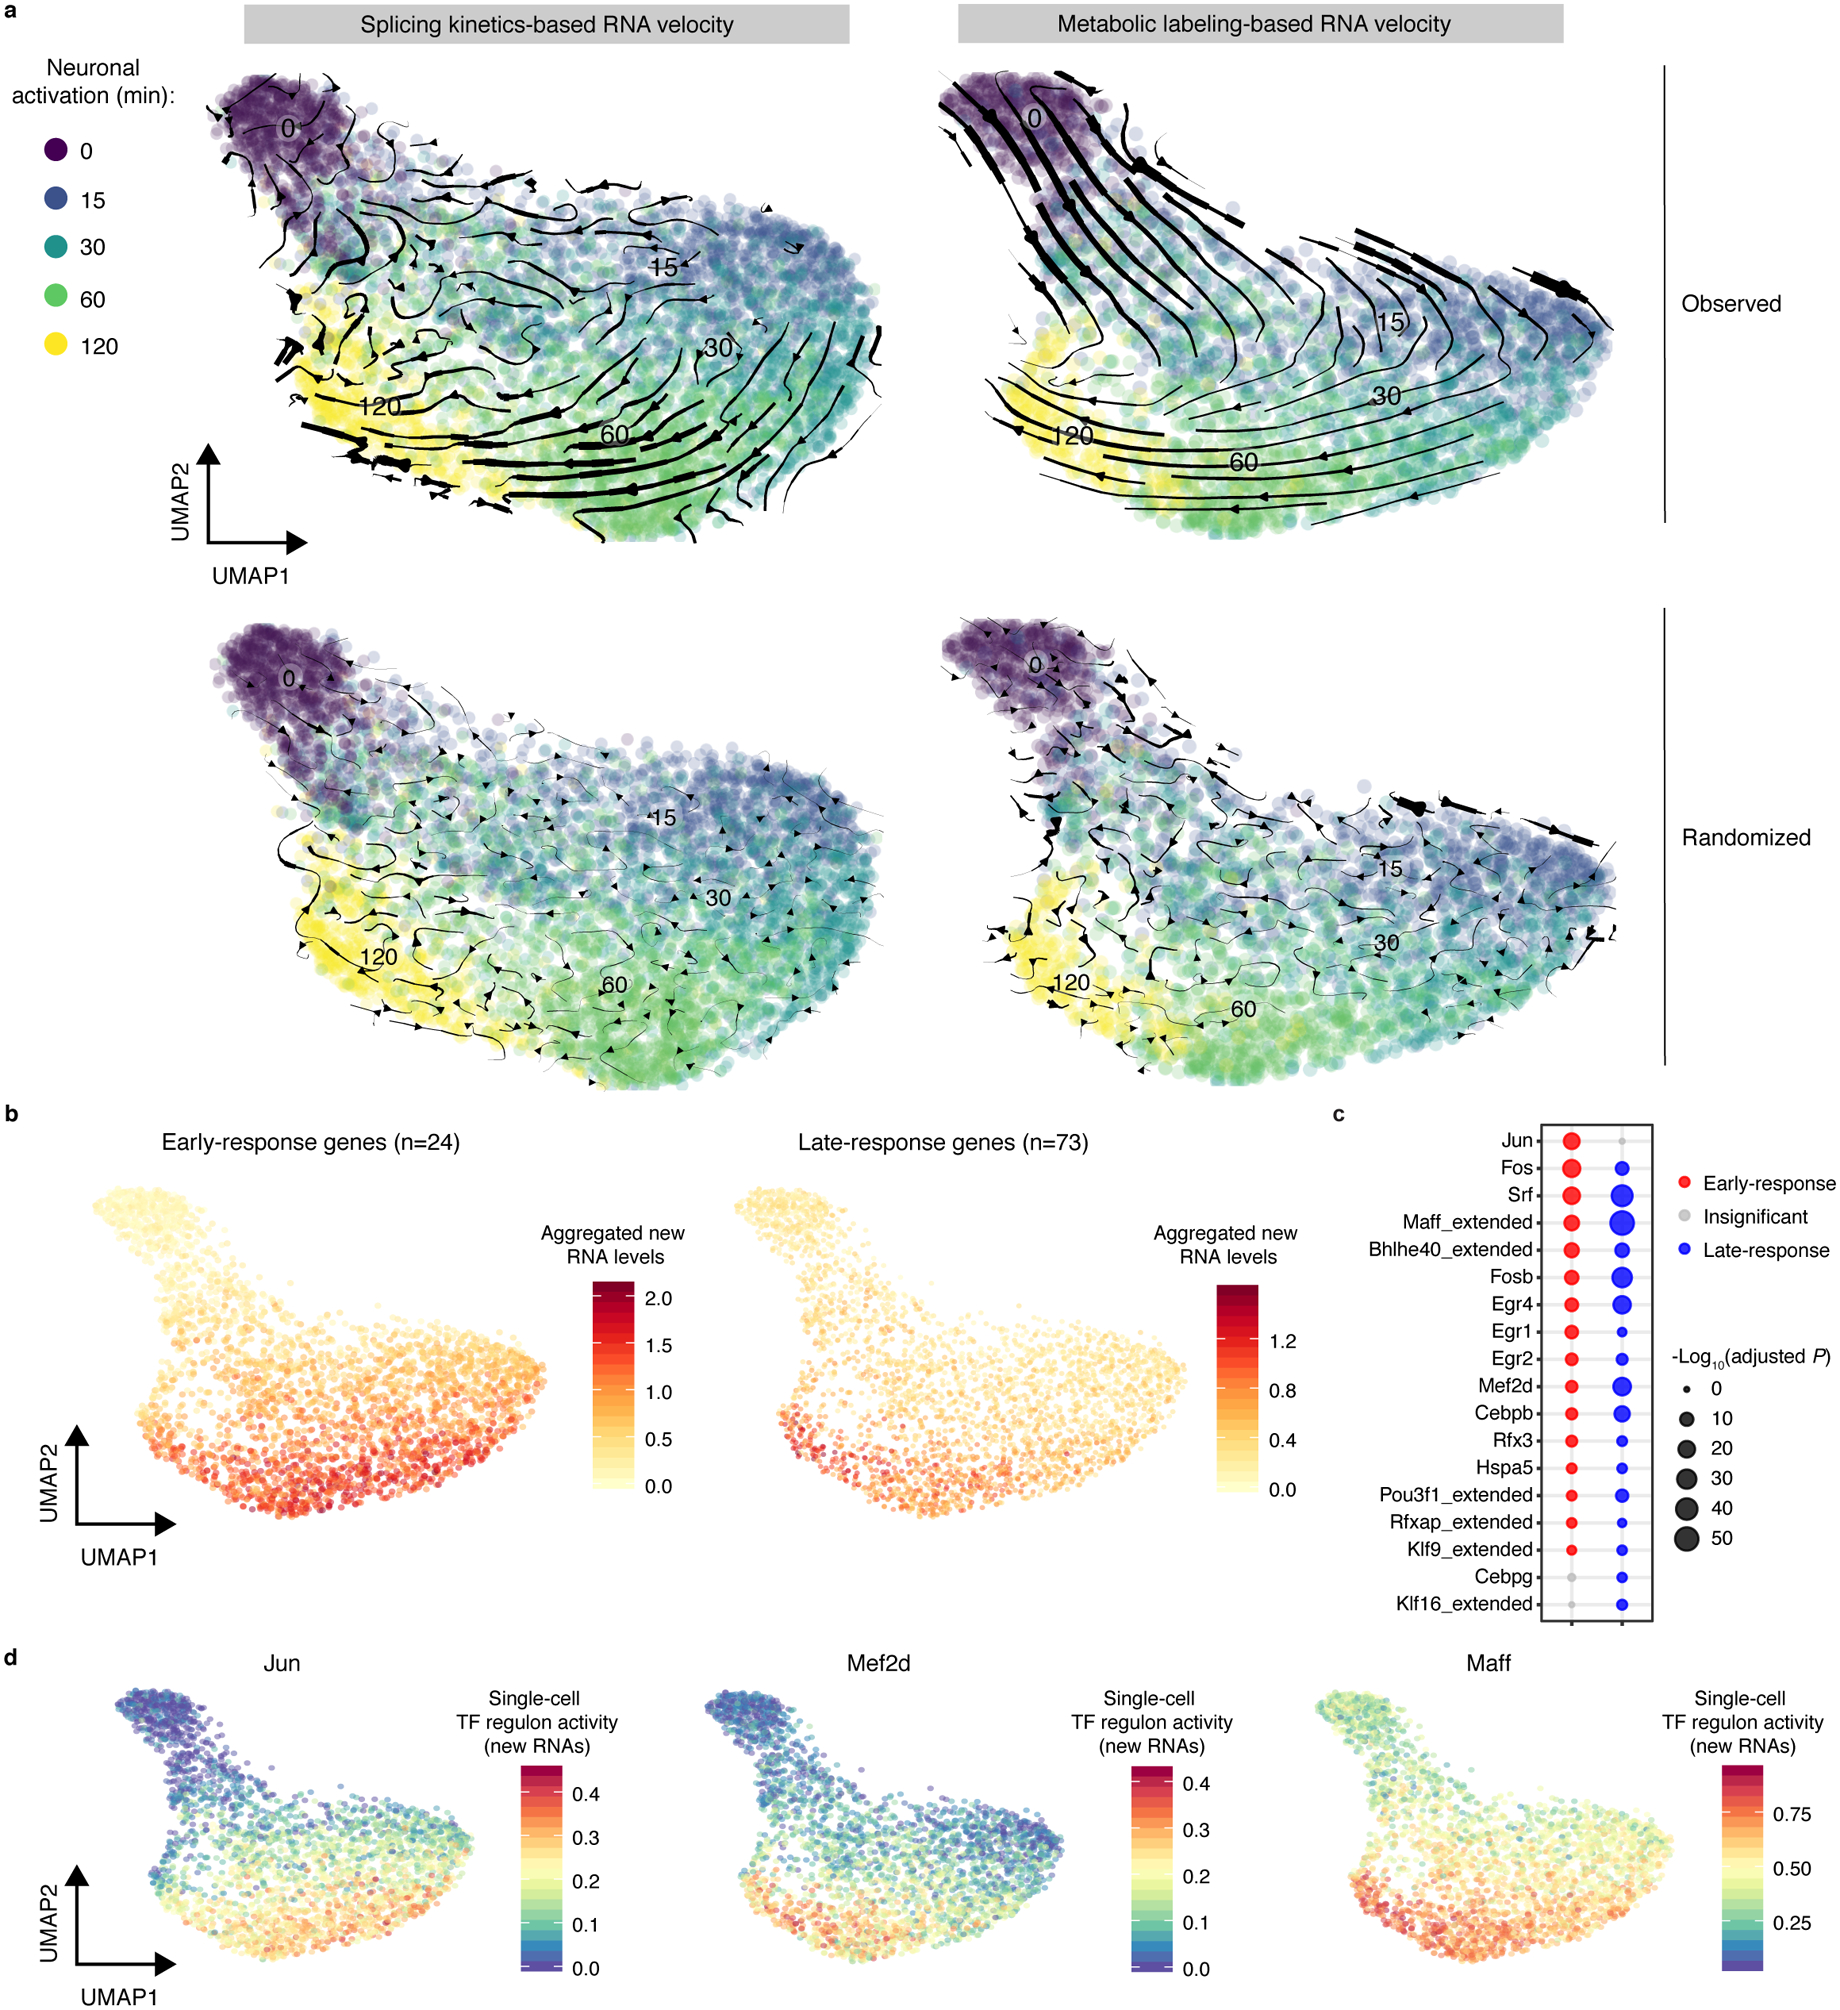
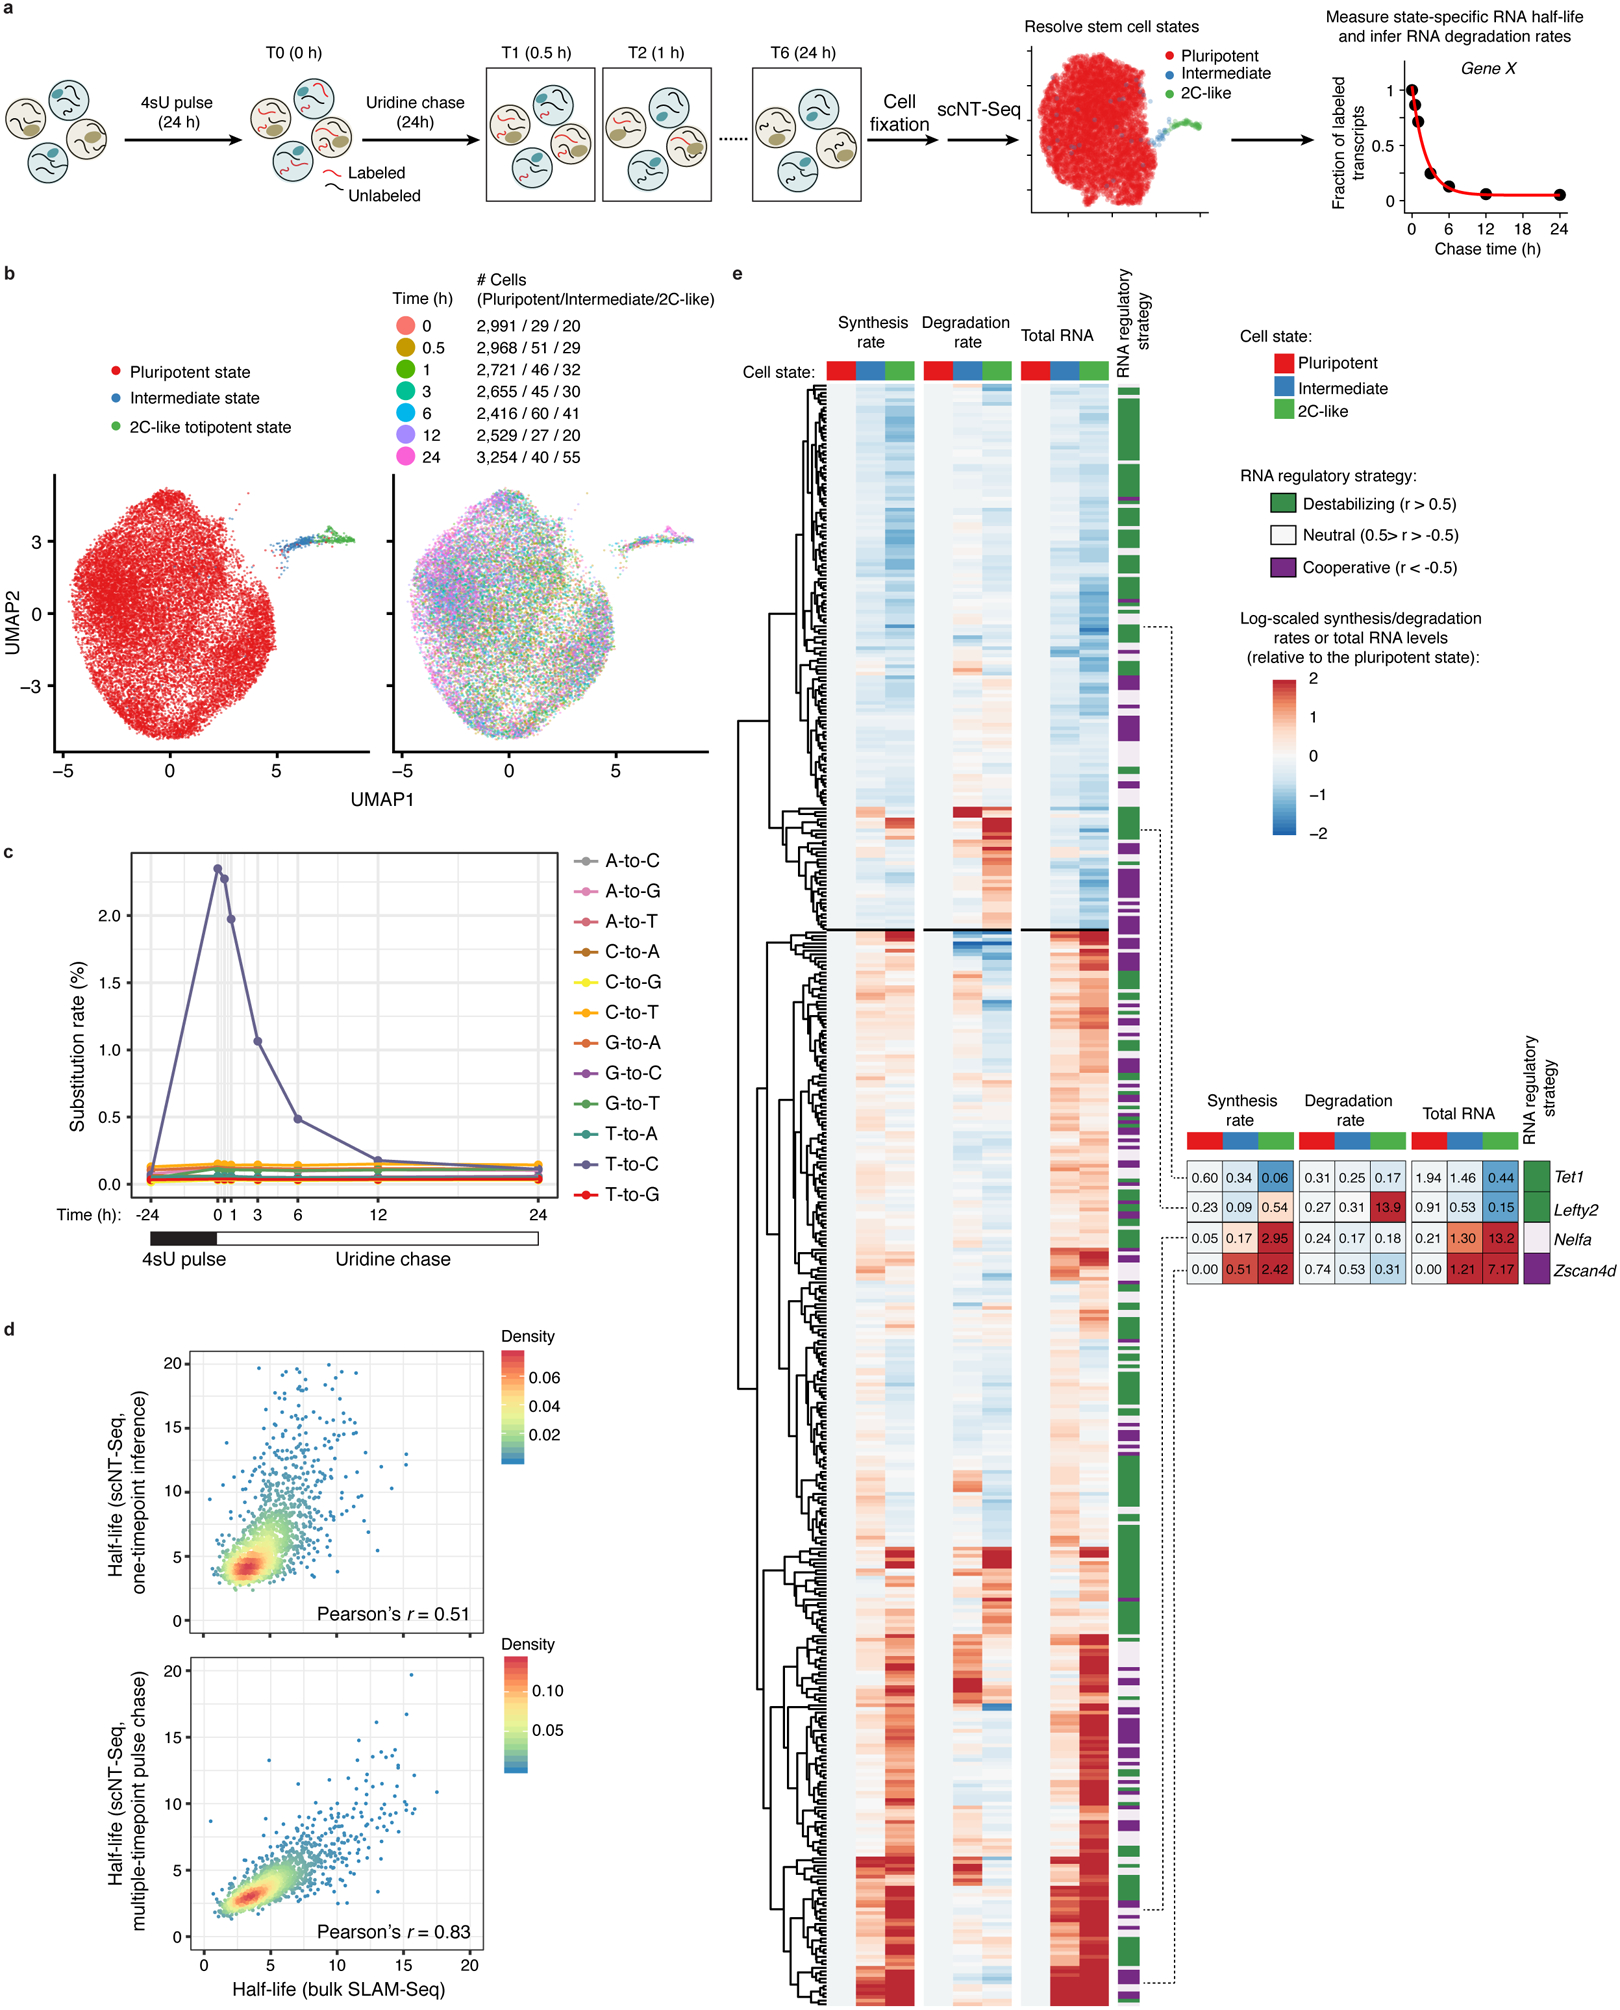
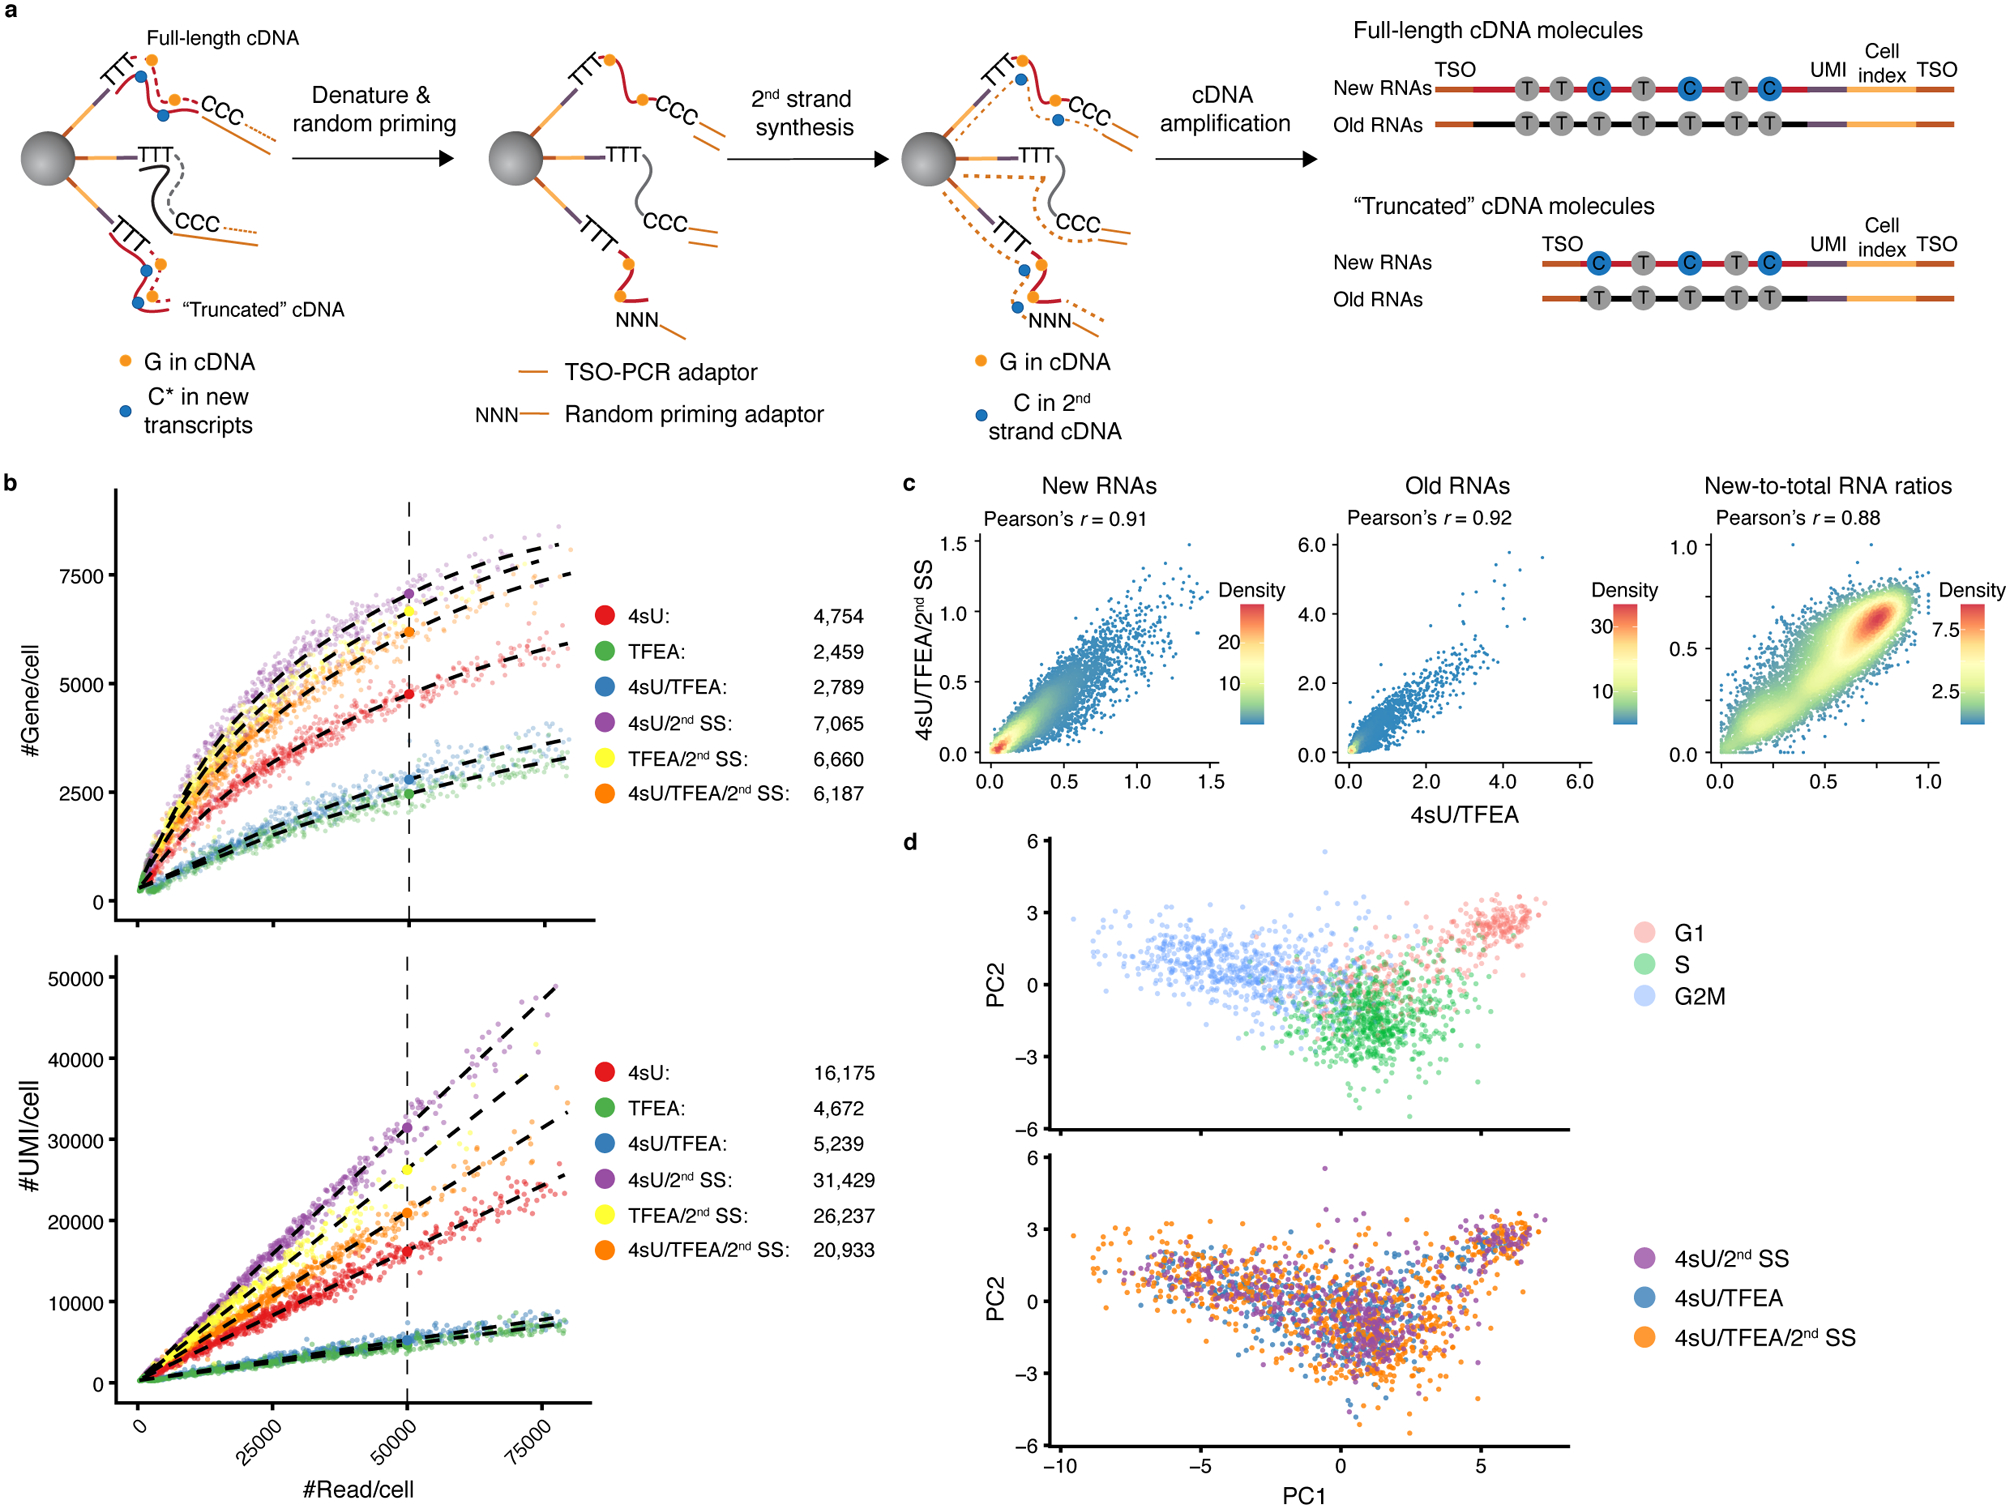
Single-cell RNA sequencing offers snapshots of whole transcriptomes but obscures the temporal RNA dynamics. Here we present single-cell metabolically labeled new RNA tagging sequencing (scNT-seq), a method for massively parallel analysis of newly transcribed and pre-existing mRNAs from the same cell. This droplet microfluidics-based method enables high-throughput chemical conversion on barcoded beads, efficiently marking newly transcribed mRNAs with T-to-C substitutions. Using scNT-seq, we jointly profiled new and old transcriptomes in ~55,000 single cells. These data revealed time-resolved transcription factor activities and cell-state trajectories at the single-cell level in response to neuronal activation. We further determined rates of RNA biogenesis and decay to uncover RNA regulatory strategies during stepwise conversion between pluripotent and rare totipotent two-cell embryo (2C)-like stem cell states. Finally, integrating scNT-seq with genetic perturbation identifies DNA methylcytosine dioxygenase as an epigenetic barrier into the 2C-like cell state. Time-resolved single-cell transcriptomic analysis thus opens new lines of inquiry regarding cell-type-specific RNA regulatory mechanisms.


Conflict of interest statement

Competing interests

The authors declare no competing interests.

Figures

Extended Data Fig. 1
Extended Data Fig. 1. Performance and quality control analyses of scNT-Seq.
a. Scatterplots showing the number of detected gene per cell (y-axis, upper panel) or UMI per cell (y-axis, lower panel) as a function of aligned reads per cell (x-axis) between 4sU (red, 462 cells), TFEA (blue, 211 cells), and 4sU/TFEA (green, 578 cells) experiments. 4sU, cells labeled with 4sU (100 μM, 4 hours (h)). TFEA, beads treated with TFEA/NaIO4 chemical reaction. 4sU/TFEA, cells labeled with 4sU and beads treated with TFEA/NaIO4 chemical reaction. The fitted lines of different experiments were shown. The predicted numbers of gene or UMI detected per cell at matching sequencing depth (50,000 aligned read per cell) are shown on the top. b. Shown are all transcripts (with unique UMIs) for the ACTG1 gene from one untreated control K562 cell (upper panel) and one TFEA/NaIO4-treated cell (lower panel). Grey circles denote uridine sites without T-to-C substitution, and “X”s denote sites with T-to-C substitutions. The read coverage for each T-to-C substitution is color-scaled. All 9 sequencing reads of the 2nd UMI (in red box) from the TFEA/NaIO4-treated cell are highlighted below. c. Bar plot showing nucleotide substitution rates in mESCs with different labeling parameters (100 μM 4sU for 4 h or 200 μM 4sU for 24 h) and sample processing methods (freshly isolated versus methanol fixation followed by cyro-preservation and rehydration with two different rehydration buffers: PBS-based versus SSC-based). A sample (100 μM 4sU for 4 h) that was not treated with TFEA/NaIO4 served as the control. d. Scatterplots showing Pearson’s correlation between two biologically independent replicates of mESCs (rep1: 427 cells and rep2: 733 cells). The expression levels of new (n = 10,925 genes) and old (n = 14,496 genes) transcripts were quantified as natural log transformation of (TP10K + 1).
Extended Data Fig. 2
Extended Data Fig. 2. Cell-type clustering and analysis of activity-dependent gene expression programs in mouse cortical neuronal cultures.
a. Experimental scheme of characterizing neuronal activation in primary mouse cortical cultures with scNT-Seq. Cells were treated with KCl from 15 min to 120 min. Cells from all treatment conditions were labeled with 4sU for 2 h before harvest for scNT-Seq. b. Left, UMAP plot for 20,547 cells from mouse cortical cultures (the same UMAP plot in Fig. 2a). The cells are colored by different time points of neuronal activation. Right, violin plot showing the distribution of total RNA levels for representative cell-type specific marker genes. c. Heatmap showing new RNA levels (z-scaled natural log transformation of (TP10K + 1)) of neuronal activity induced genes across different cell-types. d. Heatmap showing new RNA levels (z-scaled natural log transformation of (TP10K + 1)) of early- and late-response genes in excitatory neurons with different durations of KCl stimulation. 97 significantly induced genes were clustered into two groups (early- and late-response). The expression levels of early- and late-response genes are in Supplementary Table 2. e. Venn diagram showing a significant overlap between Maff and Fosb regulon targets (243 genes, P-value = 1.64 × 10−164, Two-sided Fisher’s exact test).
Extended Data Fig. 3
Extended Data Fig. 3. UMI-based statistical correction of newly-transcribed RNA fraction.
a. Density plot showing the distribution of number of covered uridine sites per read (60 bp) or per UMI (UMI-linked transcript) in excitatory neurons with 60 min of KCl stimulation. b. Bar plot of the number of T-to-C substitutions per read (60 bp) or UMI. Shown is the analysis of excitatory neurons with 60 min of KCl stimulation. c. Shown are all unique transcripts (with unique UMIs) of the Fos (an activity-induced gene) and Mapt (a slow turnover housekeeping gene) from a single excitatory neuron with 60 min of KCl stimulation. Grey circles represent uridines without T-to-C conversion, while crosses (“X”s) denote uridines with T-to-C substitution in at least one read. The read coverage for each T-to-C substitution is color-scaled. d. Comparison of uncorrected and statistically corrected new RNA levels of each detected gene (n=9,082 genes) in excitatory neurons (with 60 min of KCl stimulation). Four representative activity-induced genes (Fos, Jun, Egr1, and Npas4) and two housekeeping genes (Mapt and Actb) are highlighted with red circles. e. Scatter plot showing the new transcript fraction (over total RNAs; y-axis) of excitatory neurons with 60 min of KCl stimulation as a function of differential gene expression (between 60 min and 0 min of KCl stimulation; x-axis). Two-sided Wilcoxon rank sum test was used to assess significance of the difference, and the P-value was adjusted by Bonferroni correction. Genes were color-coded by statistical significance of differential gene expression. The fraction of new transcripts, expression fold-change, and adjusted P-value of each gene are in Source Data Extended Data Fig.3.
Extended Data Fig. 4
Extended Data Fig. 4. scNT-Seq enables metabolic labeling-based time-resolved RNA velocity in excitatory neurons.
a. UMAP visualization of excitatory neurons (13,511 cells, with >500 genes detected per cell) that were characterized by standard splicing kinetics-based (left) or metabolic labeling based RNA velocity (right) analyses. Cells are color-coded by time points. The streamlines indicate the integration paths that connect local projections from the observed state to extrapolated future state. The thickness of streamline indicates the magnitude of velocity. UMAP plots in lower panels (same as upper panels) show randomized velocity controls for splicing (left) or metabolic labeling (right) based RNA velocity. Permutation of velocity flows was performed by shuffling velocity for genes in each cell and then randomly flipping the sign of shuffled velocity values. b. UMAP (same as right of a) visualization of Ex neurons colored by the average new RNA expression level (natural log transformation of (TP10K + 1)) of 24 early- (left) or 73 late-response (right) genes. c. UMAP (same as right of a) showing Ex neurons colored by the regulon activity of three representative TFs (Jun, Mef2d, and Maff).
Extended Data Fig. 5
Extended Data Fig. 5. Comparison of splicing-based and metabolic labeling-based RNA velocity analysis methods.
The excitatory neurons (n=3,066 cells, with >2,000 genes detected per cell) were analyzed by either splicing kinetics-based (a) or metabolic labeling-based (b) RNA velocity. Shown are the phase portraits (left), UMAP plots colored by smoothed total RNA level based on local averaging (middle), and RNA velocity values (right) of three representative activity-induced genes (Egr1, Fos and Homer1).
Extended Data Fig. 6
Extended Data Fig. 6. Quality control for metabolic labeling based RNA velocity analysis.
a. UMAP (as in right panels of Fig. 3a) visualization of high-quality Ex neurons (3,066 cells, >2,000 genes detected per cell) colored by time points (left), number of gene detected (middle), and number of UMI detected per cell (right). b. UMAP (as in right panels of Fig. 3a) visualization of high-quality Ex neurons colored by the new RNA levels (natural log transformation of (TP10K + 1)) of six representative genes, including three early-response genes (Egr1, Fos, Jun) and three late-response genes (Homer1, Gadd45g, Nr4a2). c. UMAP (as in right panels of Extended Data Fig. 4a) visualization of all Ex neurons (13,511 cells, >500 genes detected per cell) colored by time points (left), number of gene detected (middle), and number of UMI detected per cell (right). d. UMAP (as in right panels of Extended Data Fig. 4a) visualization of all Ex neurons colored by the new RNA levels (natural log transformation of (TP10K + 1)) of six representative genes (same as in b).
Extended Data Fig. 7
Extended Data Fig. 7. scNT-Seq reveals different stem cell states in mESC cultures.
a. UMAP visualization of 4,633 WT cells (from two biological replicates) colored by different cell-types or cell-states. Feeders are contaminating mouse embryonic fibroblasts. b. UMAP visualization of two biological replicates in (a). c. Violin plots showing total RNA levels (natural log transformation of (TP10K + 1)) of representative marker genes for feeders or specific stem cell states. d. UMAP (same as in (a)) visualization of cells colored by total RNA levels (natural log transformation of (TP10K + 1)) of four representative marker genes. e. Violin plots showing both new and old RNA levels (natural log transformation of (TP10K + 1)) of selected genes across three stem cell states.
Extended Data Fig. 8
Extended Data Fig. 8. Pulse-chase scNT-Seq reveals state-specific mRNA half-life.
a. Violin plots showing levels of labeled and total transcripts of two representative genes (Sox2 and Top2a) during pulse-chase assay. The expression level is measured in natural log transformation of (TP10K + 1). b. Enrichment analysis of GO terms within stable (top 10% genes with longest half-lives) and unstable genes (top 10% genes with shortest half-life) in pluripotent state mESCs. Enrichment analysis was performed via a one-sided hypergeometric test. P-value was then corrected by FDR. The P-values of GO terms are in Source Data Extended Data Fig.8. c. Heatmap showing the mRNA half-life of 2,616 genes across three stem cell states. These genes are clustered to six groups based on the scaled RNA half-lives in three cell states. The state-specific half-lives are in Supplementary Table 4. d. Shown are mRNA decay curves of representative genes from each group. The fraction of labeled transcripts was calculated for each time point and normalized to chase (0 h), then fit to a single-exponential decay model to derive RNA half-lives (t1/2).
Extended Data Fig. 9
Extended Data Fig. 9. scNT-Seq analysis of the pluripotent-to-2C transition in mESCs.
a. Scatter MA-plot showing differential expression of new, old, and total RNAs between pluripotent and 2C-like states. Dashed line denotes 1.5-fold change between states. b. Heatmap showing enriched GO terms for state-specific genes. Significance of enrichment (FDR) is scaled by colors. Enrichment analysis was performed using a one-sided hypergeometric test. P-value was then corrected by FDR. The exact P-values of GO terms are in Source Data Extended Data Fig.9. c. Normalized new and old RNA levels (natural log transformation of (TP10K + 1)) of major DNA methylation regulators across three stem cell states. d. Validation of genotypes of the Tet1 (-11bp/+1bp) and Tet2 (-7bp/-1bp) genes in Tet-TKO cells by aligning scNT-Seq reads to the CRISPR-Cas9 genome editing sites. e. UMAP visualization (same as in Fig. 5d) of mESCs colored by cell-cycle states (left) or the new RNA level (natural log transformation of (TP10K + 1)) of Zscan4a (right). f. Venn diagrams showing significant overlap between Tet1 and Myc regulon target genes (upper) (P-value = 2.42 × 10⁻²⁵, two-sided Fisher’s exact test), and between Tet1 and Max regulon target genes (lower) (P-value = 1.96 × 10−62, two-sided Fisher’s exact test).
Extended Data Fig. 10
Extended Data Fig. 10. Benchmarking the 2nd SS scNT-Seq protocol in human K562 cells.
a. Bar plot showing nucleotide substitution rates in K562 cells analyzed with different experimental protocols. 4sU, metabolic labeling with 4sU (100 μM, 4 h); TFEA, on-bead TFEA/NaIO4 chemical reaction; 2nd SS, second strand synthesis. b. PCA plots showing K562 cells colored by the total RNA level of the TOP2A gene (natural log transformation of (TP10K + 1)) in three experimental protocols (same as in Fig. 6d). c. Violin plots showing the new-to-total RNA ratios of 8 representative cell-cycle genes in datasets generated by 2nd SS (4sU/TFEA/2nd SS, n =795 cells) or standard (4sU/TFEA, n = 533 cell) scNT-Seq protocols. See ‘Data visualization’ in the Methods for definitions of box-plot elements. d. Same as in c but showing new and old RNA levels (natural log transformation of (TP10K + 1)).
Fig. 1
Fig. 1. Development and validation of scNT-Seq.
a. Overview of single-cell metabolically labeled new RNA tagging sequencing (scNT-Seq). b. Species-mixing experiment benchmarks the performance of TFEA/NaIO4- and IAA-based chemical conversion reactions on pooled beads in scNT-Seq, by sequencing a mix (1:1) of human (K562) and mouse (mESC) cells. Scatterplot shows the number of transcripts (UMIs) mapped to mouse (y-axis) or human (x-axis) genome for each cell (dot) that is colored by its identity (human: blue, mouse: red, mixed: green). c. Bar plot showing nucleotide substitution rates in 4sU labeled K562 cells. Untreated, control cells that were not chemically treated. d. Boxplots showing the fraction of 4sU-labeled transcript (UMI) per cell in untreated (n=193 cells) and TFEA/NaIO4-treated (n=202 cells) K562 cells. See ‘Data visualization’ in the Methods for definitions of boxplot elements.
Fig. 2
Fig. 2. scNT-Seq captures newly synthesized transcriptomes and time-resolved regulon activity in response to neuronal activation.
a. UMAP visualization of 20,547 mouse cortical cells colored by their cell-types. Fractions of each cell-type are shown on the left. Ex, excitatory neurons; Inh, inhibitory neurons; NP, neural progenitors; RG, radial glial cells. b. PCA plots showing excitatory neurons and non-neuronal cells at resting (0 min: red) or stimulated (120 min: blue) states based on their newly-synthesized transcriptomes (new RNAs), pre-existing transcriptomes (old RNAs), whole transcriptomes (total RNAs), and new-to-total RNA ratios. 200 cells (with >1,000 genes detected per cell) were randomly chosen from excitatory neurons or non-neuronal cells (Ex-NP1, Ex-NP2 and RG) at the two time points. Density of dots was indicated by contour lines. c. Line plot showing cell-type specific new and old RNA expression for select activity-induced genes in response to distinct activation durations. The mean new and old RNA levels were scaled by library size (TP10K, Transcripts Per 10,000 transcript/UMI counts). d. Clustered heatmap showing cell-type-specific regulon activity of 79 TFs in response to distinct activity durations, concurrently inferred from either new or old RNAs. 18 activity-dependent regulons were associated with significantly increased new RNA levels of their target genes in at least one cell-type (adjusted P <0.05 and fold change >1.5) after KCl stimulation. Two-sided Wilcoxon rank sum test was used to assess significance of the difference. P-values were adjusted by Bonferroni correction. The P-value and regulon activity of each TF are in Source Data Fig.2 and Supplementary Table 3, respectively. e. Boxplots showing cell-type-specific regulon activity (inferred from either new or old RNAs) of Jun and Maff in response to distinct activity durations. Cell number, Ex: n = 1,422 (0 min), 2,678 (15 min), 2,884 for (30 min), 4,664 (60 min) and 1,863 (120 min); Ex-NP: n = 147 (0 min), 169 (15 min), 218 (30 min), 391 (60 min) and 177 (120 min); Inh1: n = 146 (0 min), 244 (15 min), 311 (30 min), 428 (60 min) and 166 (120 min); Inh-NP: n = 7 (0 min), 3 for (15 min), 12 for (30 min), 20 (60 min) and 19 (120 min). See ‘Data visualization’ in the Methods for definitions of box-plot elements.
Fig. 3
Fig. 3. Metabolic labeling-based RNA velocity analysis of rapid changes in transcriptional states.
a. UMAP visualization of Ex neurons (n=3,066 cells, with >2,000 genes detected per cell) that were characterized by standard splicing kinetics-based (left) or metabolic labeling-based RNA velocity (right) analyses. Cells are color-coded by time points. The streamlines indicate the integration paths that connect local projections from the observed state to extrapolated future state. UMAP plots in lower panels (same as upper panels) show randomized velocity controls for splicing- or metabolic labeling-based RNA velocity. The thickness of streamline indicates the velocity rate. b. UMAP (same as right of a) visualization of Ex neurons colored by the average new RNA expression level (natural log transformation of (TP10K + 1)) of 24 early- (left) or 73 late-response (right) genes. c. Dot plot showing enrichment of 24 early- or 73 late-response genes in activity-dependent TF regulon targets from all Ex neurons (n=13,511 cells, with >500 genes detected per cell). The predicted regulon target genes were used as background for calculating statistical significance. The significance of enrichment is determined by a two-sided Fisher’s exact test. The size of dots is scaled by -log10 (FDR adjusted P-value), and significant regulons (adjusted P<0.05) are color-coded for early- (in red) or late-response (in blue) genes. The P-values are in Source Data Fig.3. d. UMAP (same as right of a) showing Ex neurons colored by the regulon activity of three representative TFs (Jun, Mef2d, and Maff).
Fig. 4
Fig. 4. scNT-Seq reveals mRNA regulatory strategies during stem cell state transition.
a. Design of pulse-chase scNT-Seq experiments. b. UMAP visualization of 20,059 mESCs colored by three stem cell states (left) or by 7 time points during chase (right). Cell numbers of each state across 7 time points are also shown. c. Line plots showing changes in nucleotide substitution rates across 7 time points of pulse-chase. d. Scatter plots showing Pearson’s correlation of RNA half-life measurements (n=1,926 genes) between this study (top: one timepoint inference (4sU, 4 hours); bottom: multiple timepoint pulse chase) and bulk SLAM-Seq in mESCs. e. Clustered heatmaps of estimated synthesis rates (left), degradation rates (middle), and observed total RNA levels (right) of 445 genes across three stem cell states. The values in intermediate or 2C-like states were normalized to the pluripotent state. Also shown are RNA regulatory strategies (cooperative, 110 genes; neutral, 136 genes; destabilizing, 199 genes) colored-coded by similarity between the synthesis and degradation rates. Rightmost panel shows four representative genes with their raw synthesis/degradation rates and total RNA levels indicated. The synthesis rate, degradation rate, total RNA abundance, and regulatory strategy of each gene are in Supplementary Table 5.
Fig. 5
Fig. 5. Analysis of time-resolved regulon activities and TET-dependent regulation of the stepwise plutipotent-to-2C transition.
a. Experimental scheme of identifying time-resolved regulon activity across stem cell states. b. Line plots showing the fold changes of new and old RNA abundance of Tet1 and Zscan4d genes in intermediate and 2C-like states relative to pluripotent states. c. Clustered heatmaps showing regulon activities inferred from new and old RNA levels across three stem cell states. d. UMAP visualization of WT (n=4,633 cells) and Tet-TKO (n=2,319 cells) mESCs colored by genotypes (left) or stem cell states (right). e. Fractions of three stem cell states in two biological replicates of WT and Tet-TKO mESC cultures. f. Volcano plots showing genes differentially expressed between WT and Tet-TKO in three stem cell states. Genes significantly up-regulated (red) or down-regulated (blue) in Tet-TKO cells were identified by a two-sided Wilcoxon rank sum test (Bonferroni adjusted P-value <0.05). Note that both Tet1 and Tet2 genes were significantly decreased in Tet-TKO cells. Cell number, WT: n = 4,532 (pluripotent), 47 (intermediate), 30 (2C-like); Tet-TKO: n = 2,168 (pluripotent), 51 (intermediate), 53 (2C-like). The list of differentially expressed genes and their P-values are in Supplementary Table 6. g. Gene ontology enrichment analysis of genes significantly down- or up-regulated in Tet-TKO mESCs (in pluripotent state). Significance of enrichment was determined with a hypergeometric test and color-scaled by -Log10(FDR adjusted P-value). The P-values are in Source Data Fig.5.
Fig. 6
Fig. 6. Second strand synthesis reaction enhances the efficiency of scNT-Seq.
a. The second strand synthesis (2nd SS) reaction workflow in scNT-Seq. b. Scatterplots comparing the number of gene (y-axis, upper panel) or UMI (y-axis, lower panel) detected per cell as a function of aligned reads per cell (x-axis) between 4sU (n=692 cells), TFEA (n=447 cells), 4sU/TFEA (n=533 cells), 4sU/2nd SS (n=515 cells), TFEA/2nd SS (n=400 cells), and 4sU/TFEA/2nd SS (n=795 cells) experiments. 4sU, metabolic labeling with 4sU (100 μM, 4 h); TFEA, on-bead TFEA/NaIO4 chemical reaction; 2nd SS, second strand synthesis reaction. The fitted lines for each experiment were shown. Right panels show estimated numbers of gene or UMI detected per cell at matching sequencing depth (50,000 reads per cell) for different experiments. c. Scatterplots showing Pearson’s correlation for new (left), old (middle) RNA abundance and new-to-total RNA ratio (right) between standard (4sU/TFEA) and 2nd SS (4SU/TFEA/2nd SS) scNT-Seq protocols. Levels of new and old RNAs are in natural log transformation of (TP10K + 1). d. PCA plots showing K562 cells colored by cell-cycle states (top) or experiments (bottom).

References

    1. Rabani M et al. Metabolic labeling of RNA uncovers principles of RNA production and degradation dynamics in mammalian cells. Nat Biotechnol 29, 436–442 (2011). - PMC - PubMed
    1. Rabani M et al. High-resolution sequencing and modeling identifies distinct dynamic RNA regulatory strategies. Cell 159, 1698–1710 (2014). - PMC - PubMed
    1. Tanay A & Regev A Scaling single-cell genomics from phenomenology to mechanism. Nature 541, 331–338 (2017). - PMC - PubMed
    1. Herzog VA et al. Thiol-linked alkylation of RNA to assess expression dynamics. Nature methods 14, 1198–1204 (2017). - PMC - PubMed
    1. Schofield JA, Duffy EE, Kiefer L, Sullivan MC & Simon MD TimeLapse-seq: adding a temporal dimension to RNA sequencing through nucleoside recoding. Nature methods 15, 221–225 (2018). - PMC - PubMed

Publication types