. 2020 Oct;23(10):1240-1252.
doi: 10.1038/s41593-020-0695-6. Epub 2020 Aug 31.

A prefrontal-paraventricular thalamus circuit requires juvenile social experience to regulate adult sociability in mice

Affiliations

A prefrontal-paraventricular thalamus circuit requires juvenile social experience to regulate adult sociability in mice

Kazuhiko Yamamuro et al. Nat Neurosci. 2020 Oct.

Abstract

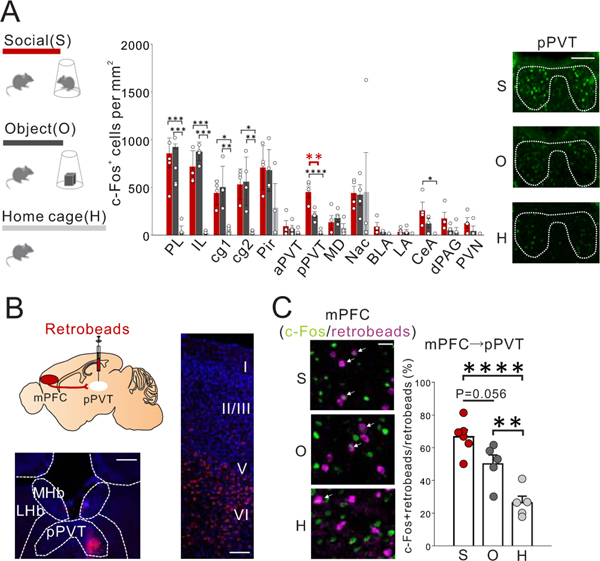
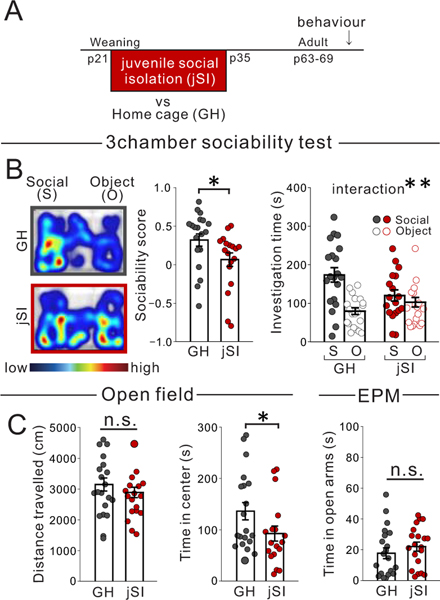
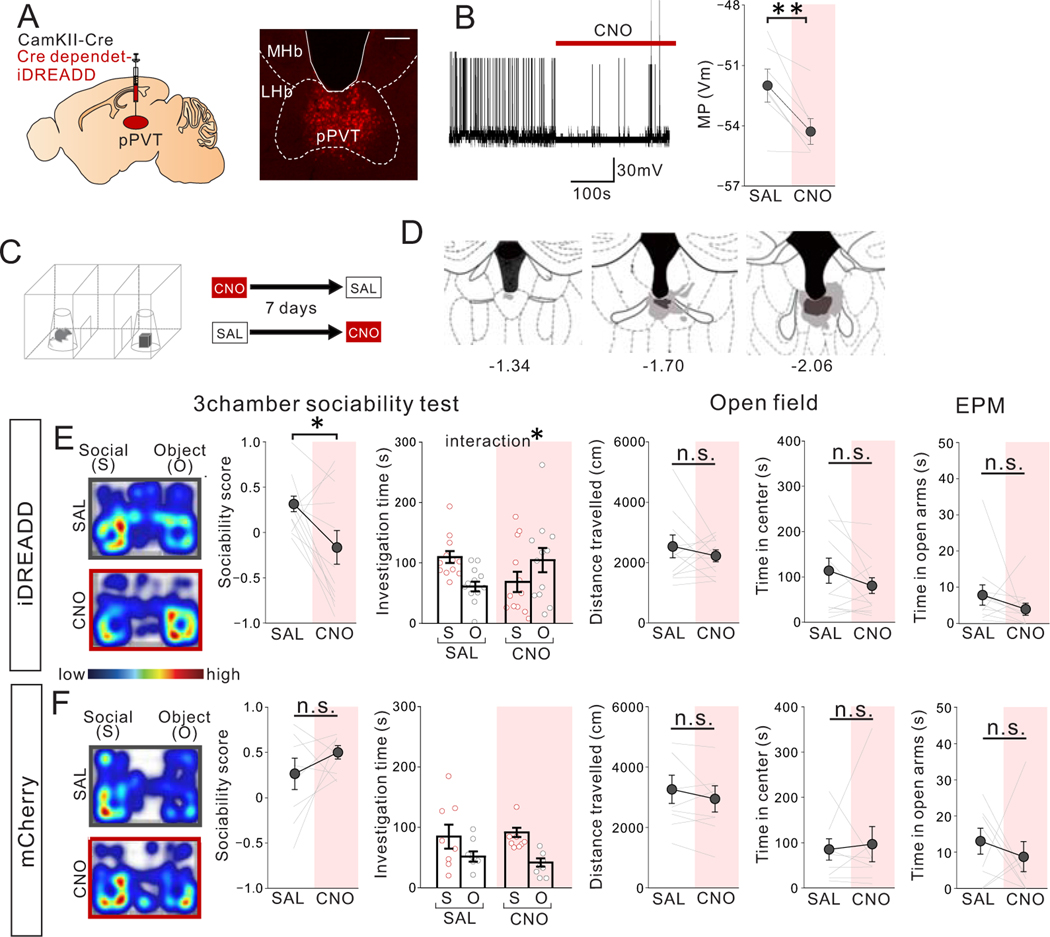
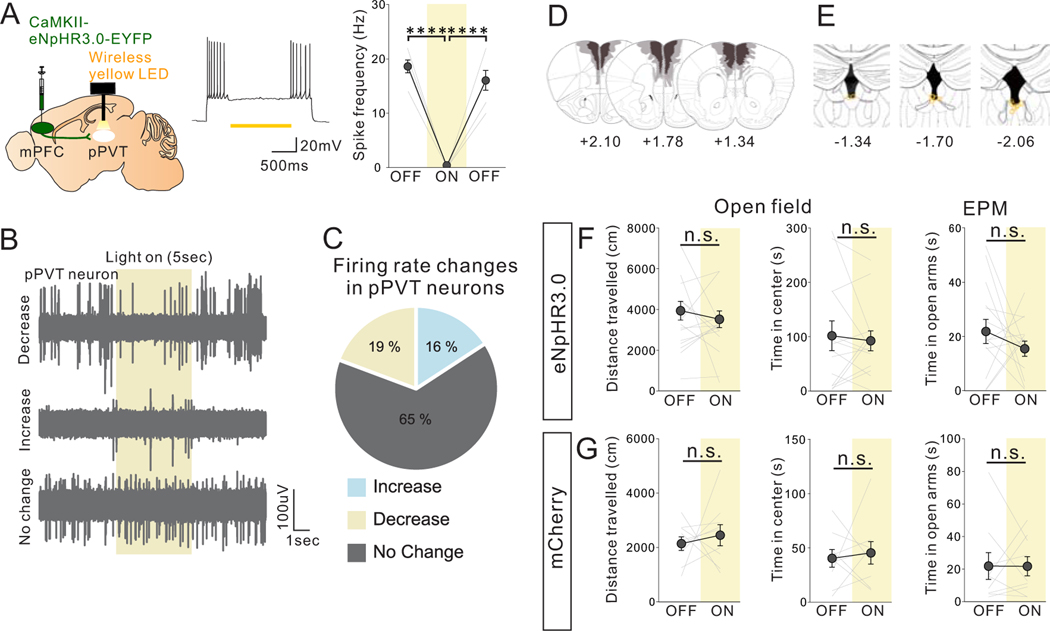
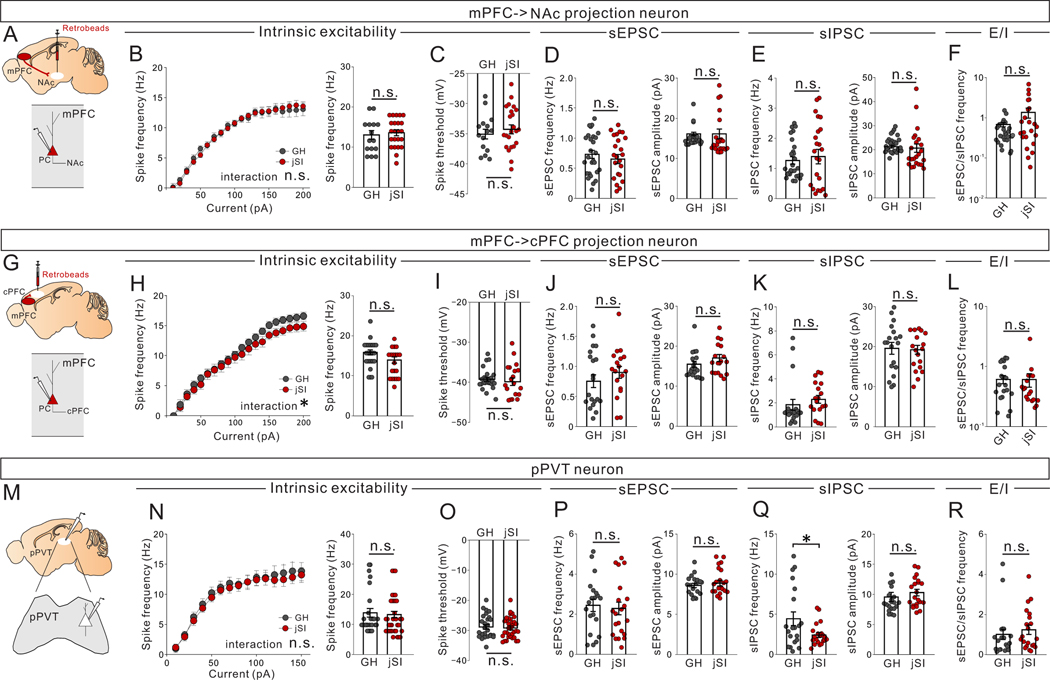
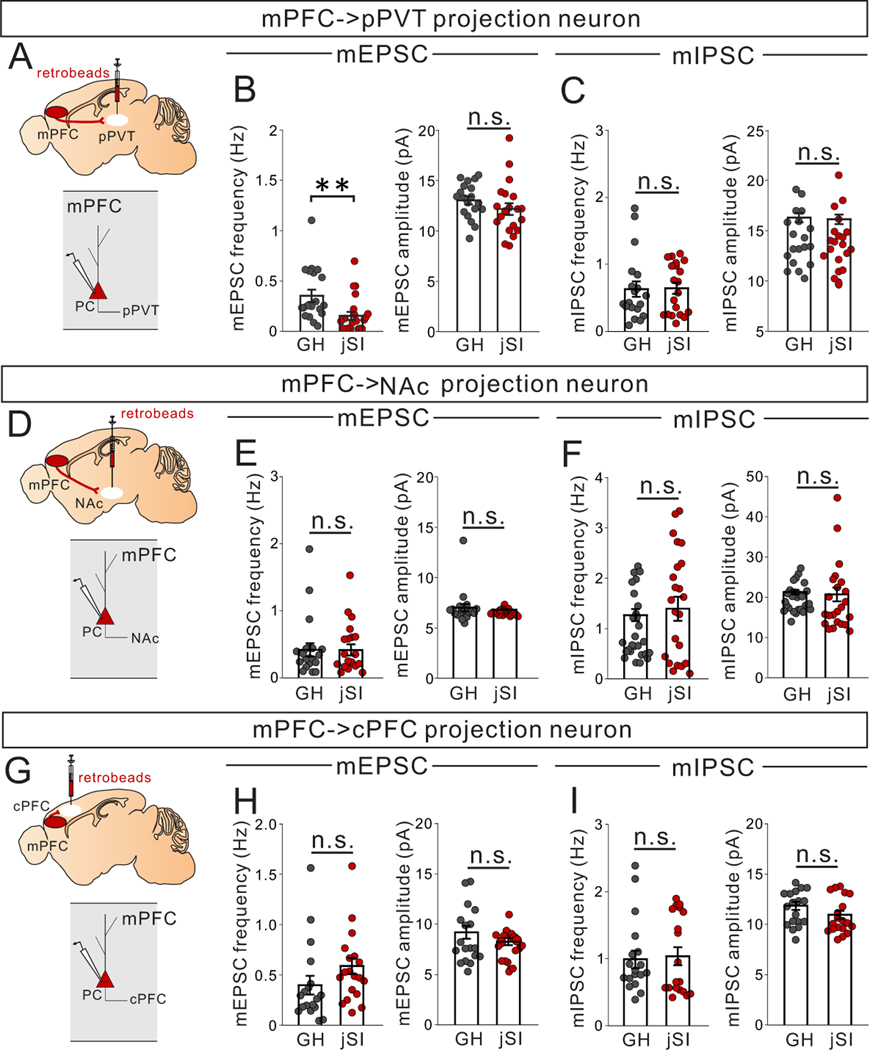
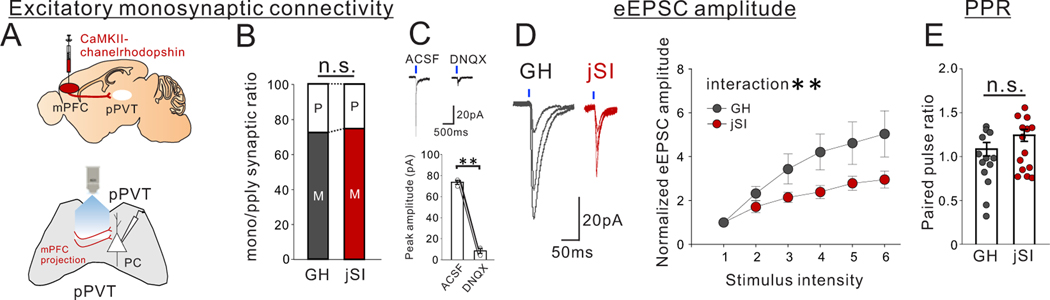
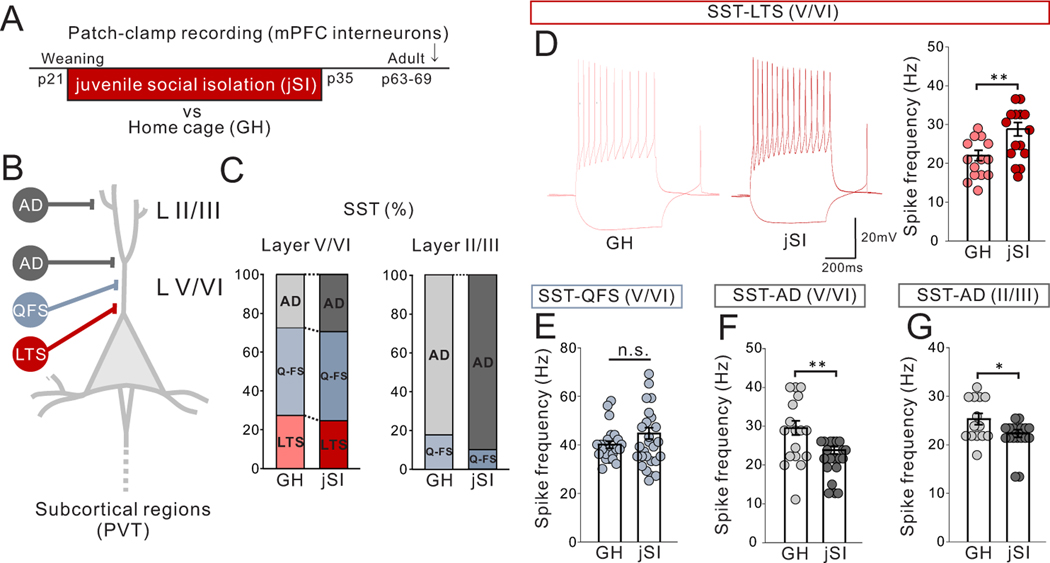
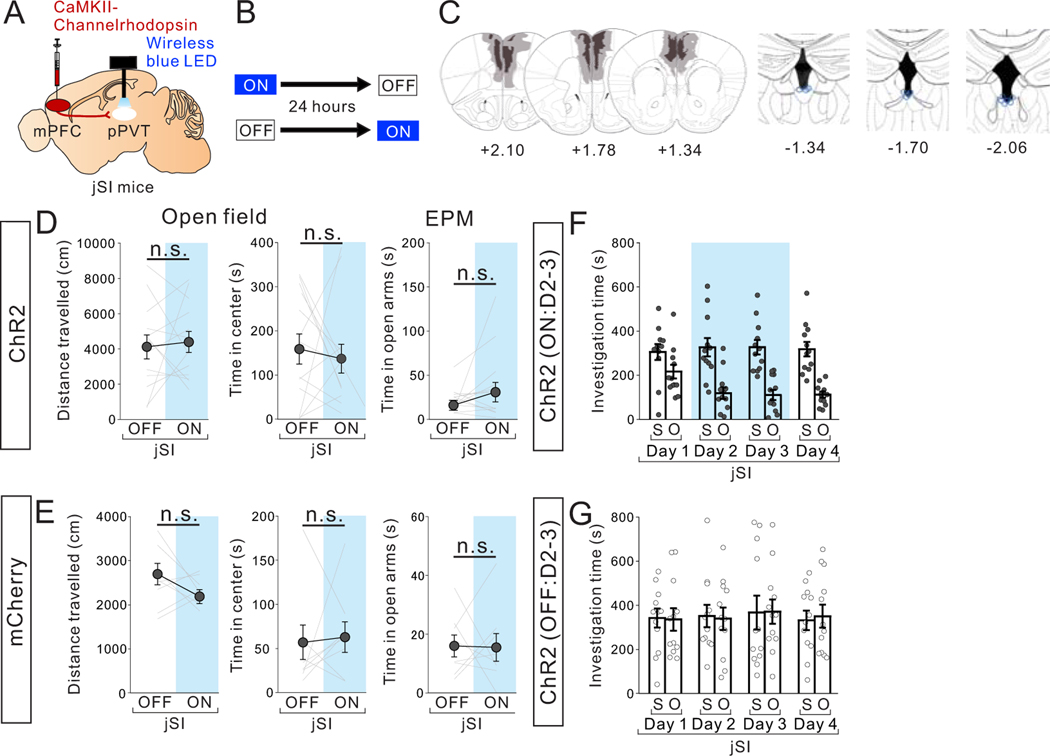
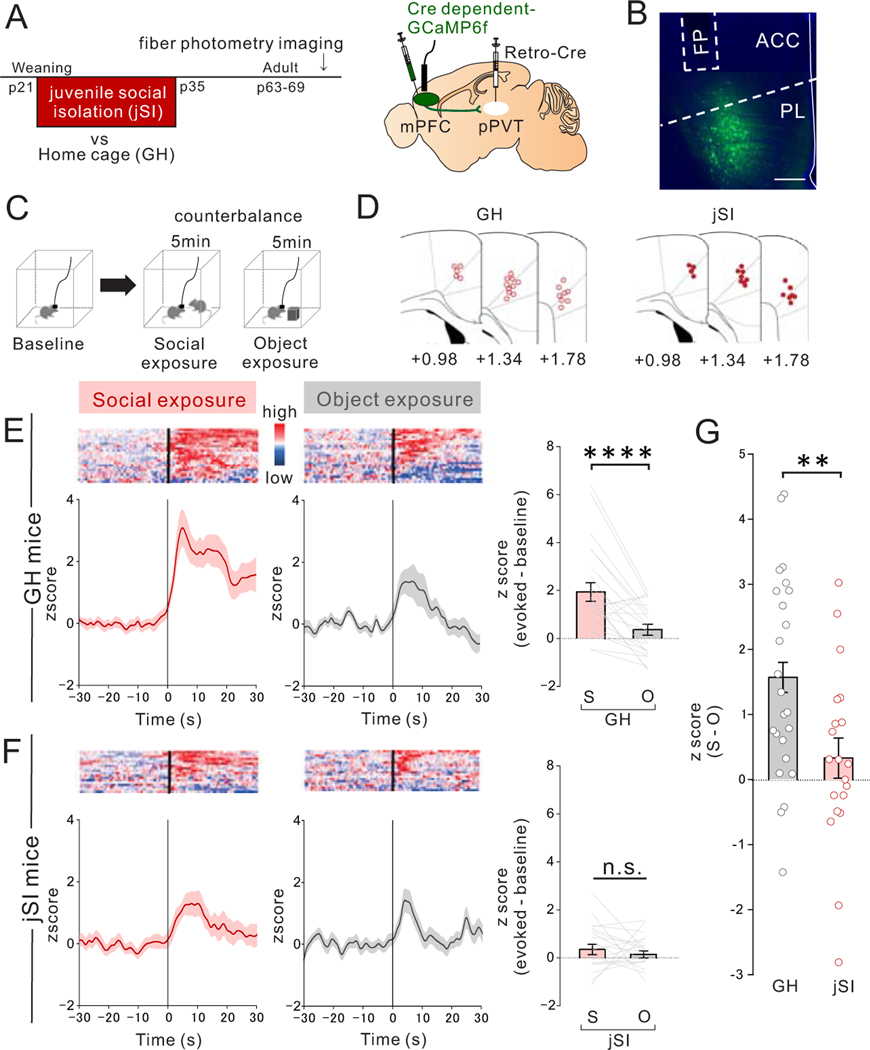
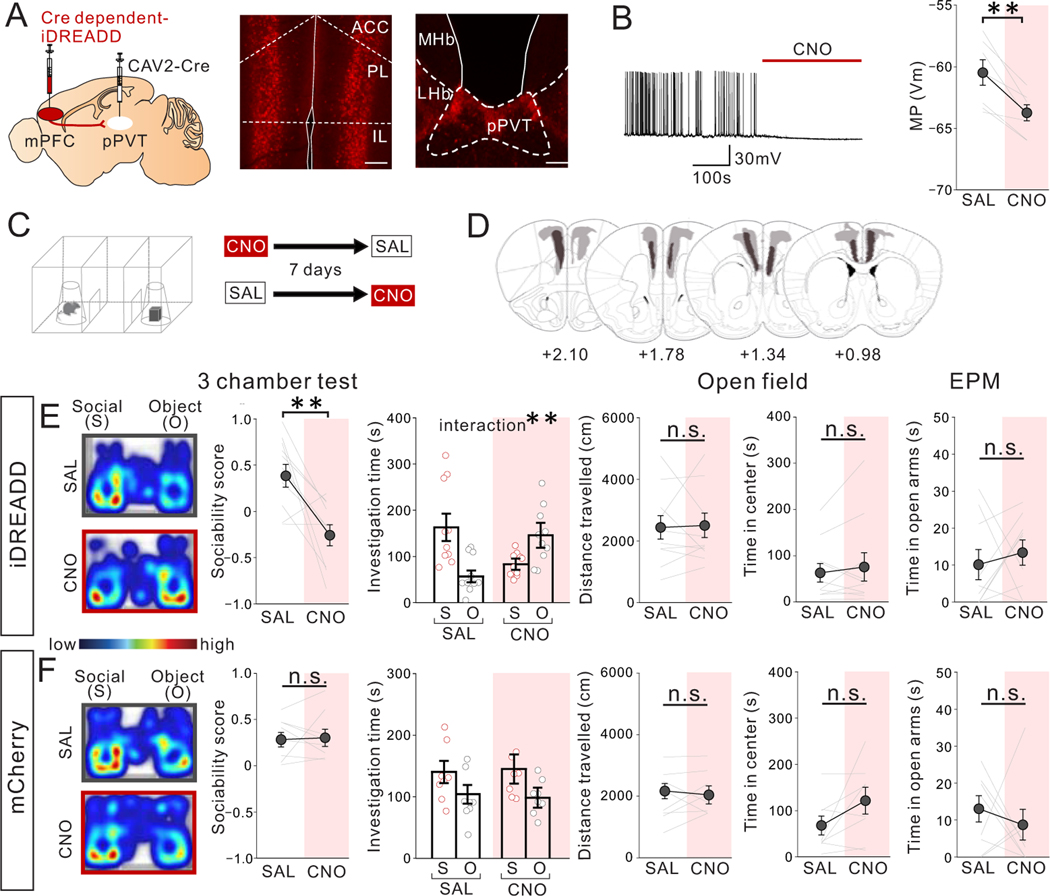
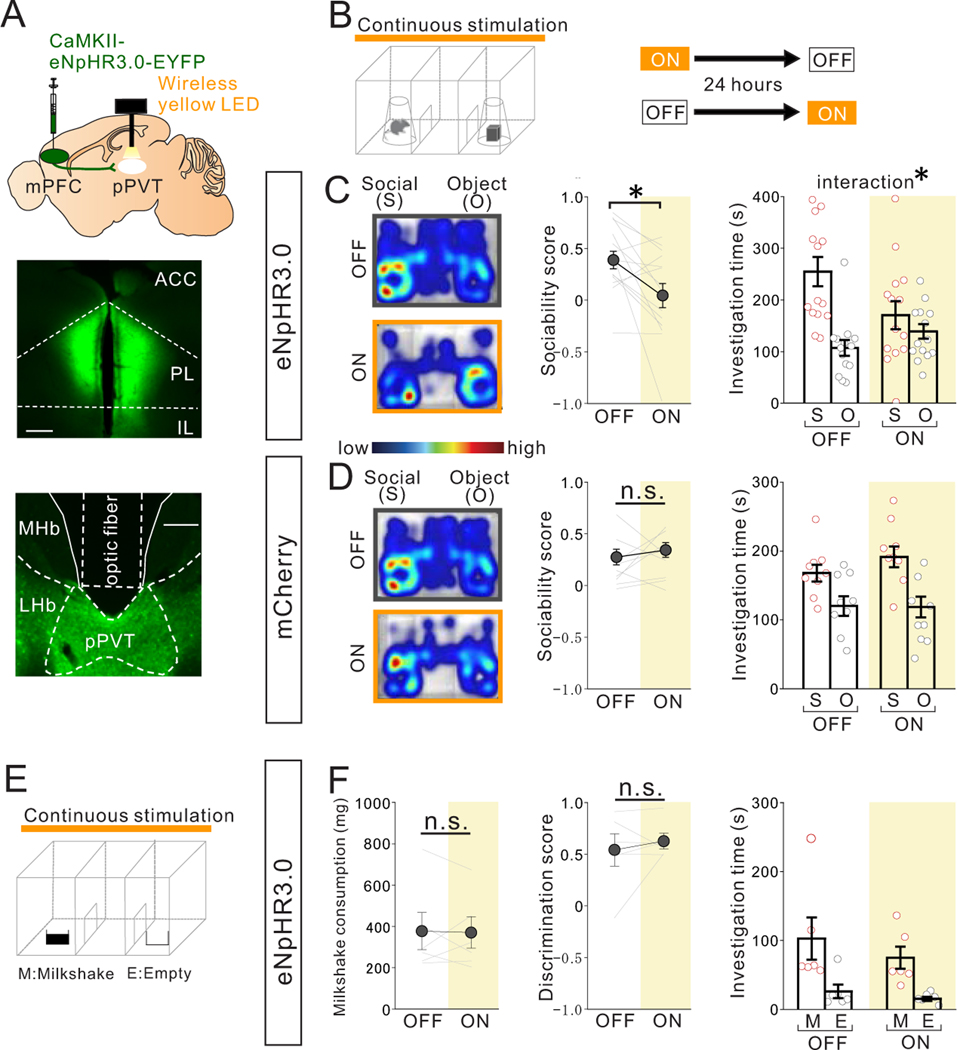
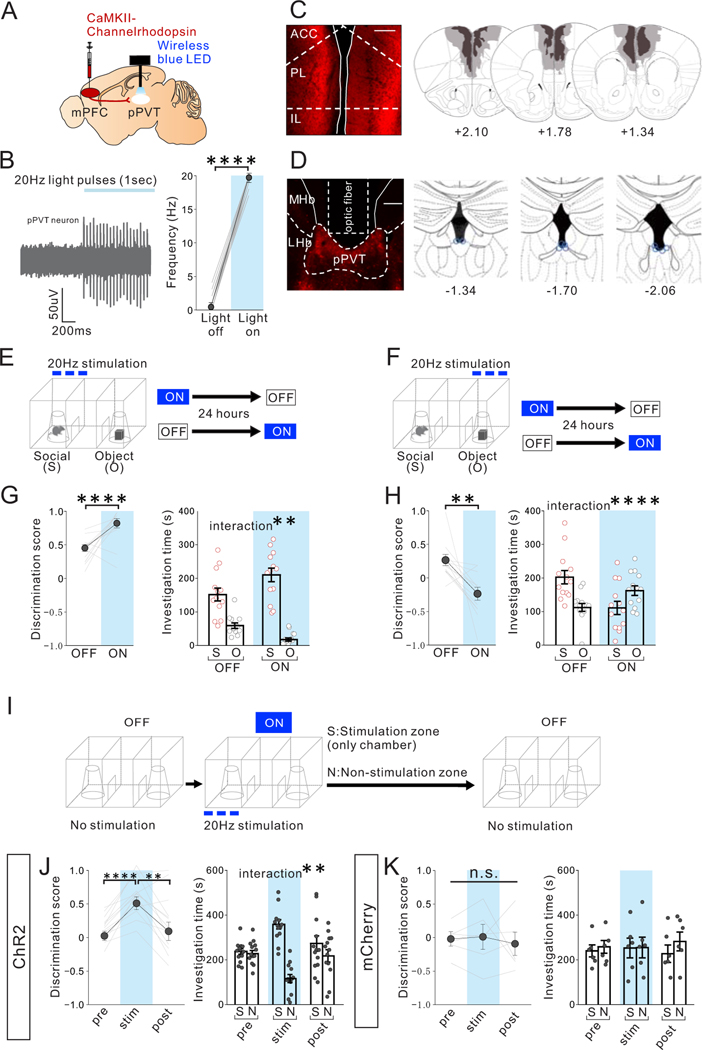
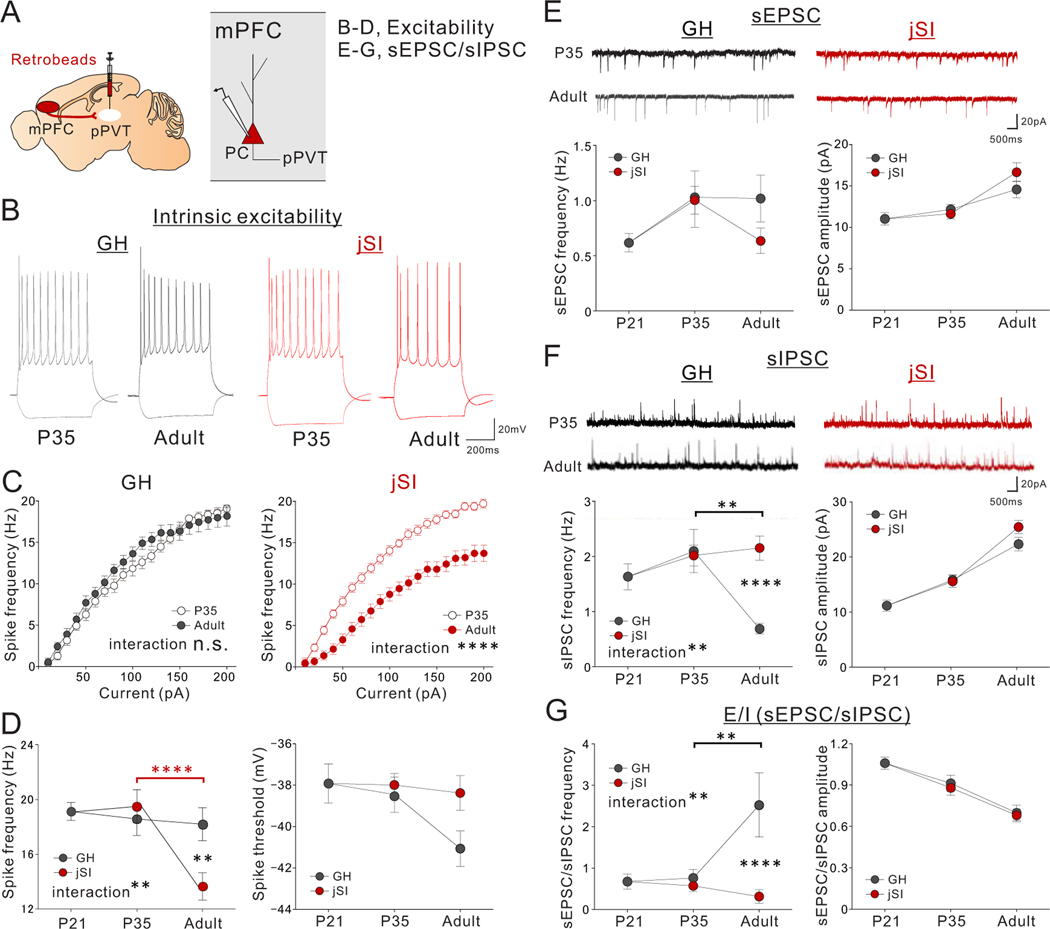
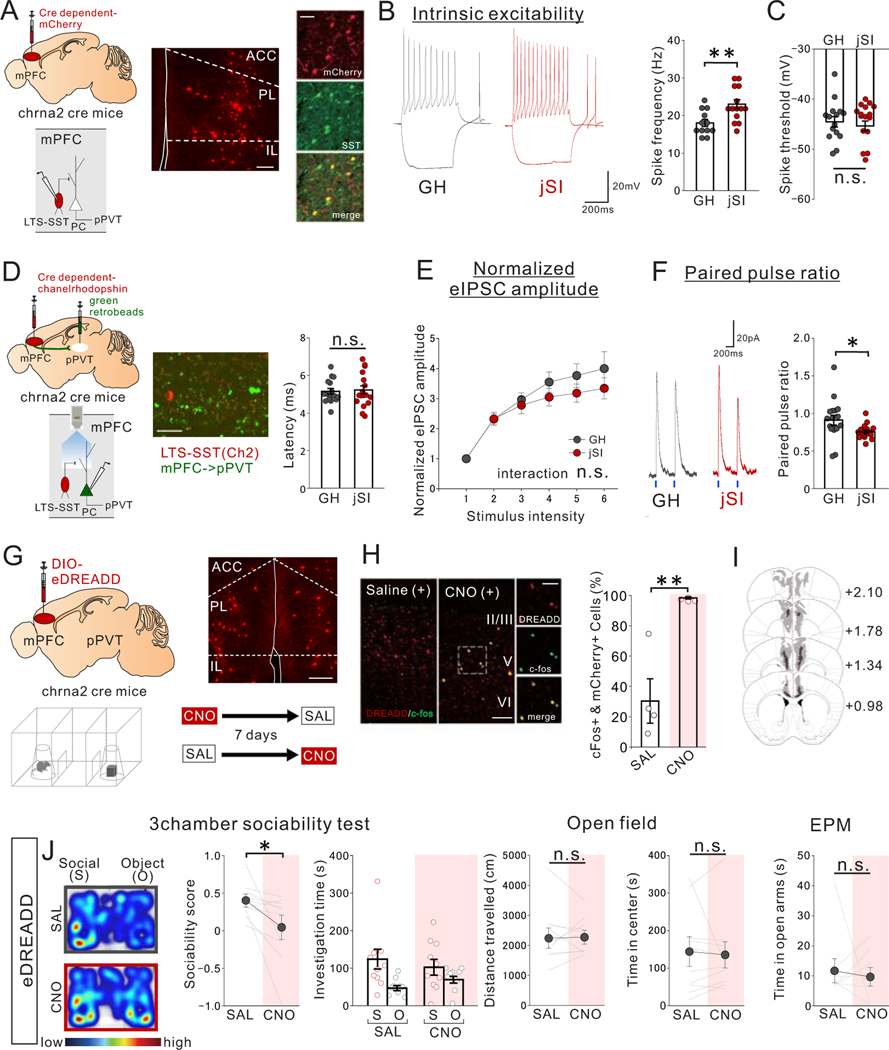
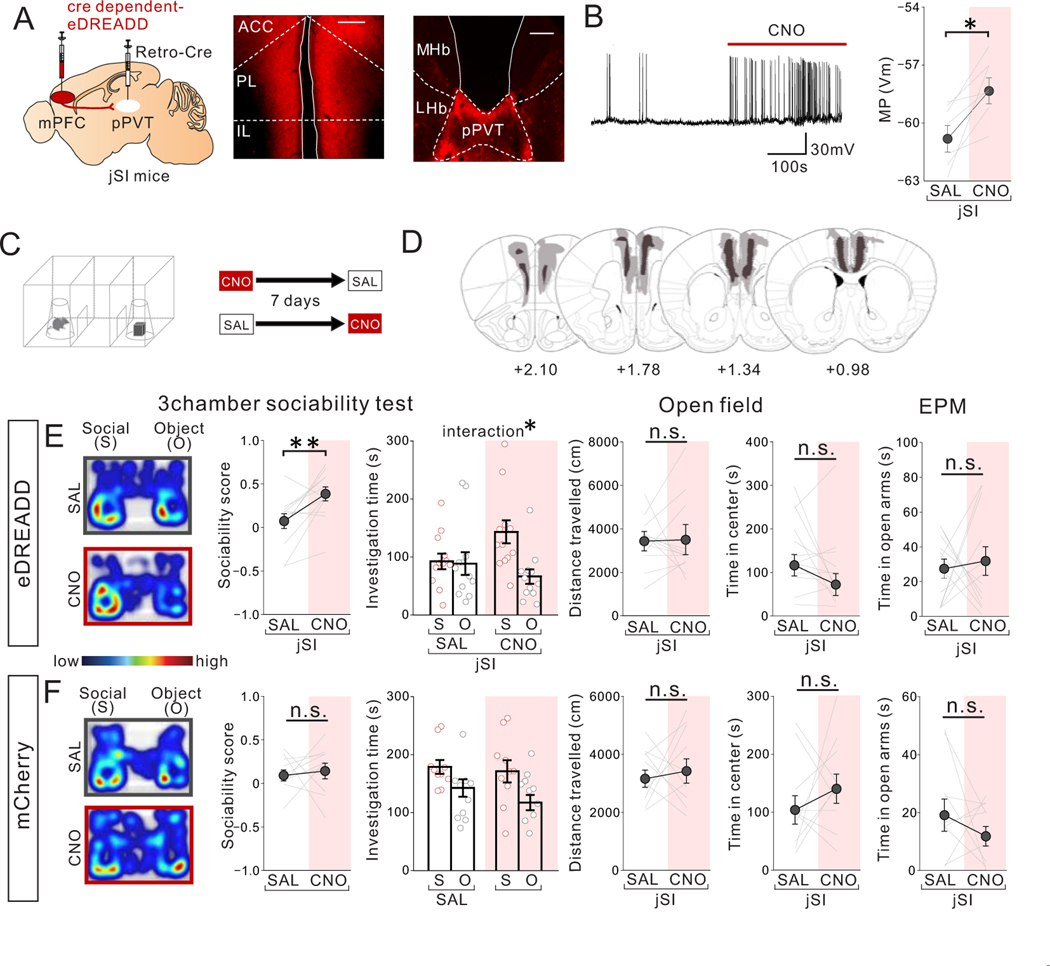
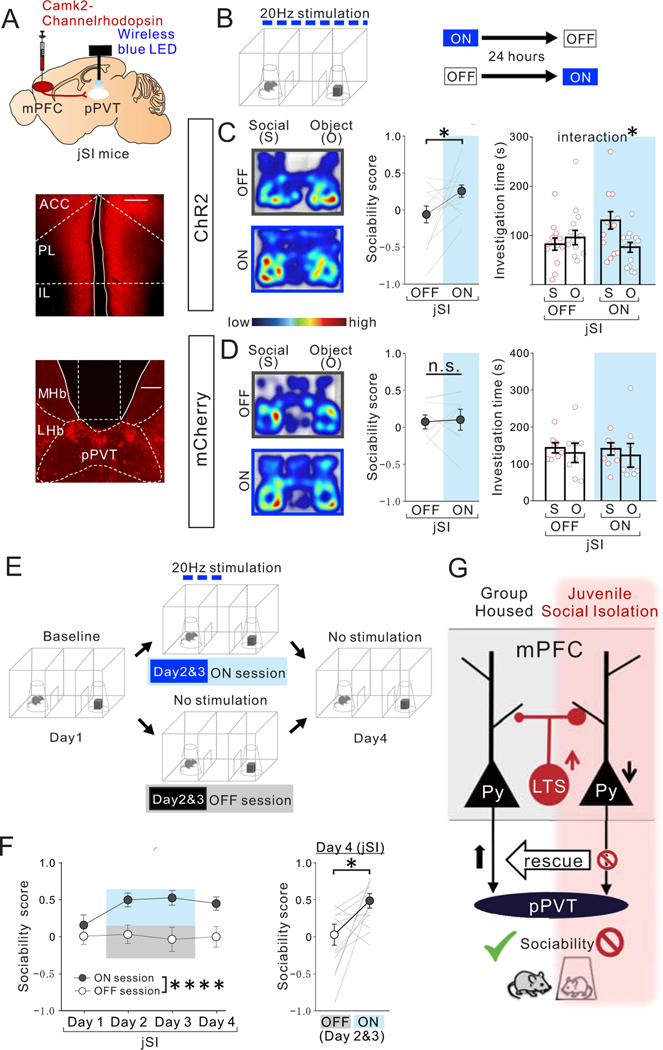
Juvenile social isolation reduces sociability in adulthood, but the underlying neural circuit mechanisms are poorly understood. We found that, in male mice, 2 weeks of social isolation immediately following weaning leads to a failure to activate medial prefrontal cortex neurons projecting to the posterior paraventricular thalamus (mPFC→pPVT) during social exposure in adulthood. Chemogenetic or optogenetic suppression of mPFC→pPVT activity in adulthood was sufficient to induce sociability deficits without affecting anxiety-related behaviors or preference toward rewarding food. Juvenile isolation led to both reduced excitability of mPFC→pPVT neurons and increased inhibitory input drive from low-threshold-spiking somatostatin interneurons in adulthood, suggesting a circuit mechanism underlying sociability deficits. Chemogenetic or optogenetic stimulation of mPFC→pPVT neurons in adulthood could rescue the sociability deficits caused by juvenile isolation. Our study identifies a pair of specific medial prefrontal cortex excitatory and inhibitory neuron populations required for sociability that are profoundly affected by juvenile social experience.


Conflict of interest statement

Competing interests: Authors have no competing interests as defined by Nature Research, or other interests that might be perceived to influence the results and/or discussion reported in this paper.

Figures

Extended Data Fig. 1
Extended Data Fig. 1. c-Fos mapping of cortical and sub-cortical regions upon social exposure.
(A) (left) Mice were exposed in a 3-chamber apparatus for 10 min to either a novel mouse (social:S) under a wire corral, a novel object (object:O) under a wire corral, or kept in their home cage (HC), and then perfused 90 min after the end of the exposure. Brains were then stained for c-Fos, a marker of neuronal activity. (middle) Among many brain areas, including several areas that are known to be involved in social behavior, the posterior PVT (pPVT) showed significant c-Fos induction in social groups compared with both object and homecage groups. (one-way ANOVA, F2,9=34.02, P=0.636×10⁻⁴ followed by a Tukey’s post hoc test: pPVT:, social vs object: **P=0.003, social vs home cage: ****P=0.468×10⁻⁴, n=4 biologically independent mice each) *P<0.05, **P<0.01, ***P<0.001. (right) Representative c-Fos staining images from pPVT. Scale bar: 200um. Experimental images were obtained from each 12 mice, a few images per mouse, with similar results obtained. (B) (upper left) mPFC->pPVT projection neurons were labeled by retrobeads injected into the pPVT. Representative images showing (right) beads in layer 5/6 mPFC->pPVT neurons (scale bar: 100um), and (bottom left) beads at injection site in pPVT (scale bar: 200um). Experimental images were obtained from 16 mice, a few images per mice, with similar results obtained. (C) (left) Representative images showing preferential c-Fos induction in mPFC->pPVT neurons by social exposure (Scale bar: 50um, experimental images were obtained from 16 mice, a few images per mice, with similar results obtained), and (right) quantification (one-way ANOVA, F2,13=19.750, P=0.115×10⁻³, followed by a Tukey’s post hoc test, Social vs object P=0.056, Object vs home cage **P=0.009, Social vs home cage ****P=0.789×10⁻⁴: n=6 biologically independent social exposed mice, n=5 biologically independent object exposed mice, n=5 biologically independent home caged mice). PL: prelimbic cortex, IL: infralimbic cortex, cg1/2: cingulate cortex1/2, Pir: Piriform cortex, aPVT: anterior paraventricular thalamus, pPVT: posterior paraventricular thalamus, MD: medial dorsal thalamus, Nac: nucleus accumbens, BLA: basolateral amygdala, LA: lateral amygdala, CeA: central amygdala, dPAG: dorsal periaqueductal gray, PVN: paraventricular nucleus of hypothalamus. Data in A, C are presented as mean +/− s.e.m.
Extended Data Fig. 2
Extended Data Fig. 2. Juvenile social isolation leads to long lasting reduction of sociability in adult mice.
(A) Timeline showing weaning at p21 and subsequent 2 weeks of juvenile social isolation (jSI), followed by re-housing or control group housing (GH). (B) jSI mice showed reduced sociability scores vs GH mice in a 3 chamber task, in which a mouse chooses between a social target and an object, and time spent investigating both is measured and compared (two tailed t-test, t36=2.154, *P=0.038, n=20 biologically independent GH mice, n=18 biologically independent jSI mice) and reduced social interaction (two-way RM ANOVA, housing (GH/jSI) × stimulus (social/object) interaction F1,36 = 7.042, *P=0.012, effect of housing F1,36 = 1.117, P=0.298, effect of stimulus F1,36 = 14.860, P=0.460×10⁻³, n=20 biologically independent GH mice, n=18 biologically independent jSI mice) (C) jSI mice showed no difference in distance traveled during the open field test (two tailed t-test, t36=0.939, P=0.354, n=20 biologically independent GH mice, n=18 biologically independent jSI mice), suggesting normal motor activity. While jSI mice showed reduce time in center during open field test (two tailed t-test, t36=2.054, *P=0.047, n=20 biologically independent GH mice, n=18 biologically independent jSI mice), they showed no difference in an independent anxiety task (elevated plus maze (EPM: two tailed t-test, t38=0.926, P=0.360, n=20 biologically independent GH mice, n=18 biologically independent jSI mice). Data in B, C are presented as mean +/− s.e.m.
Extended Data Fig. 3
Extended Data Fig. 3. Chemogenetic suppression of pPVT neuron activity reduces sociability in adult group-housed mice.
(A) (left) AAV8-DIO-iDREADD (or mCherry) was injected together with AAV1-CaMKII-Cre in the pPVT. (right) A representative image shows selective transduction at injection areas of pPVT. Scale bar: 300um. Experimental images were obtained from 12 mice, three images per mouse, with similar results obtained. (B) Validation of iDREADD action in pPVT neurons by slice whole-cell patch clamp recording. (left) A representative trace shows that bath application of CNO significantly decreases membrane potential of pPVT neurons. Traces were recorded from 7 cells from 3 biologically independent mice, with similar results obtained. (Right) Quantification shows a reduction in membrane potential after CNO application (two tailed paired t-test, t6=4.177, **P=0.006, n=7cells from 3 biologically independent mice). (C) Mice were treated with saline (SAL) or CNO (10mg/kg) and then underwent the 3 chamber test of sociability. For CNO and SAL injections, order is counter-balanced. (D) Viral spread validation at injection areas of pPVT from post-behavioral testing mice. Gray areas represent the minimum (lighter colour) and the maximum (darker colour) spread of iDREADD into the pPVT. (E) (left) CNO-treated iDREADD+ mice showed reduced sociability, revealed by reduced sociability scores vs. SAL (two tailed paired t-test, t11=2.257, *P=0.045, n=12 biologically independent mice), and disrupted behavior in 3 chamber sociability task (two-way RM ANOVA, housing (GH/jSI) × stimulus (social/object) interaction F1,22 = 4.894, *P=0.038, effect of drug F1,22 = 0.032, P=0.859, effect of stimulus F1,22 = 0.109, P=0.745, n=12 biologically independent mice). (right) iDREADD+ mice showed no differences in motor activity or anxiety-related behaviors (Left; two tailed paired t-test, t11=0.688, P=0.506, n=12 biologically independent mice Middle; two tailed paired t-test, t11=1.604, P=0.137, n=12 biologically independent mice, Right; two tailed paired t-test, , t10=1.096, P=0.299, n=11 biologically independent mice) as a result of CNO vs. SAL treatment. (F) (left) Control mCherry+ mice showed no difference in sociability score (two tailed paired t-test, t7=1.459, P=0.188, n=8 biologically independent mice) or investigation time (two-way RM ANOVA, housing (GH/jSI) × stimulus (social/object) interaction F1,14 = 0.352, P=0.563, effect of drug F1,14 = 0.024, P=0.880, effect of stimulus F1,14 = 8.630, *P=0.011, n=8 biologically independent mice) as a result of CNO vs. SAL treatment. (right) Control mCherry+ mice showed no difference in motor activity or anxiety-related behaviors (Left; two tailed paired t-test, t7=0.981, P=0.359, n=8 biologically independent mice, Middle; two tailed paired t-test, t7=0.317, P=0.761, n=8 biologically independent mice Right: two tailed paired t-test, t7=0.662, P=0.529, n=8 biologically independent mice). Data in B, E, F are presented as mean +/− s.e.m.
Extended Data Fig. 4
Extended Data Fig. 4. Optogenetic suppression of mPFC->pPVT projection terminals does not change motor activity or anxiety-related behaviors in group-housed mice.
(A) (left) Halorhodopsin NpHR3.0 AAV under CamKII promotor was injected into mPFC and mPFC->pPVT projection terminals were illuminated at the pPVT using a wireless yellow LED system for behavioral testing. (middle/right) Validation of optogenetic suppression by patch-clamp recording from halorhodopsin NpHR3-expressing mPFC->pPVT projection neurons. (middle) Representative trace showing decreased action potential of mPFC->pPVT projection neurons upon optogenetic stimulation (traces were recorded from 7 cells from 3 biologically independent mice, with similar results obtained), and (right) quantification (one-way RM ANOVA, F1.521,9.124 = 91.94, P=0.167×10⁻⁵, Tukey’s multiple comparisons test: 1st OFF vs ON, ****P=0.114×10⁻⁴, ON vs 2nd OFF, ****P=0.328×10⁻³, n=7 cells from 3 biologically independent mice,). (B-C) In vivo validation of optogenetic suppression of mPFC->pPVT projection terminals. (B) Representative in vivo recordings of pPVT neurons showing a significant decrease (top), increase (middle), or no change (bottom) in spike activity upon yellow light delivery over mPFC->pPVT projection terminals expressing halorhodopsin NpHR3 in pPVT. Experimental traces were obtained from 4 mice,13–16 cells per mouse, with similar results obtained. (C) Distribution of pPVT neurons showing light-induced decreased firing (11 out of 57 cells from 4 biologically independent mice, 19%), increased firing (9 out of 57 cells from 4 biologically independent mice, 16%), or no change (37 out of 57 cells from 4 biologically independent mice, 65%). Effect of light stimulation for each unit was quantified by comparing the firing rates between light off period and light on period (5 s each) of 6 sessions per cell through paired t-test. (D) Viral spread validation of NpHR3-expression from post-behavior testing mice at injection areas. Gray areas represent the minimum (lighter colour) and the maximum (darker colour) spread of NpHR3- expression in the mPFC. Experimental images were obtained from 14 mice, three images per mouse, with similar results obtained. (E) Optic fiber location (yellow line circles) was validated in all mice. Experimental images were obtained from 14 mice, three images per mouse, with similar results obtained. (F) Mice underwent open field testing, and elevated plus maze (EPM) with (ON) or without (OFF) light stimulation. ON and OFF session order was counter-balanced for each behavior test with a 24-hour interval between tests. Mice with optogenetic suppression showed no differences in motor activity or anxiety-related behaviors between ON and OFF sessions (Left; two tailed paired t-test, t13=0.747, P=0.469, n=14 biologically independent mice, Middle; two tailed paired t-test, t13=0.455, P=0.657, n=14 biologically independent mice, Right; two tailed paired t-test, t13=1.028, P=0.323, n=14 biologically independent mice). (G) Control mCherry+ mice showed no difference in motor activity or anxiety-related behaviors between light ON and OFF sessions (Left; two tailed paired t-test, n=9 biologically independent mice, t8=0.528, P=0.612, Middle; two tailed paired t-test, t8=0.361, P=0.727, n=9 biologically independent mice, Right; two tailed paired t-test, t8=0.017, P=0.987, n=9 biologically independent mice,). Data in A, F, G are presented as mean +/− s.e.m.
Extended Data Fig. 5
Extended Data Fig. 5. Juvenile social isolation does not change excitability, nor E/I input ratio of PFC->NAc neurons, mPFC->cPFC neurons, or pPVT neurons in adulthood.
(A-F) Whole-cell patch clamp recording from mPFC->NAc neurons in adult jSI or GH mice. (B, C) Assessment of intrinsic excitability of PFC->NAc neurons in the presence of DNQX, D-AP5, and picrotoxin. (B) (Left) Input-output curves showed no differences in spike frequency between jSI and GH mice (two-way RM ANOVA, housing (GH/jSI) x current step interaction F19,551 = 0.388, P=0.992, effect of housing F1,29 = 1.103, P=0.302, effect of current step F2.472, 71.70 = 161.200, P=0.001×10⁻¹², n=15 cells from 8 biologically independent GH mice, n=23 cells from 8 biologically independent jSI mice). (right) No significant differences in spike frequency at 200pA between jSI and GH (two tailed t-test, t36=0.399, P=0.692, n=15 cells from 8 biologically independent GH mice, n=23 cells from 8 biologically independent jSI mice) (C) No significant differences in spike threshold between jSI and GH (two tailed t-test, t36=−0.708, P=0.484, n=15 cells from 8 biologically independent GH mice, n=23 cells from 8 biologically independent jSI mice). No significant differences in (D) sEPSC frequency (two tailed t-test, t48=0.308, P=0.760, n=23 cells from 8 biologically independent jSI mice), sEPSC amplitude (two tailed t-test, t48=0.305, P=0.762, n=27 cells from 8 biologically independent GH mice, n=23 cells from 8 biologically independent jSI mice), (E) sIPSC frequency (two tailed t-test, t48=0.879, P=0.384, n=27 cells from 8 biologically independent GH mice, n=23 cells from 8 biologically independent jSI mice), sIPSC amplitude (two tailed t-test, t48=0.852, P=0.398, n=27 cells from 8 biologically independent GH mice, n=23 cells, from 8 biologically independent jSI mice), or (F) sEPSC/sIPSC frequency ratio (two tailed t-test, t48=1.767, P=0.084, n=27 cells from 8 biologically independent GH mice, n=23 cells from 8 biologically independent jSI mice) between jSI and GH. (G-L) Whole-cell patch clamp recording from mPFC->contralateral PFC projection neurons (cPFC) in adult jSI or GH mice. (H, I) Assessment of intrinsic excitability of PFC->cPFC neurons in the presence of DNQX, D-AP5, and picrotoxin. (H) (Left) Input-output curve showing no differences in spike frequency (two-way RM ANOVA, housing (GH/jSI) x current step interaction F19,798 = 1.861, *P=0.014, effect of housing F1,42 = 0.648, P=0.425, effect of current step F4.628, 194.4 = 395.9, P=0.001×10⁻¹², n=26 cells from 8 biologically independent GH mice, n=20 cells from 8 biologically independent jSI mice). (right) No significant differences in spike frequency at 200pA between jSI and GH (two tailed t-test, t44=1.650, P=0.106, n=26 cells from 8 biologically independent GH mice, n=20 cells from 8 biologically independent jSI mice). (I) No significant differences in spike threshold (two tailed t-test, t44=0.635, P=0.529, n=26 cells from 8 biologically independent GH mice, n=20 cells from 8 biologically independent jSI mice), (J) sEPSC frequency (two tailed t-test, t36=0.847, P=0.403, n=20 cells from 8 biologically independent GH mice, n=18 cells from 8 biologically independent jSI mice), sEPSC amplitude (two tailed t-test, t36=1.370, P=0.179, n=20 cells from 8 biologically independent GH mice, n=18 cells from 8 biologically independent jSI mice), (K) sIPSC frequency (two tailed t-test, t36=0.758, P=0.454, n=20 cells from 8 biologically independent GH mice, n=18 cells from 8 biologically independent jSI mice,), sIPSC amplitude (two tailed t-test, t36=0.493, P=0.625, n=20 cells from 8 biologically independent GH mice, n=18 cells from 8 biologically independent jSI mice), or (L) sEPSC/IPSC frequency (two tailed t-test, t36=0.147, P=0.884, n=20 cells from 8 biologically independent GH mice, n=18 cells from 8 biologically independent jSI mice) between jSI and GH. (M-R) Whole-cell patch clamp recording from pPVT neurons in adult jSI or GH mice. (N, O) Assessment of intrinsic excitability of pPVT neurons in the presence of DNQX (20μM), D-AP5 (50μM), and picrotoxin (30μM). (N) (Right) Input-output curve showing no differences in spike frequency (two-way RM ANOVA, housing (GH/jSI) x current step interaction F14,826 = 0.686, P=0.790, effect of housing F1,59 = 0.017, P=0.898, effect of current step F1.843, 108.7 = 93.580, P=0.001×10⁻¹², n=26 cells from 8 biologically independent GH mice, n=35 cells from 9 biologically independent jSI mice). (left) No significant differences in spike frequency at 200pA (two tailed t-test, t59=0.434, P=0.666, n=26 cells from 8 biologically independent GH mice, n=35 cells from 9 biologically independent jSI mice), (O) spike threshold (two tailed t-test, t59=0.376, P=0.708, n=26 cells from 8 biologically independent GH mice, n=35 cells from 9 biologically independent jSI mice), (P) sEPSC frequency (two tailed t-test, t39=0.356, P=0.724, n=20 cells from 8 biologically independent GH mice, n=21 cells from 9 biologically independent jSI mice), or sEPSC amplitude (two tailed t-test, t39=0.636, P=0.529, n=20 cells from 8 biologically independent GH mice, n=21 cells from 9 biologically independent jSI mice) between jSI and GH. (Q) sIPSC frequency was significantly higher in jSI mice compared to GH mice (two tailed t-test, t39=2.316, *P=0.026, n=20 cells from 8 biologically independent GH mice, n=21 cells from 9 biologically independent jSI mice), but no differences in sIPSC amplitude (two tailed t-test, t39=1.804, P=0.079, n=20 cells from 8 biologically independent GH mice, n=21 cells from 9 biologically independent jSI mice) were observed. (R) No significant differences in sEPSC/IPSC frequency from pPVT neurons (two tailed t-test, t39=0.682, P=0.499, n=20 cells from 8 biologically independent GH mice, n=21 cells from 9 biologically independent jSI mice) between jSI and GH. Data in B-F, H-L, N-R are presented as mean +/− s.e.m.
Extended Data Fig. 6
Extended Data Fig. 6. mEPSC and mIPSC of mPFC->pPVT neurons, mPFC->NAc neurons, and mPFC->cPFC neurons.
(A-C) Whole-cell slice patch clamp recording from mPFC->pPVT neurons in adult jSI mice (20 cells from 6 biologically independent mice) or GH mice (19 cells from 5 biologically independent mice). (B) mEPSC frequency was significantly lower in jSI mice compared to GH mice (two tailed t-test, t37=2.730, **P=0.964×10⁻²) but there were no significant differences in mEPSC amplitude (two tailed t-test, t37=1.150, P=0.258). (C) There were no significant differences in mIPSC frequency (two tailed t-test, t37=0.101, P=0.920) or mIPSC amplitude (two tailed t-test, t37=0.303, P=0.764) between jSI and GH. (D-F) Whole-cell patch clamp recording from mPFC->NAc neurons in adult jSI mice (n=20 cells from 6 biologically independent mice) or GH mice (n=20 cells from 6 biologically independent mice). (E) There were no significant differences in mEPSC frequency (two tailed t-test, t38=0.002, P=0.998) or mEPSC amplitude (two tailed t-test, t38=0.495, P=0.624) between jSI and GH. (F) There were no significant differences in mIPSC frequency (two tailed t-test, t38=0.066, P=0.948) or mIPSC amplitude (two tailed t-test, t38=0.455, P=0.652) between jSI and GH. (G-I) Whole-cell patch clamp recording from mPFC->cPFC neurons in adult jSI mice (n=19 cells from 5 biologically independent mice) or GH mice (n=18 cells from 5 biologically independent mice). (H) There were no significant differences in mEPSC frequency (two tailed t-test, t35=1.559, P=0.128), or mEPSC amplitude (two tailed t-test, t35=1.275, P=0.211) between jSI and GH. (I) There were no significant differences in mIPSC frequency (two tailed t-test, t35=0.247, P=0.807) or mIPSC amplitude (two tailed t-test, t35=1.579, P=0.123) between jSI and GH. Data in B, C, E, F, H, I are presented as mean +/− s.e.m.
Extended Data Fig. 7
Extended Data Fig. 7. Optogenetic interrogation of mPFC->pPVT projection inputs onto pPVT neurons
(A) ChR2-encoding AAV1 was injected into the mPFC to express ChR2 in mPFC neurons. Whole cell patch-clamp recordings were performed while optogenetically activating mPFC->pPVT projection terminals in pPVT slices. (B) Excitatory connectivity was assessed by normalized postsynaptic currents (PSCs) recorded at −70 mV from pPVT neurons before and after application of tetrodotoxin (TTX; 1 μM) with 4-aminopyridine (4-AP; 100 μM). A majority of pPVT neurons received a monosynaptic input from mPFC. There was no difference in mono/polysynaptic ratio (two tailed t-test, t13=0.349, P=0.733, n=8 cells from 5 biologically independent GH mice, n=7 cells from 5 biologically independent jSI mice). (C) (upper) Representative traces showing that optogenetic activation of mPFC->pPVT axons blocked by DNQX (20 μM). pPVT neurons were clamped at –70 mV while optogenetically stimulating mPFC-pPVT axons before and after bath application of DNQX. Traces are recorded from 3 cells from 2 biologically independent mice, with similar results obtained. (bottom) Averaged amplitude decreases after application of DNQX (two tailed t-test, t2=17.790, **P=0.003, n=3 cells from 2 biologically independent mice). (D) (left) Representative eEPSC of pPVT neurons upon optogenetic activation of mPFC->pPVT axons in GH and jSI mice through gradually changing the intensity. Traces were recorded from 17 cells from 7 biologically independent mice per group, with similar results obtained. (right) Intensity–amplitude curves showing the relationship between stimulus intensity and normalized eEPSC amplitude. Normalized eEPSC amplitude was lower in jSI mice than GH mice (two-way RM ANOVA, housing (GH/jSI) x current step interaction F5,185 = 3.740, **P=0.003, effect of housing F1,37 = 4.173, P=0.048, effect of current step F1.224, 45.29 =25.830, P=0.174×10⁻⁵, n=17 cells from 7 biologically independent GH mice, n=17 cells from 7 biologically independent jSI mice). (E) There were no significant differences in PPR at a 500-ms interval (two tailed t-test, t25=1.551, P=0.134, n=17 cells from 7 biologically independent GH mice, n=21 cells from 8 biologically independent jSI mice). Data in C, D, E are presented as mean +/− s.e.m.
Extended Data Fig. 8
Extended Data Fig. 8. Juvenile social isolation increases excitability of mPFC low-threshold spiking (LTS)-SST interneurons in adulthood.
(A)Whole-cell patch clamp recording from mPFC SST interneurons in adult jSI or GH SST-GFP mice (SST-Cre mice crossed with Cre-dependent eGFP-L10a mice). (B) Classification of SST cells based on firing patterns. SST cells are consist of 3 sub-types (low-threshold spike: LTS, quasi-fast spiking: QFS, adapting: AD) in L5/6 and mainly AD type in L2/3. (C) % of sub-type of SST interneurons in L5/6 and L2/3 in GH and jSI mice. (D) Assessment of intrinsic excitability of SST-LTS interneurons in L5/6 in the presence of DNQX, D-AP5, and picrotoxin. Traces were recorded from 14–15 cells from 4 biologically independent mice per group, with similar results obtained. (left) Representative traces at 100 pA injection recorded from SST-LTS cells. jSI group shows reduced spike frequency at 200pA and −100pA (two tailed t-test, t27=3.097, **P=0.005, n=14 cells from 4 biologically independent GH mice, n=15 cells from 4 biologically independent jSI mice). (E) SST-QFS type show comparable excitability between 2 groups at 100pA (two tailed t-test, t47=1.614, P=0.113, n=23 cells from 6 biologically independent GH mice, n=26 cells from 6 biologically independent jSI mice). (F-G) The jSI group shows decreased excitability in (F) L5/6 SST-AD type at 100pA (two tailed t-test, t35=2.905, **P=0.006, n=17 cells from 6 biologically independent GH mice, n=20 cells from 6 biologically independent jSI mice), and (G) L2/3 SST-AD type at 100pA (two tailed t-test, t30=2.186, *P=0.037, n=24 cells from 6 biologically independent GH mice, n=18 cells from 6 biologically independent jSI mice). Data in D-G are presented as mean +/− s.e.m.
Extended Data Fig. 9
Extended Data Fig. 9. Optogenetic stimulation of mPFC->pPVT projection terminals does not change motor activity or anxiety-related behaviors in adult jSI mice.
(A) CaMKII-ChR2 AAV1 was injected into the mPFC and a wireless blue LED was inserted above the pPVT in jSI mice. (B) jSI mice underwent testing in the open field and elevated plus maze (EPM) with (ON) or without (OFF) light stimulation (20Hz) (C) (left) Viral spread validation from behavior-tested mice. Gray areas represent the minimum (lighter colour) and the maximum (darker colour) spread of ChR2 expression into the mPFC. (right) Optic fiber tip location (blue line circles) was validated in all mice. Experimental images were obtained from 13 mice, three images per mouse for both mPFC and pPVT, with similar results obtained. (D) ChR2+jSI mice showed no differences in motor activity or anxiety-related behaviors between ON and OFF sessions (Left; two tailed paired t-test, t12=0.346, P=0.735, n=13 biologically independent jSI mice, Middle; two tailed paired t-test, t12=0.431, P=0.674, n=13 biologically independent mice, Right; two tailed paired t-test, t12=1.364, P=0.198, n=13 biologically independent jSI mice). (E) Control mCherry+ jSI mice showed no difference in motor activity or anxiety-related behaviors between ON and OFF sessions (Left; two tailed paired t-test, Left; t7=0.970, P=0.365, n=8 biologically independent jSI mice, Middle; t7=0.183, P=0.860, n=8 biologically independent jSI mice Right; t7=0.083, P=0.936, n=8 biologically independent jSI mice). (F-G) Investigation time of each stimulus during first 20 mins of 3 chamber testing from Day 1 to Day 4 of ON group (F) and OFF group (G) during the repeated optogenetic stimulation study in Fig. 8EF. Data in D-G are presented as mean +/− s.e.m.
Figure 1.
Figure 1.. Juvenile social isolation impairs activation of mPFC->pPVT projection neurons upon social exposure in adulthood.
(A) (Left) Timeline showing weaning at p21, and subsequent 2 weeks of juvenile social isolation (jSI), followed by re-housing or continued control group housing (GH), and subsequent In vivo fiber photometry calcium imaging of GCaMP6f-expressing mPFC->pPVT neurons in behaving adult mice. (right) Selective viral expression of GCaMP6f in mPFC->pPVT projection neurons were achieved by injecting AAV1-DIO-GCaMP6f in mPFC and retrograde rAAV2-Cre in pPVT. (B) Representative localization of optic fiber and GCaMP6f expression in mPFC. Scale; 500μm. Experimental images were obtained from 42 mice, three images per mouse, with similar results obtained. (C) During fiber photometry imaging, mice were exposed to a novel mouse or novel object (order of object and social exploration was counterbalanced). (D) Optic fiber placement and proximity to injection sites were confirmed from all mice (GH: open circles, jSI: red circles). (E-F) Heat maps of GCaMP6f signals (red-blue: high-low) for each trial f trials (one trial per mouse) from all mice (upper panel) and averaged traces of GCaMP6f signals from mPFC->pPVT neurons (lower panel) of (E) GH mice (n=23 biologically independent mice) and (F) jSI mice (n=19 biologically independent mice). (right) Quantification of social- or object-evoked normalized GCaMP6f signals (mean Z score of 30 sec post stimulus introduction subtracted with mean Z score of 30sec baseline) from mPFC->pPVT neurons in adult GH or jSI mice. Social exposure evoked higher responses than object exposure in GH mice (two tailed paired t-test, t22=4.759, ****P=0.946×10⁻⁴) but not in jSI mice (two tailed paired t-test, t18=0.757, P=0.459). (G) jSI mice showed less difference in mPFC->pPVT neuron activity between social and object exposure (S-O) than that of GH mice (two tailed t-test, t40=2.913, **P=0.006, n=23 (GH), 19 (jSI) biologically independent mice). Data in E-G are presented as mean +/− s.e.m.
Figure 2.
Figure 2.. Chemogenetic suppression of mPFC->pPVT projection neuron activity reduces sociability in adult group-housed mice.
(A) (left) Cre-dependent Inhibitory DREADD (iDREADD) or mCherry vector and a retrograde CAV2-Cre were injected into the mPFC and pPVT, respectively, to express iDREADD in mPFC->pPVT neurons. Representative images from mPFC (middle) and pPVT (right) showing iDREADD-mCherry expression. (Left; Scale bar = 600 μm, Right; Scale bar = 300 μm). Experimental images were obtained from 10 mice, three images per mouse for each area were taken, with similar results obtained. (B) Validation of iDREADD in mPFC->pPVT projection neuron by whole-cell patch recording in PFC slices. (left) Representative trace of membrane potential before and after a bath application of CNO. Traces were obtained from 7 cells from 3 biologically independent mice with similar results obtained (right) Quantification of membrane potential (MP) of mPFC->pPVT neurons showing reduction after CNO application (two tailed paired t-test, t6=4.881, **P=0.003, n=7 cells from 3 biologically independent mice). (C) Group-housed adult mice were treated with saline (SAL) or CNO (10mg/kg) and then underwent the 3 chamber test of sociability. SAL and CNO session order were counter-balanced for each behavior test with a 7-day interval between tests. (D) Viral spread validation of mice expressing iDREADD in mPFC-> pPVT neurons after behavioral experiments. Gray areas represent the minimum (lighter colour) and the maximum (darker colour) spread of iDREADD. (E) (left) CNO-treated iDREADD+ mice showed reduced sociability, revealed by reduced sociability scores (calculated as (social-object)/ (social + object)) vs. SAL (two tailed paired t-test, t9=3.548, **P=0.006, n=10 biologically independent mice) and disrupted behavior in 3 chamber sociability task (two-way repeated measures (RM) ANOVA, drug (CNO/SAL) × stimulus (social/object) interaction F1,18 = 11.040, **P=0.004, effect of drug F1,18 = 0.071, P=0.793, effect of stimulus F1,18 = 0.731, P=0.404, n=10 biologically independent mice). (right) CNO-treated iDREADD+ mice showed no differences in motor activity and anxiety-related behavior (open field distance traveled; two tailed paired t-test, t9=0.183, P=0.859, n=10 biologically independent mice, open field time in center; two tailed paired t-test, t9=0.843, P=0.421, n=10 biologically independent mice, elevated plus maze (EPM) time in open arms: two tailed paired t-test, t8=0.568, P=0.586, n=9 biologically independent mice). (F) (left) Control mCherry+ mice show no difference in sociability score (two tailed paired t-test, t7=0.160, P=0.878, n=8 biologically independent mice) and investigation time (two-way RM ANOVA, drug (CNO/SAL) × stimulus (social/object) interaction F1,14 = 1.027, P=0.328, effect of drug F1,14 = 0.593, P=0.454, effect of stimulus F1,14 = 8.723, P=0.010, n=8 biologically independent mice. (right) mCherry+ mice showed no difference in motor activity or anxiety-related behaviors (Left; two tailed paired t-test, t7=0.599, P=0.568, n=8 biologically independent mice, Middle; two tailed paired t-test, t7=1.881, P=0.102, n=8 biologically independent mice, Right; two tailed paired t-test, t7=0.662, P=0.529, n=8 biologically independent mice). Data in B, E, F are presented as mean +/− s.e.m.
Figure 3.
Figure 3.. Optogenetic suppression of mPFC->pPVT projection terminal activity reduces sociability in adult group-housed mice.
(A) (Upper) Halorhodopsin NpHR3.0 AAV under the CamKII promotor was injected into mPFC and mPFC->pPVT projection terminals were optically stimulated in the pPVT using a wireless yellow LED system. Representative images of mPFC (middle) and pPVT (lower) show selective transduction of halorhodopsin at injection areas in the mPFC and the projection target areas in the pPVT where optic fibers are located. (middle; Scale bar = 600 μm, lower; Scale bar = 300 μm). Experimental images were obtained from 14 mice, three images per mouse for each areas, with similar results obtained. (B) Mice underwent the 3 chamber test of sociability with (ON) or without (OFF) light stimulation. Order of ON and OFF sessions were counter-balanced for each behavior test with a 24 hour interval between tests. (C) Mice with optogenetic suppression showed reduced sociability scores (two tailed paired t-test, t13=2.769, *P=0.016, n=14 biologically independent mice) and loss of social preference in the 3 chamber sociability test (two-way RM ANOVA, light (ON/OFF) × stimulus (social/object) interaction F1,26 = 4.876, *P=0.036, effect of light F1,26 = 1.915, P=0.178, effect of stimulus F1,26 = 11.870, P=0.002). (D) However, control mCherry+ mice showed no difference in sociability score two tailed paired t-test, t8=0.722, P=0.491, n=9 biologically independent mice) and investigation time (two-way RM ANOVA, light (ON/OFF) × stimulus (social/object) interaction F1,16 = 0.700, P=0.415, effect of light F1,16 = 0.685, P=0.420, effect of stimulus F1,16 = 16.600, P=0.882×10⁻³, n=9 biologically independent mice). (E) Mice underwent a 3 chamber test of food preference with (ON) or without (OFF) light stimulation. ON and OFF session order is counter-balanced for each behavior test with a 24 hour interval between tests. (F) (left) Mice with optogenetic suppression showed no difference in milkshake consumption (two tailed paired t-test, t5=0.143, P=0.892, n=6 biologically independent mice), in food discrimination score (middle: two tailed paired t-test, t5=0.724, P=0.501, n=6 biologically independent mice), nor in investigation time (right: two-way RM ANOVA, light (ON/OFF) × stimulus (Milkshake/Empty) interaction F1,10 = 0.183, P=0.678, effect of light F1,10 = 1.478, P=0.252, effect of stimulus F1,10 = 12.020, P=0.006, n=6 biologically independent mice). Data in C, D, F are presented as mean +/− s.e.m.
Figure 4.
Figure 4.. Optogenetic activation of mPFC->pPVT projection terminals biases sociability in adult group-housed mice.
(A) CaMKII-ChR2 AAV1 was injected into the mPFC and a wireless blue LED was inserted above the pPVT in group-housed (GH) mice. (B) (left) A representative in vivo unit recording of pPVT neurons showing reliable spikes upon optogenetic stimulation (20Hz) of mPFC->pPVT projection terminals. Traces Experimental images were obtained from 4 mice, 5–12 cells per mouse, with similar results obtained. (right) Quantification of light-induced firing rates of pPVT neurons (light OFF vs light ON (1 s each): two tailed paired t-test, t85=160.700, ****P=0.001×10⁻¹², n=86 cells from 4 biologically independent mice,). (C) (left) Representative images of injection area of mPFC neurons expressing ChR2. Scale bar: 600μm. Experimental images were obtained from 10 mice, three images per mouse, with similar results obtained. (right) Viral spread validation from behavior-tested mice. Gray areas represent the minimum (lighter colour) and the maximum (darker colour) spread of ChR2 expression in the mPFC. (D) (left) Representative pPVT image shows selective transduction of ChR2 below the area where optic fiber tips were inserted in the pPVT. Scale bar: 300μm. Experimental images were obtained from 10 mice, three images per mouse, with similar results obtained. (right) Optic fiber tip location (blue line circles) was validated in all mice. (E-H) GH adult mice underwent the 3-chamber test of sociability with (ON) or without (OFF) light stimulation. The order of ON and OFF sessions was counter-balanced with a 24 hour interval between tests. Optogenetic stimulation was delivered to activate the mPFC->pPVT projection whenever the mouse visited the (E) mouse interaction zone or (F) object zone and was terminated immediately if the mouse exited the mouse interaction zone during the 3 chamber sociability test. Order of ON and OFF sessions was counter-balanced with a 24-hour interval between tests. (G) Optogenetic activation in the social zone led to increased sociability scores (two tailed paired t-test, t9=4.788, ****P=0.990×10⁻³, n=10 biologically independent mice,) and increased social preference (two-way RM ANOVA, light (ON/OFF) × stimulus (social/object) interaction F1,18 = 12.860, **P=0.002, effect of light F1,18= 0.488, P=0.494, effect of stimulus F1,18 = 94.020, P=0.143×10⁻⁷, n=10 biologically independent mice). (H) Optogenetic activation in the object zone led to reduced sociability scores (two tailed paired t-test, t9=3.491, **P=0.007, n=10 biologically independent mice) and increased object zone preference (two-way RM ANOVA, light (ON/OFF) × stimulus (social/object) interaction F1,18 = 15.910, ****P=0.861×10⁻³, effect of light F1,18 = 1.227, P=0.282, effect of stimulus F1,18 = 0.282, P=0.602, n=10 biologically independent mice). (I-K) Optogenetic stimulation of mPFC->pPVT projection acutely promotes place preference. (I) Adult GH mice underwent the 3 chamber test without light stimulation (pre: OFF 10 mins), followed by a stimulation period (stim: ON 10 mins), and immediately followed by another period without light stimulation (post: OFF 10 mins). During the stimulation period, optogenetic stimulation was delivered to activate the mPFC->pPVT projection whenever the mouse visited the stimulation zone (S) and was terminated immediately if the mouse exited the stimulation zone. Location of stimulation zones are counter balanced. (J) ChR2+GH mice with optogenetic stimulation showed real-time preference to the stimulation zone (S) over the non-stimulation zone (N) as indicated by increased discrimination score (calculated as (S-N)/(S+N), one-way RM ANOVA, F1.585. 19.02 = 14.760, P=0.287×10⁻³, Tukey’s multiple comparisons test: pr e vs stim ****P=0.309×10⁻⁴, stim vs post **P=0.006) as well as investigation time (two-way RM ANOVA, time (pre/stim/post) × zone (stimulation zone/Non-stimulation zone) interaction F2,36 = 7.917, **P=0.001, effect of time F2,36 = 1.325, P=0.278, effect of zone F1,36 = 16.500, P=0.251×10⁻³, n=13 biologically independent mice). (K) Control mCherry+ mice showed no difference in discrimination score (one-way RM ANOVA, F1.125, 5.624= 0.2043, P=0.696, n=6 biologically independent mice) or investigation time (two-way RM ANOVA, time (pre/stim/post) × zone (stimulation zone/Non-stimulation zone) interaction F2,15 = 0.134, P=0.876, effect of time F2,15 = 0.073, P=0.930, effect of zone F1,15 = 0.345, P=0.566, n=6 biologically independent mice). Data in B, G, H, J, K are presented as mean +/− s.e.m.
Figure 5.
Figure 5.. jSI leads to reduced intrinsic excitability and increased inhibitory input drive of mPFC->PVT neurons in adulthood.
(A) mPFC->pPVT neurons were labeled with retrobeads injected into the pPVT of mice underwent jSI (p21-p35) or GH. Whole-cell patch clamp recordings of mPFC->pPVT neurons were performed from mPFC slices of P21, P35 (jSI, GH), or adult (jSI, GH) mice. (B-D) Assessment of intrinsic excitability of mPFC-> pPVT neurons. (B) Representative traces in the presence of DNQX (20μM), D-AP5 (50μM), and picrotoxin (30μM) at −100pA and 200pA current steps. Traces are recorded from 20–23 cells from 7–9 biologically independent mice per group, with similar results obtained. (C) Input-output curve in P35 and Adult mice in GH (left: two-way RM ANOVA, housing x current step interaction F19,779 = 1.496, P=0.079, effect of current step F19,779 = 339.700, P=0.001×10⁻¹², effect of housing F1,41 = 0.226, P=0.637, n=21, 22 cells from 7, 7 biologically independent P35 or Adult mice in GH respectively) and jSI (right: two-way RM ANOVA, housing (GH/jSI) x current step interaction F19,779 = 10.790, ****P=0.001×10⁻¹², effect of current step F19,779 = 494.400, P=0.001×10⁻¹², effect of housing F1,41 = 41.830, P=0.935×10⁻⁷, n=20, 23 cells from 7, 9 biologically independent P35 or Adult mice in jSI respectively). (D) At the 200pA current step, jSI mice showed a significantly lower spike frequency compared with GH mice only after p35 during adulthood (two-way RM ANOVA, housing (GH/jSI) x age (P21/P35/Adult) interaction F2,126 = 6.171, **P=0.003, effect of housing F1,126 = 4.128, P=0.044, effect of age F2,126 = 12.380, P=0.123×10⁻⁴, Tukey’s multiple comparisons test: **P=0.001 (Adult: jSI vs GH), ****P=0.512×10⁻⁵ (jSI: p35 vs adult), n=23 cells from 6 biologically independent mice (p21), n=20 cells from biologically independent 7 jSI mice (p35), n=21 cells from biologically independent 7 GH mice (p35), n=23 cells from biologically independent 9 jSI mice (adult), and n=22 cells from biologically independent 7 GH mice (adult)). Spike threshold showed no significant difference between GH and jSI (two-way RM ANOVA, housing (GH/jSI) x age (P21/P35/Adult) interaction F2,126 = 1.447, P=0.239, effect of housing F1,126 = 2.265, P=0.135, effect of age F2,126 = 2.611, P=0.077). (E-G) Assessment of excitatory and inhibitory drive onto mPFC->pPVT neurons. n=23 cells from biologically independent 6 mice (p21), n=21 cells from biologically independent 7 jSI mice (p35), n=22 cells from biologically independent 7 GH mice (p35), n=22 cells from biologically independent 9 jSI mice (adult), and n=21 cells from biologically independent 9 GH mice (adult). (E) (upper) Representative traces of sEPSCs. Traces were recorded from 21–22 cells from 7–9 mice per group, with similar results obtained. (lower) sEPSC showed significant developmental changes but no difference between jSI and GH (Frequency: two-way RM ANOVA, housing (GH/jSI) x age (P21/P35/Adult) interaction F2,126 = 0.975, P=0.380, effect of housing F1,126 = 1.187, P=0.278, effect of age F2,126 = 3.423, P=0.036, Amplitude: two-way RM ANOVA, housing (GH/jSI) x age (P21/P35/Adult) interaction F2,126 = 1.375, P=0.257, effect of housing F1,126 = 1.335, P=0.250, effect of age F2,126 = 20.450, P=0.203×10⁻⁷). (F) (upper) Representative traces of sIPSCs. Traces were recorded from 21–22 cells from 7–9 mice per group, with similar results obtained. (lower left) sIPSC frequency in jSI mice failed to decrease between p35 and adulthood (two-way RM ANOVA, housing (GH/jSI) x age (P21/P35/Adult) interaction F2,126 = 6.146, **P=0.003, effect of housing F1,126 = 5.267, P=0.023, effect of age F2,126 = 3.400, P=0.036, Tukey’s multiple comparisons test: ****P=0.826×10⁻³ (Adult: jSI vs GH), **P=0.001 (GH: p35 vs adult)). (lower right) sIPSC amplitude showed significant developmental changes but no difference between jSI and GH (two-way RM ANOVA, housing (GH/jSI) x age (P21/P35/Adult) interaction F2,126 = 1.408, P=0.249, effect of housing F1,126 = 2.638, P=0.107, effect of age F2,126 = 89.870, P=0.001×10⁻¹²). (G) The ratio of sEPSC/sIPSC frequency was significantly different between GH and jSI only after p35 in adulthood. jSI mice did not show a late developmental increase in the ratio between p35 and adulthood as in GH mice did (two-way RM ANOVA, housing (GH/jSI) x age (P21/P35/Adult) interaction F2,126 = 6.667, **P=0.001, effect of housing F1,126 = 8.628, P=0.004, effect of age F2,126 = 3.310, P=0.040, Tukey’s multiple comparisons test: ****P=0.130×10⁻³ (Adult: jSI vs GH), **P=0.004 (GH: p35 vs adult)). The ratio of sEPSC/sIPSC amplitude showed developmental changes but no significant difference between jSI and GH groups (two-way RM ANOVA, housing (GH/jSI) x age (P21/P35/Adult) interaction F2,126 = 0.052, P=0.949, effect of housing F1,126 = 0.163, P=0.687, effect of age F2,126 = 26.770, P=0.204×10⁻⁹). Data in C-G are presented as mean +/− s.e.m.
Figure 6.
Figure 6.. jSI leads to increased intrinsic excitability of mPFC LTS-SST interneurons and impaired LTS-SST to mPFC->pPVT synaptic transmission in adulthood.
(A-C) Whole-cell patch clamp recording from low threshold spiking (LTS)-somatostatin (SST) interneurons in mPFC slices of adult jSI or GH mice. (A) mPFC LTS-SST interneurons are fluorescently labeled by injecting a Cre-dependent mCherry vector into adult Chrna2-Cre mice. (middle) Representative image of Chrna2+LTS-SST interneurons expressing mCherry in the mPFC. (right) co-localization of mCherry and SST immunoreactivity (green) in the mPFC. Scale bar: 150 um (left), 50um (right) Experimental images were obtained from 6 mice, 3 images per mouse, with similar results obtained. (B) (left) Assessment of intrinsic excitability of Chrna2+ LTS-SST interneurons in the presence of DNQX (20μM), D-AP5 (50μM), and picrotoxin (30μM). (left) Representative traces at 200pA injection recorded from mPFC LTS-SST interneurons (traces were recorded from 12–14 cells from 7 biologically independent mice per group) and (right) quantification of spike frequency (two tailed t-test, n=14 cells from 7 biologically independent jSI mice, t24=3.186, **P=0.004, n=12 cells from 7 biologically independent GH mice). (C) There were no significant differences in spike threshold (two tailed t-test, t24=0.257, P=0.800, n=12 cells from 7 biologically independent GH mice, n=14 cells from 7 biologically independent jSI mice). (D-F) Optogenetic interrogation of LTS-SST interneuron input onto mPFC->pPVT projection neurons. (D) Cre-dependent ChR2 vector and green retrobeads were injected into the mPFC and pPVT, respectively, to express ChR2 in LTS-SST interneurons and fluorescently label mPFC->pPVT neurons for patch-clamp recordings. (middle) A representative image showing ChR2-mCherry+LTS-SST interneurons and retrobeads+mPFC->pPVT projection neurons in deep layer mPFC. Scale bar 50um. Experimental images were obtained from 3 mice, 16 images per mouse, with similar results obtained. (right) Latency of light-evoked IPSC of mPFC->pPVT neurons indicates monosynaptic inhibitory inputs from LTS-SST interneurons but indicates no significant difference between GH and jSI mice (two tailed t-test, t32=0.284, P=0.778, n=17 cells from 7 biologically independent mice for each group). (E) Stimulus Intensity–response amplitude curves of normalized eEPSC upon optical stimulation with a light intensity incrementally increased in a step-wise fashion (0.1mW/mm/step) from the minimal stimulation level 1. Plotted eIPSC amplitudes were normalized to the amplitude of the response evoked by the minimal stimulation intensity for each patched cells individually to mitigate the impact of variations in viral expression levels. There were no significant differences in normalized eIPSC amplitude (two-way RM ANOVA, housing (GH/jSI) x light intensity step interaction F5,145 = 1.217, P=0.304, effect of housing F1,29 = 0.872, P=0.304, effect of light intensity step F5,145 = 52.460, P=0.001×10⁻¹², n=15 cells from 7 biologically independent GH mice, n=16 cells from 7 biologically independent jSI mice). (F) (left) eIPSCs elicited by optogenetic stimulation. Representative averaged waveform showing paired-pulse facilitation in eIPSCs at a 500-ms interval. Traces were recorded from 17 cells from 7 mice per group, with similar results obtained. (right) Quantification of paired pulse ratio (PPR), given by second evoked amplitude/first evoked amplitude (two tailed t-test, t32=2.220, *P=0.034, n=17 cells from 7 biologically independent mice for each group). (G-J) Chemogenetic activation of mPFC Chrna2+LTS-SST interneurons reduces sociability in adult GH mice. (G) (top left) Cre-dependent AAV8-DIO-eDREADD was injected into the mPFC of Chrna2-Cre mice. (top right) A representative image showing transduction of eDREADD-mCherry at injection areas in the mPFC. Scale bar: 150μm. Experimental images were obtained from 10 mice, four images per mouse, with similar results obtained. (bottom) Mice were treated with saline (SAL) or CNO (1mg/kg) and then underwent the 3 chamber test of sociability. For CNO and SAL injections, order was counter-balanced with a one-week interval between tests. (H) Co-localization analysis of c-Fos immunoreactivity and mCherry confirmed efficacy of the eDREADD virus in activating Chrna2+LTS interneurons. (left) Representative images for mice treated with SAL and CNO show significant co-localization between mCherry (red) and c-Fos (green) only in CNO-treated mice (Experimental images were obtained from 4 mice per group, 10 images per mouse, with similar results obtained) and quantification (two tailed t-test, t6=4.648, **P=0.004, n=4 biologically independent mice). Scale bar: 100um (left), 50um (right) (I) Viral spread validation of eDREADD expression from behavior-tested mice. Gray areas represent the minimum (lighter colour) and the maximum (darker colour) spread of eDREADD in the mPFC. (J) (left) CNO-treated eDREADD+ mice showed reduced sociability scores (two tailed paired t-test, t9=2.489, *P=0.034, n=10 biological independent mice). Breakdown of social and object investigation time (two-way RM ANOVA, drug (CNO/SAL) × stimulus (social/object) interaction F1,18 = 1.704, P=0.208, effect of drug F1,18 = 0.004, P=0.953, effect of stimulus F1,18 = 10.750, P=0.004, n=10 biologically independent mice). (right) eDREADD+ mice showed no differences in motor activity or anxiety-related behaviors when treated with SAL vs. CNO (Left; two tailed paired t-test, t9=0.167, P=0.871, n=10 biologically independent mice, Middle; two tailed paired t-test, t9=0.332, P=0.748, n=10 biologically independent mice, Right; two tailed paired t-test, t9=0.434, P=0.674, n=10 biologically independent mice). Data in B, C, E, F, H, J are presented as mean +/− s.e.m.
Figure 7.
Figure 7.. Chemogenetic activation of mPFC-pPVT projection neurons rescues sociability deficits in adult jSI mice.
(A) (left) Cre-dependent eDREADD (or mCherry) AAV8 and a retrograde rAAV2-Cre were injected into the mPFC and pPVT, respectively, to selectively express eDREADD in mPFC->pPVT neurons. Representative images of mPFC (middle) and pPVT (right) show selective transduction of eDREADD in mPFC-pPVT projection neurons. (middle; scale bar = 600 μm, right; scale bar = 300 μm). Experimental images were obtained from 12 mice, four images per mouse for mPFC and two images per mouse for pPVT, with similar results obtained. (B) Validation of eDREADD action in mPFC->pPVT projection neurons by slice whole-cell patch clamp recordings. Representative trace (left) showing that bath application of CNO significantly increases membrane potential of mPFC->pPVT projection neuron (traces were obtained from 7 cells of biologically independent 3 mice, with similar results obtained) and (right) quantification (two tailed paired t-test, t6=3.682, *P=0.010, n=7 cells from biologically independent 3 mice). (C) jSI mice were treated with saline (SAL) or CNO (1mg/kg) in a counter balanced fashion and then underwent the 3 chamber test of sociability, the open field, and elevated plus maze (EPM). with a 7-day interval between tests. (D) Viral spread validation of behavior-tested mice. Gray areas represent the minimum (lighter colour) and the maximum (darker colour) spread of eDREADD into the mPFC. (E) CNO-treated eDREADD+jSI mice show increased sociability scores vs SAL (two tailed paired t-test, t11=3.330, **P=0.007, n=12 biologically independent mice) and increased social interaction (two-way RM ANOVA, drug (CNO/SAL) × stimulus (social/object) interaction F1,22 = 5.191, *P=0.033, effect of drug F1,22 = 0.681, P=0.418, effect of stimulus F1,22 = 6.327, P=0.020, n=12 biologically independent mice). eDREADD+jSI mice showed no differences in motor activity or anxiety-related behaviors between SAL and CNO sessions (Left; two tailed paired t-test, t11=0.097, P=0.925, n=12 biologically l independent mice, Middle; two tailed paired t-test, t11=1.498, P=0.162, n=12 biologically independent mice, Right; two tailed paired t-test, t11=0.357, P=0.728, n=12 biologically independent mice). (F) Control mCherry+ jSI mice show no difference in sociability score (two tailed paired t-test, t9=0.393, P=0.703, n=10 biologically independent mice) and investigation time (two-way RM ANOVA, drug (CNO/SAL) × stimulus (social/object) interaction F1,18 = 0.307, P=0.586, effect of drug F1,18 =1.352, P=0.260, effect of stimulus F1,18 = 7.914, P=0.012, n=10 biological independent mice). mCherry+ jSI mice showed no difference in motor activity or anxiety-related behaviors in SAL vs. CNO sessions (two tailed paired t-test, Left; t9=0.446, P=0.666, Middle; t9=0.947, P=0.368, Right; t9=1.083, P=0.307, n=10 biologically independent mice). Data in B, E, F are presented as mean +/− s.e.m.
Figure. 8.
Figure. 8.. Optogenetic activation of mPFC->pPVT projection terminals rescues sociability deficits in adult jSI mice.
(A) (top) AAV encoding Channelrhodopshin ChR2 under the CamK2 promotor was injected into the mPFC and a wireless blue LED was inserted above the pPVT of adult jSI mice. Representative images of mPFC (middle) and pPVT (bottom) show selective transduction of ChR2 in injection areas in the mPFC, and at projection target areas in the pPVT where optic fibers are located (middle; scale bar = 600 μm, bottom; scale bar = 300 μm). Experimental images were obtained from 13 mice, three images per mouse for each area, with similar results obtained. (B) Adult jSI mice underwent the 3 chamber test for sociability with (ON) or without (OFF) light stimulation. ON and OFF sessions were counter-balanced with a 24-hour interval between each behavior test. (C) ChR2+ jSI mice receiving optogenetic stimulation showed increased sociability scores (two tailed paired t-test, t12=2.284, *P=0.041, n=13 biologically independent jSI mice) and increased social interaction (two-way RM ANOVA, light (ON/OFF) × stimulus (social/object) interaction F1,24 = 5.064, *P=0.034, effect of light F1,24 = 1.224, P=0.280, effect of stimulus F1,24 = 1.865, P=0.185, n=13 biologically independent jSI mice). (D) Control mCherry+ mice showed no difference in sociability score (two tailed paired t-test, t7=0.258, P=0.804, n=8 biologically independent jSI mice) and investigation time (two-way RM ANOVA, light (ON/OFF) × stimulus (social/object) interaction F1,14 = 0.007, P=0.936, effect of light F1,14 = 0.082, P=0.779, effect of stimulus F1,14 = 0.457, P=0.510, n=6 biologically independent jSI mice). (E) Experimental paradigm to examine how long the effect of optogenetic stimulation of mPFC->pPVT projection persists. Baseline day (Day1): mice (12 mice) explored the 3-chamber arena with novel mouse and novel object corrals for 20 mins. (Days 2 & 3): Mice underwent the same 3-chamber test as on Day 1, except mPFC->pPVT circuits were stimulated whenever test mice entered the social interaction zone surrounding a wire corral and the session was extended to 30 min. A probe test day (Day4): mice underwent the 3-chamber test in the absence of optogenetic stimulation for 20 mins. (F) (Left) Sociability scores from Day1 to Day4 (first 20 mins) show a significant sustained effect of light stimulation on Day 2 and 3 (two-way RM ANOVA, light (ON/OFF) × day (Day1/Day2/Day3/Day4) interaction F3,66 = 1.172, P=0.327, effect of light F1,22 = 45.940, ****P=0.823×10⁻⁶, effect of day F2.054, 45.18 = 1.012, P=0.373, n=12 biologically independent jSI mice). (Right) On Day 4, recovery of sociability persisted in the absence of light stimulation (two tailed paired t-test, t11=2.654, *P=0.022, n=12 biologically independent jSI mice). Data in C, D, F are presented as mean +/− s.e.m. (G) Summary Scheme: Activation of mPFC->pPVT projection neurons is essential for normal sociability in adult GH mice. However, these neurons show decreased intrinsic excitability and an increased inhibitory input drive from mPFC LTS-SST interneurons when deprived of juvenile social experience, a manipulation that leads to decreased social interaction in adulthood. Decreased social interaction can be induced in GH animals by inhibiting mPFC->pPVT projection or activating mPFC LTS-SST interneurons in adulthood and sociability of jSI mice can be rescued by increasing PFC->pPVT projection neuron activity.

Comment in

  • Testing time alone.
    Lewis S. Lewis S. Nat Rev Neurosci. 2020 Nov;21(11):594. doi: 10.1038/s41583-020-00387-8. Nat Rev Neurosci. 2020. PMID: 32973313 No abstract available.

References

    1. Cacioppo JT & Cacioppo S. The growing problem of loneliness. Lancet 391, 426, doi:10.1016/S0140-6736(18)30142-9 (2018). - DOI - PMC - PubMed
    1. Miller G Social neuroscience. Why loneliness is hazardous to your health. Science 331, 138–140, doi:10.1126/science.331.6014.138 (2011). - DOI - PubMed
    1. Pitman A, Mann F & Johnson S Advancing our understanding of loneliness and mental health problems in young people. Lancet Psychiatry 5, 955–956, doi:10.1016/S2215-0366(18)30436-X (2018). - DOI - PubMed
    1. Freedman DG, King JA & Elliot O Critical period in the social development of dogs. Science 133, 1016–1017, doi:10.1126/science.133.3457.1016 (1961). - DOI - PubMed
    1. Makinodan M, Rosen KM, Ito S & Corfas G A critical period for social experience-dependent oligodendrocyte maturation and myelination. Science 337, 1357–1360, doi:10.1126/science.1220845 (2012). - DOI - PMC - PubMed

Publication types

LinkOut - more resources