[Preprint]. 2020 Jun 17:2020.06.16.155101.
doi: 10.1101/2020.06.16.155101.

Genome-wide CRISPR screen reveals host genes that regulate SARS-CoV-2 infection

Affiliations

Genome-wide CRISPR screen reveals host genes that regulate SARS-CoV-2 infection

Jin Wei et al. bioRxiv. .

Update in

  • Genome-wide CRISPR Screens Reveal Host Factors Critical for SARS-CoV-2 Infection.
    Wei J, Alfajaro MM, DeWeirdt PC, Hanna RE, Lu-Culligan WJ, Cai WL, Strine MS, Zhang SM, Graziano VR, Schmitz CO, Chen JS, Mankowski MC, Filler RB, Ravindra NG, Gasque V, de Miguel FJ, Patil A, Chen H, Oguntuyo KY, Abriola L, Surovtseva YV, Orchard RC, Lee B, Lindenbach BD, Politi K, van Dijk D, Kadoch C, Simon MD, Yan Q, Doench JG, Wilen CB. Wei J, et al. Cell. 2021 Jan 7;184(1):76-91.e13. doi: 10.1016/j.cell.2020.10.028. Epub 2020 Oct 20. Cell. 2021. PMID: 33147444 Free PMC article.

Abstract

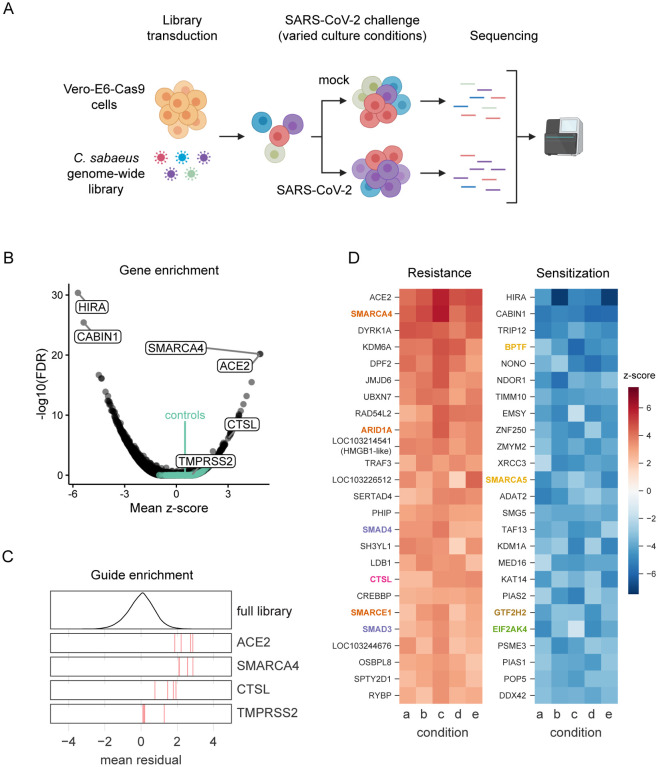
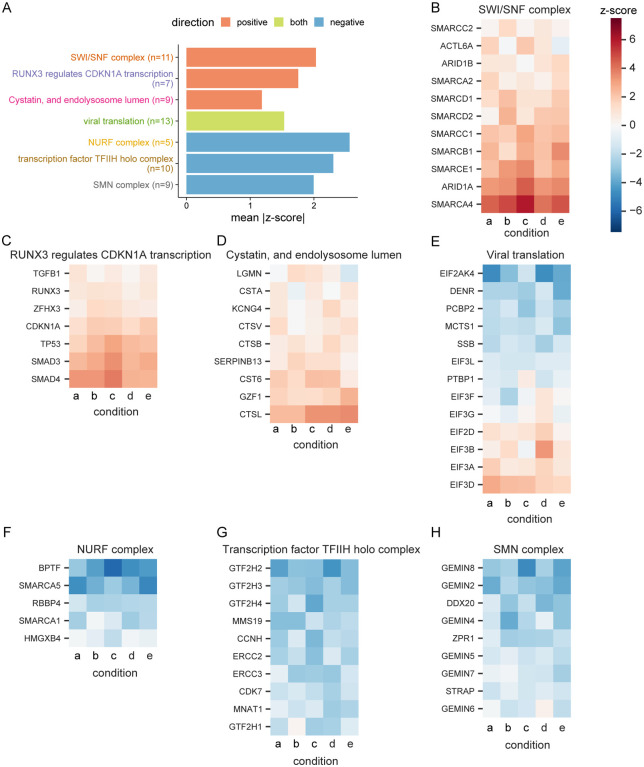
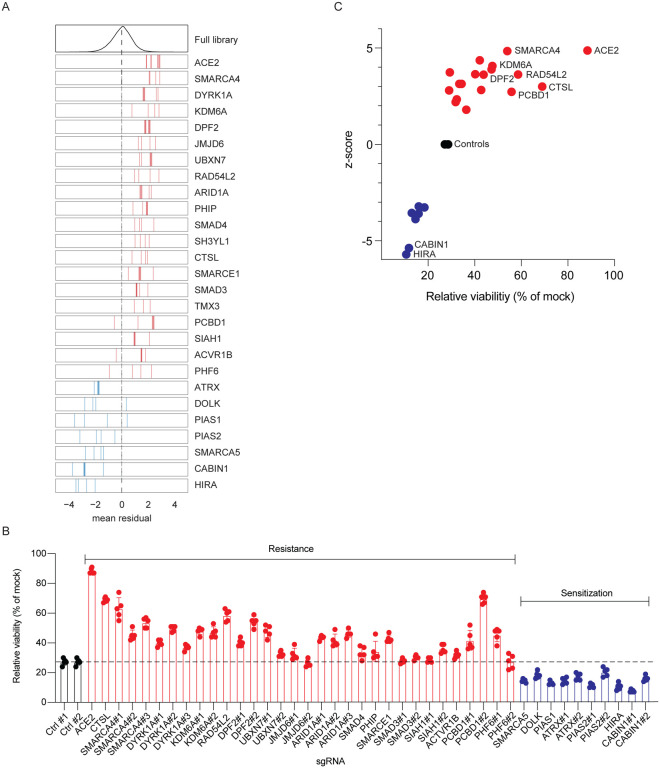
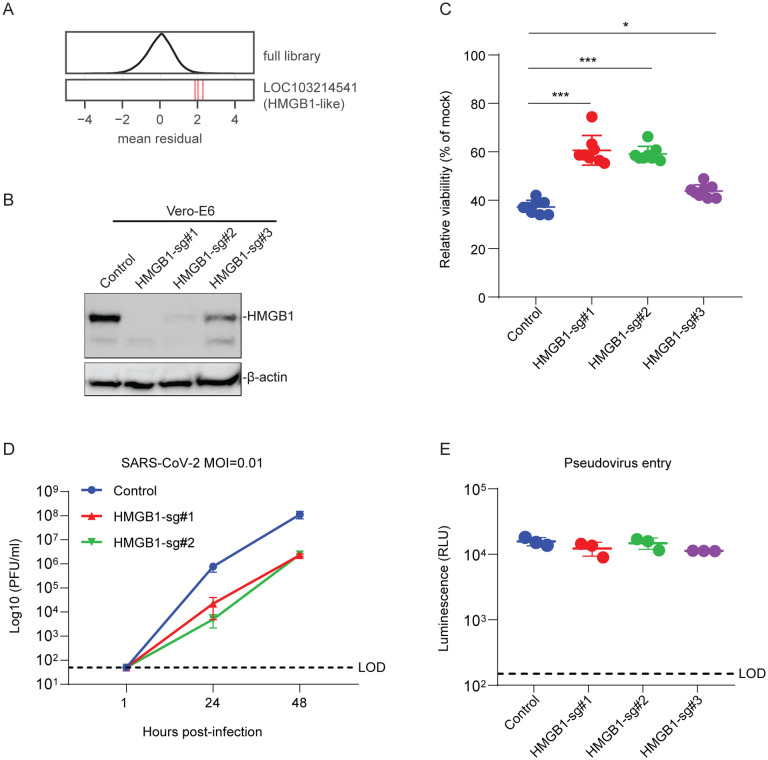
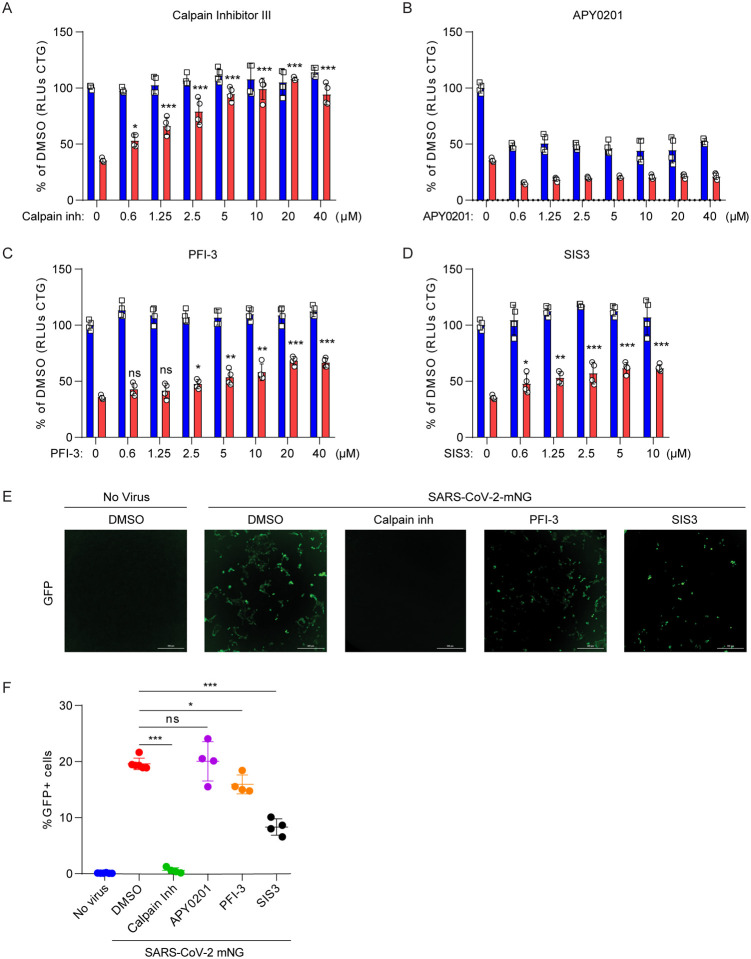
Identification of host genes essential for SARS-CoV-2 infection may reveal novel therapeutic targets and inform our understanding of COVID-19 pathogenesis. Here we performed a genome-wide CRISPR screen with SARS-CoV-2 and identified known SARS-CoV-2 host factors including the receptor ACE2 and protease Cathepsin L. We additionally discovered novel pro-viral genes and pathways including the SWI/SNF chromatin remodeling complex and key components of the TGF-β signaling pathway. Small molecule inhibitors of these pathways prevented SARS-CoV-2-induced cell death. We also revealed that the alarmin HMGB1 is critical for SARS-CoV-2 replication. In contrast, loss of the histone H3.3 chaperone complex sensitized cells to virus-induced death. Together this study reveals potential therapeutic targets for SARS-CoV-2 and highlights host genes that may regulate COVID-19 pathogenesis.


Conflict of interest statement

Competing interests

Yale University (CBW) has a patent pending related to this work entitled: “Compounds and Compositions for Treating, Ameliorating, and/or Preventing SARS-CoV-2 Infection and/or Complications Thereof.” Yale University has committed to rapidly executable non-exclusive royalty-free licenses to intellectual property rights for the purpose of making and distributing products to prevent, diagnose and treat COVID-19 infection during the pandemic and for a short period thereafter. JGD consults for Foghorn Therapeutics, Maze Therapeutics, Merck, Agios, and Pfizer; JGD consults for and has equity in Tango Therapeutics.

Figures

Fig. 1.
Fig. 1.. Genome-wide CRISPR screen identifies genes critical for SARS-CoV-2-induced cell death.
(A) Schematic of pooled screen. Vero-E6 cells expressing Cas9 were transduced with the genome-wide C. sabaeus library via lentivirus. The transduced cell population then either received a mock treatment or was challenged with SARS-CoV-2 under various culture conditions. Surviving cells from each condition were isolated and the sgRNA sequences were amplified by PCR and sequenced. (B) Volcano plot showing top genes conferring resistance and sensitivity to SARS-CoV-2. The gene-level z-score and -log10(FDR) were both calculated using the mean of the five Cas9-v2 conditions. Non-targeting control sgRNAs were randomly grouped into sets of 4 to serve as “dummy” genes and are shown in green. (C) Performance of individual guide RNAs targeting ACE2, SMARCA4, CTSL, and TMPRSS2. The mean residual across the five Cas9-v2 conditions is plotted for the full library (top) and for the 4 guide RNAs targeting each gene. (D) Heatmaps of the top 25 gene hits for resistance and sensitivity, ranked by mean z-score in the Cas9-v2 conditions.Genes that are included in one of the gene sets labeled in (Fig 2A) are colored accordingly. Condition a: Cas9v2 D5 2.5e6 Hi-MOI; b: Cas9v2 D5 5e6 Hi-MOI; c: Cas9v2 D2 5e6 Hi-MOI; d: Cas9v2 D10 5e6 Hi-MOI; e: Cas9v2 D5 2.5e6 Lo-MOI.
Fig. 2.
Fig. 2.. Performance of genes in top selected gene sets.
(A) Top three gene sets, which score in the positive direction (resistance), negative direction (sensitization), or both, filtered for gene sets with at least five genes and which are most central to a given module (Fig. S3) and then ranked by mean absolute z-score. There was only one gene set which met these criteria and scored on both ends. The number of genes in each set is indicated in parentheses. For each gene in the “SWI/SNF complex” gene set from STRING, the z-score in each culture condition is shown. Similarly, the genes in the gene sets (B) “RUNX3 regulates CDKN1A transcription” from Reactome, (C) “Cystatin, and endolysosome lumen” from STRING, (D) “viral translation” from GO, (E) “NURF complex” from GO, (F) “transcription factor TFIIH holo complex” from GO, and (G) “SMN complex” from GO are shown. Condition a: Cas9v2 D5 2.5e6 Hi-MOI; b: Cas9v2 D5 5e6 Hi-MOI; c: Cas9v2 D2 5e6 Hi-MOI; d: Cas9v2 D10 5e6 Hi-MOI; e: Cas9v2 D5 2.5e6 Lo-MOI.
Fig. 3.
Fig. 3.. Arrayed validation of 18 resistance and 7 sensitization hit genes.
(A) Performance in the pooled screen of guide RNAs targeting the 25 genes selected for further validation. The mean residual across the five Cas9-v2 conditions is plotted for the full library (top) and for the 3–4 guide RNAs targeting each gene. Genes that scored as resistance hits are shown in red; genes that scored as sensitization hits are shown in blue. The dashed line indicates a residual of 0. (B) 42 unique sgRNAs targeting 25 genes were introduced into VeroE6 cells. SARS-CoV-2 was added at MOI 0.2 and cell viability was measured at 3 dpi. (C). Z-scores from CRISPR screen correlate with cell viability of individually disrupted genes. Genes with multiple sgRNAs from (B) are averaged to generate one point per gene in (C). Data in (B) and (C) is representative of one of three independent experiments each done in quintuplicate.
Fig. 4.
Fig. 4.. HMGB1 is required for efficient SARS-CoV-2 induced cell death.
(A) Performance of individual guide RNAs targeting LOC103214541 (HMGB1-like). The mean residual across the five Cas9-v2 conditions is plotted for the full library (top) and for the 3 guide RNAs targeting that gene. (B) Western blot for HMGB1 expression in control and HMGB1 sgRNAs transduced Vero-E6 cells. (C) Control and HMGB1 sgRNAs transduced Vero-E6 cells were infected with SARS-CoV-2 at a MOI of 0.2. Cell viability relative to an uninfected control was measured 3dpi with CellTiter Glo. (D) Vero-E6 cells were infected with SARS-CoV-2 at a MOI of 0.1. Viral production as measured by plaque forming units (PFU/ml) was determined by plaque assay. (E) Vero-E6 cells were infected with VSV-G or SARS-CoV-2-Spike pseudovirus. Luminescence was measured 1dpi. LOD, limit of detection. Data was analyzed by Mann-Whitney test. Shown are means ± SEM. ns, not statistically significant; *P < 0.05; **P < 0.01; ***P < 0.001. Data in (C) are one representative experiment from three independent times each in octuplicate. Data in (D-E) are one representative experiment from two independent experiments each performed in triplicate.
Fig. 5.
Fig. 5.. Small molecules protect cells from SARS-CoV-2 induced cell death.
(A to D) Vero-E6 cells were pretreated with the indicated concentration of Cathepsin L inhibitor Calpain Inhibitor III (A), PIKfyve inhibitor APY0201 (B) SMARCA4 inhibitor PFI-3 (C), SMAD3 inhibitor SIS3 (D) for 48 hours and then infected with SARS-CoV-2 at a MOI of 0.2. Cell viability was measured at 3dpi and compared to mock infected controls. Red, infected; blue, mock (E to F) Vero-E6 cells were pretreated with 10 μM Calpain inhibitor III, PFI-3 or SIS3 for 48 hours and then infected with icSARS-CoV-2 mNG at a MOI of 1. Infected cell frequencies were measured by mNeonGreen expression at 2 dpi. Data were analyzed by one-way ANOVA with Tukey’s multiple comparison test.. Shown are means ± SEM. ns, not statistically significant; *P < 0.05; **P < 0.01; ***P < 0.001. Data are pooled from two independent experiments each in duplicate except in (E), where results are shown from one representative experiment.

References

    1. An interactive web-based dashboard to track COVID-19 in real time. Lancet Infect. Dis. 20, 533–534 (2020). - PMC - PubMed
    1. Cui J., Li F., Shi Z. L., Origin and evolution of pathogenic coronaviruses. Nat. Rev. Microbiol. 17, 181–192 (2019). - PMC - PubMed
    1. Li F., Structure, Function, and Evolution of Coronavirus Spike Proteins. Annual Review of Virology. 3 (2016), pp. 237–261. - PMC - PubMed
    1. Tang Q., Song Y., Shi M., Cheng Y., Zhang W., Xia X.-Q., Inferring the hosts of coronavirus using dual statistical models based on nucleotide composition. Sci. Rep. 5, 17155 (2015). - PMC - PubMed
    1. Guan Y., Zheng B. J., He Y. Q., Liu X. L., Zhuang Z. X., Cheung C. L., Luo S. W., Li P. H., Zhang L. J., Guan Y. J., Butt K. M., Wong K. L., Chan K. W., Lim W., Shortridge K. F., Yuen K. Y., Peiris J. S., Poon L. L., Isolation and characterization of viruses related to the SARS coronavirus from animals in southern China. Science. 302, 276–278 (2003). - PubMed

Publication types