[Preprint]. 2020 Aug 29:2020.05.23.20111419.
doi: 10.1101/2020.05.23.20111419.

Visualizing the invisible: The effect of asymptomatic transmission on the outbreak dynamics of COVID-19

Affiliations

Visualizing the invisible: The effect of asymptomatic transmission on the outbreak dynamics of COVID-19

Mathias Peirlinck et al. medRxiv. .

Update in

Abstract

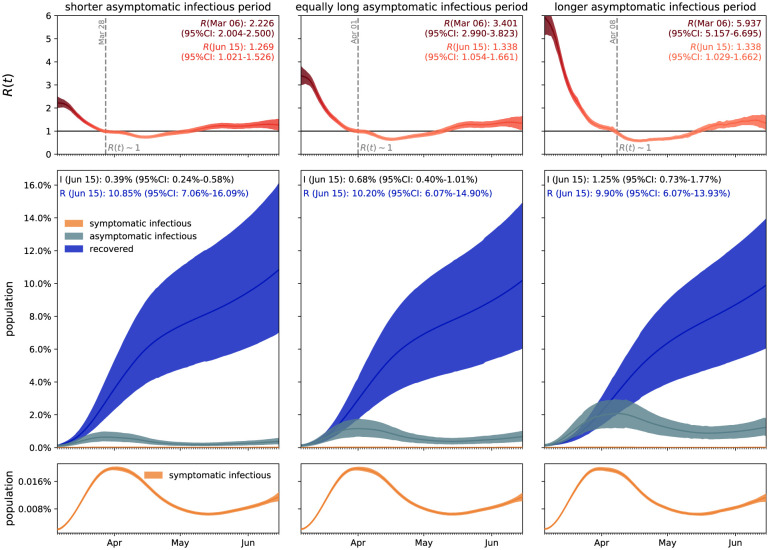
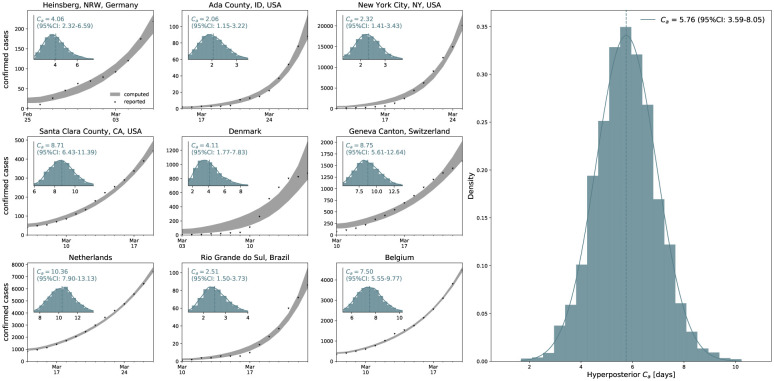
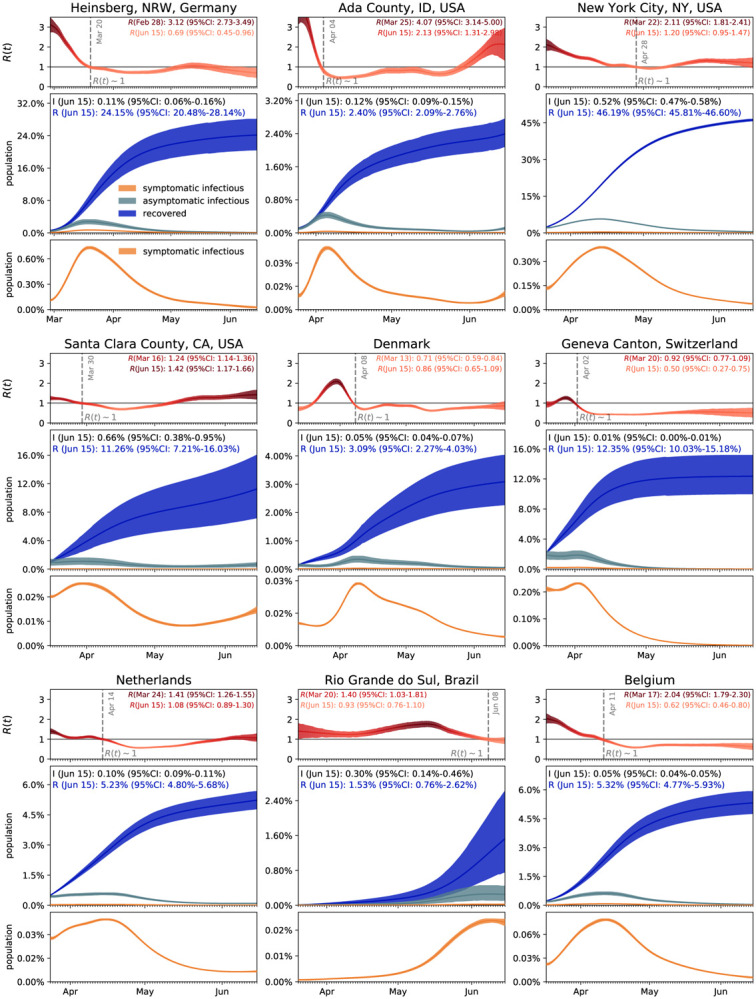
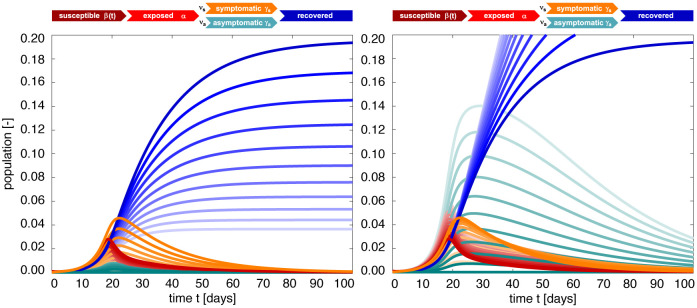
Understanding the outbreak dynamics of the COVID-19 pandemic has important implications for successful containment and mitigation strategies. Recent studies suggest that the population prevalence of SARS-CoV-2 antibodies, a proxy for the number of asymptomatic cases, could be an order of magnitude larger than expected from the number of reported symptomatic cases. Knowing the precise prevalence and contagiousness of asymptomatic transmission is critical to estimate the overall dimension and pandemic potential of COVID-19. However, at this stage, the effect of the asymptomatic population, its size, and its outbreak dynamics remain largely unknown. Here we use reported symptomatic case data in conjunction with antibody seroprevalence studies, a mathematical epidemiology model, and a Bayesian framework to infer the epidemiological characteristics of COVID-19. Our model computes, in real time, the time-varying contact rate of the outbreak, and projects the temporal evolution and credible intervals of the effective reproduction number and the symptomatic, asymptomatic, and recovered populations. Our study quantifies the sensitivity of the outbreak dynamics of COVID-19 to three parameters: the effective reproduction number, the ratio between the symptomatic and asymptomatic populations, and the infectious periods of both groups For nine distinct locations, our model estimates the fraction of the population that has been infected and recovered by Jun 15, 2020 to 24.15% (95% CI: 20.48%-28.14%) for Heinsberg (NRW, Germany), 2.40% (95% CI: 2.09%-2.76%) for Ada County (ID, USA), 46.19% (95% CI: 45.81%-46.60%) for New York City (NY, USA), 11.26% (95% CI: 7.21%-16.03%) for Santa Clara County (CA, USA), 3.09% (95% CI: 2.27%-4.03%) for Denmark, 12.35% (95% CI: 10.03%-15.18%) for Geneva Canton (Switzerland), 5.24% (95% CI: 4.84%-5.70%) for the Netherlands, 1.53% (95% CI: 0.76%-2.62%) for Rio Grande do Sul (Brazil), and 5.32% (95% CI: 4.77%-5.93%) for Belgium. Our method traces the initial outbreak date in Santa Clara County back to January 20, 2020 (95% CI: December 29, 2019 - February 13, 2020). Our results could significantly change our understanding and management of the COVID-19 pandemic: A large asymptomatic population will make isolation, containment, and tracing of individual cases challenging. Instead, managing community transmission through increasing population awareness, promoting physical distancing, and encouraging behavioral changes could become more relevant.


Figures

Figure 1:
Figure 1:. SEIIR epidemiology model.
The SEIIR model contains five compartments for the susceptible, exposed, symptomatic infectious, asymptomatic infectious, and recovered populations. The transition rates between the compartments, β, α, and γ are inverses of the contact period B = 1/β, the latent period A = 1/α, and the infectious period C = 1/γ. The symptomatic and asymptomatic groups have the same latent period A, but they can have individual contact periods Bs = 1/βs and Ba = 1/βa and individual infectious periods Cs = 1/γs and Ca = 1/γa. The fractions of the symptomatic and asymptomatic subgroups of the infectious population are νs and νa. We assume that the infection either goes through the symptomatic or the asymptomatic path, but not both for one individual.
Figure 2:
Figure 2:. SEIR epidemiology model.
The SEIR model contains four compartments for the susceptible, exposed, infectious, and recovered populations. The transition rates between the compartments, β, α, and γ are inverses of the contact period B = 1/β, the latent period A = 1/α, and the infectious period C = 1/γ. If the transition rates are similar for the symptomatic and asymptomatic groups, the SEIIR model simplifies to the SEIR model with Is = νsI and Ia = νaI.
Figure 3:
Figure 3:. Outbreak dynamics of COVID-19 in Santa Clara County.
The simulation learns the time-varying contact rate β(t) for fixed latent and symptomatic infectious periods A = 2.5 days and Cs = 6.5 days, and for three asymptomatic infectious periods Ca = 3.25 days, 6.5 days, and 13.0 days (from left to right). Computed and reported confirmed cases in Santa Clara County, D(t) = Is(t) + Rs(t) and D^(t) (top), initial exposed and infectious populations, E0, Is0, and Ia0 (middle), and dynamic contact rate, β(t) (bottom). The gray and green-blue regions highlight the 95% credible intervals on the confirmed cases D(t) (top) and the contact rate β(t) (bottom) based on the reported cases D^(t), while taking into account uncertainties on the fraction of the symptomatic infectious population νs = Is/I, and the initial exposed and infectious populations E0, Is0, and Ia0.
Figure 4:
Figure 4:. Effect of asymptomatic transmission of COVID-19 in Santa Clara County.
The simulation learns the time-varying contact rate β(t), and with it the time-varying effective reproduction number R(t), for fixed latent and symptomatic infectious periods A = 2.5 days and Cs = 6.5 days, and for three asymptomatic infectious periods Ca = 3.25 days, 6.5 days, and 13.0 days (from left to right). The downward trend of the effective reproduction number R(t) reflects the efficiency of public health interventions (top row). The dashed vertical lines mark the critical time period during which the effective reproductive reproduction number fluctuates around R(t) = 1. The simulation predicts the symptomatic infectious, asymptomatic infectious, and recovered populations Is, Ia, and R (bottom row). The colored regions highlight the 95% credible interval for uncertainties in the number of confirmed cases D, the fraction of the symptomatic infectious population νs = Is/I, the initial exposed population E0 and the initial infectious populations Is0 and Ia0.
Figure 5:
Figure 5:. Hierarchical asymptomatic infectious period Ca estimation.
Assuming an initial fixed reproduction number R0 = 3.87 (95%CI: 3.01–4.66) [17], the simulation generates histograms of the asymptomatic infectious period Ca for each location based on the location-specific symptomatic fraction νs. The black dots and grey regions represent the reported and simulated detected cases D^(t) and D(t) respectively. The hierarchical hyperdistribution for the asymptomatic infectious period results in Ca = 5.76 (95%CI: 3.59–8.09) days, right histogram.
Figure 6:
Figure 6:. Outbreak dynamics of COVID-19 worldwide.
Dynamic effective reproduction number R(t) and symptomatic, asymptomatic, and recovered populations at all nine locations. The simulation learns the time-varying contact rate β(t), and with it the time-varying effective reproduction number R(t), to predict the symptomatic infectious, asymptomatic infectious, and recovered populations Is, Ia, and R, for fixed latent and infectious periods A = 2.5 days, Cs = 6.5 days, the hierarchical asymptomatic infectious period Ca = 5.76 (95%CI: 3.59–8.09) days from Figure 5. The dashed vertical lines mark the the first time each location managed to lower the effective reproduction below R(t) = 1 after lockdown. The colored regions highlight the 95% credible interval for the effective reproductive number R(t) (top), the symptomatic and asymptomatic populations Is and Ia, and the recovered population R (bottom plots), for uncertainties in the number of confirmed cases D, the fraction of the symptomatic infectious population νs, the initial exposed population E0, and the initial infectious populations Is0 and Ia0.
Figure 7:
Figure 7:. Estimating the outbreak date of COVID-19 in Santa Clara County varying asymptomatic infectious periods Ca.
Estimated date of the first COVID-19 case in Santa Clara County for fixed latent and symptomatic infectious periods A = 2.5 days and Cs = 6.5 days, and for the hierarchical asymptomatic infectious period Ca = 5.76 (95%CI: 3.59–8.09) days from Figure 5. The colored regions in the main plot highlight the 95% credible interval for the time evolution of the exposed and asymptomatic infectious populations E and Ia estimated based on the reported cases D^(t) from March 16, 2020 onward and taking into account uncertainties on the fraction of the symptomatic infectious population νs = Is/I, and the exposed and asymptomatic infectious populations E0 and Ia0 on March 16, 2020 (right plot). The bottom plot histogram shows the distribution of the most probable origin dates to January 20, 2020 (95% CI: December 29, 2019 – February 13, 2020).
Figure 8:
Figure 8:. SEIIR epidemiology model. Sensitivity with respect to the symptomatic fraction νs.
Darkest curves correspond to the special case of no asymptomatic transmission, νs = 1.0, lightest curves to only asymptomatic transmission, νs = 0.0. For a smaller asymptomatic infectious period of Ca = 0.5Cs, the outbreak dynamics are governed by the symptomatic population Is and the recovered population R decreases with increasing asymptomatic transmission νa (left). For a larger asymptomatic infectious period of Ca = 2Cs, the outbreak dynamics are governed by the asymptomatic population Ia and the recovered population increases with increasing asymptomatic transmission (right). Latent period A = 2.5 days, symptomatic infectious period Cs = 6.5 days, asymptomatic infectious period Ca = 3.25 days (left) and Ca = 13 days (right), and contact rate β(t)=β012[1+tanh([tt*]/T)][β0βt] with β0 = 0.65 /days, βt = 0.10 /days, t* = 18.61 days, and T = 10.82 days.
Figure 9:
Figure 9:. SEIIR epidemiology model. Sensitivity with respect to the asymptomatic infectious period Ca.
Darkest curves correspond to a larger asymptomatic infectious period of Ca = 2Cs, lightest curves to a smaller period Ca = 0.5Cs. For a larger symptomatic fraction of νs = 0.8, the outbreak dynamics are governed by the symptomatic population Is and the recovered population R is relatively insensitive to the asymptomatic infectious period Ca (left). For a smaller symptomatic fraction of νs = 0.2, the outbreak dynamics are governed by the asymptomatic population Ia and the recovered population R increases markedly with an increasing asymptomatic infectious period Ca (right). Latent period A = 2.5 days, symptomatic infectious period Cs = 6.5 days, asymptomatic infectious period Ca = 3.25 days (left) and Ca = 13 days (right), and contact rate β(t)=β012[1+tanh([tt*]/T)][β0βt] with β0 = 0.65 /days, βt = 0.10 /days, t* = 18.61 days, and T = 10.82 days.

Similar articles

References

    1. Allday E., Kawahara M.. First known U.S. coronavirus death occurred on Feb. 6 in Santa Clara County. San Francisco Chronicle, April 22, 2020. https://www.sfchronicle.com/health/article/First-known-U-S-coronavirus-d... assessed: Jun 15, 2020.
    1. Aron J. L., Schwartz I. B.. Seasonality and period-doubling bifurcation in an epidemic model. Journal of Theoretical Biology 110 (1984) 665–679. - PubMed
    1. Bendavic E., Mulaney B., Sood N., Shah S., Ling E., Bromley-Dulfano R., Lai C., Weissberg Z., Saavedra-Walker R., Tedrow J., Tversky D., Bogan A., Kupiec T., Eichner D., Gupta R., Ioannidis J.P.A., Bhattacharya J.. COVID-19 antibody seroprevalence in Santa Clara County, California. medRxiv doi:10.1101/2020.04.14.20062463 - DOI - PMC - PubMed
    1. Bryan A., Pepper G., Wener M.H., Fink S.L., Morishima C., Chaudhary A., Jerome K.R., Mathias P.C., Greninger A.L. Performance Characteristics of the Abbott Architect SARS-CoV-2 IgG Assay and Seroprevalence in Boise, Idaho J Clin Microbiol. 2020. doi:10.1128/JCM.00941-20 - DOI - PMC - PubMed
    1. Painel de casos de doença pelo coronavírus 2019 (COVID-19) no Brasil pelo Ministerio da Saude. www.covid.saude.gov.br/ assessed: Jun 15, 2020.

Publication types