This is a preprint.
Real-time, interactive website for US-county level Covid-19 event risk assessment
- PMID: 32869038
- PMCID: PMC7457615
- DOI: 10.1101/2020.08.24.20181271
Real-time, interactive website for US-county level Covid-19 event risk assessment
Update in
-
Real-time, interactive website for US-county-level COVID-19 event risk assessment.Nat Hum Behav. 2020 Dec;4(12):1313-1319. doi: 10.1038/s41562-020-01000-9. Epub 2020 Nov 9. Nat Hum Behav. 2020. PMID: 33168955 Free PMC article.
Abstract
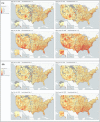
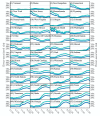
Large events and gatherings, particularly those taking place indoors, have been linked to multi-transmission events that have accelerated the pandemic spread of severe acute respiratory syndrome coronavirus 2 (SARS-CoV-2). To provide real-time, geo-localized risk information, we developed an interactive online dashboard that estimates the risk that at least one individual with SARS-CoV-2 is present in gatherings of different sizes in the United States. The website combines documented case reports at the county level with ascertainment bias information obtained via population-wide serological surveys to estimate real time circulating, per-capita infection rates. These rates are updated daily as a means to visualize the risk associated with gatherings, including county maps and state-level plots. The website provides data-driven information to help individuals and policy-makers make prudent decisions (e.g., increasing mask wearing compliance and avoiding larger gatherings) that could help control the spread of SARS-CoV-2, particularly in hard-hit regions.
Figures


References
-
- Armstrong M. P., & Densham P. J. (1990). Database organization strategies for spatial decision support systems. International Journal of Geographical Information Systems, 4, 3–20.
-
- Arnold C. (2020, March). COVID-19: Biomedical research in a world under social-distancing measures. Nature Medicine. - PubMed
-
- Centers for Disease Control and Prevention. (2020a). Commercial Laboratory Seroprevalence Survey Data. Retrieved from https://www.cdc.gov/coronavirus/2019-ncov/cases-updates/commercial-lab-s...
-
- Centers for Disease Control and Prevention. (2020b). COVID-19 Pandemic Planning Scenarios. Retrieved from https://www.cdc.gov/coronavirus/2019-ncov/hcp/planning-scenarios.html
-
- Centers for Disease Control and Prevention. (2020c). Duration of Isolation and Precautions for Adults with COVID-19. Retrieved from https://www.cdc.gov/coronavirus/2019-ncov/hcp/duration-isolation.html
Publication types
LinkOut - more resources
Full Text Sources
Miscellaneous
