

This is a preprint.
Phylogenetic analysis of SARS-CoV-2 in the Boston area highlights the role of recurrent importation and superspreading events
- PMID: 32869040
- PMCID: PMC7457619
- DOI: 10.1101/2020.08.23.20178236
Phylogenetic analysis of SARS-CoV-2 in the Boston area highlights the role of recurrent importation and superspreading events
Update in
-
Phylogenetic analysis of SARS-CoV-2 in Boston highlights the impact of superspreading events.Science. 2021 Feb 5;371(6529):eabe3261. doi: 10.1126/science.abe3261. Epub 2020 Dec 10. Science. 2021. PMID: 33303686 Free PMC article.
Abstract
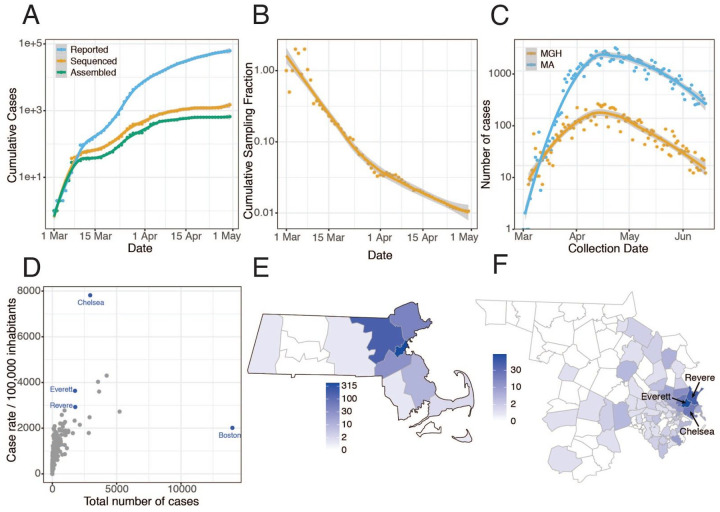
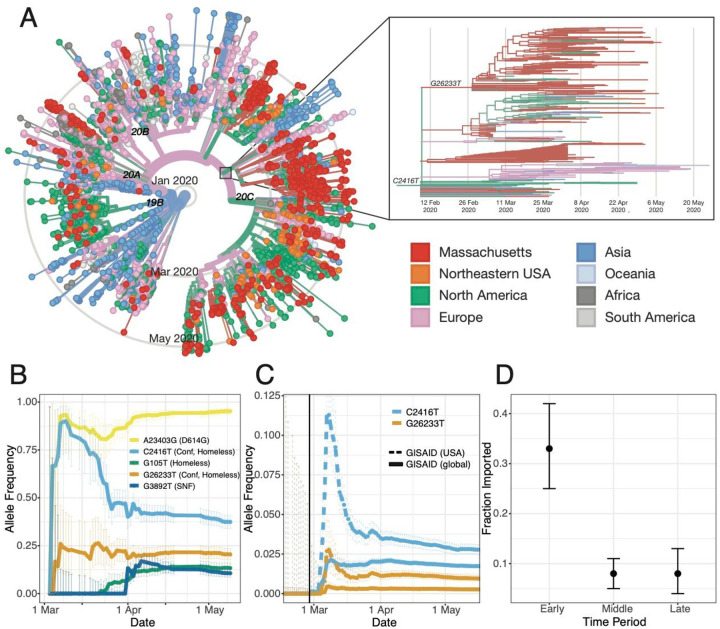
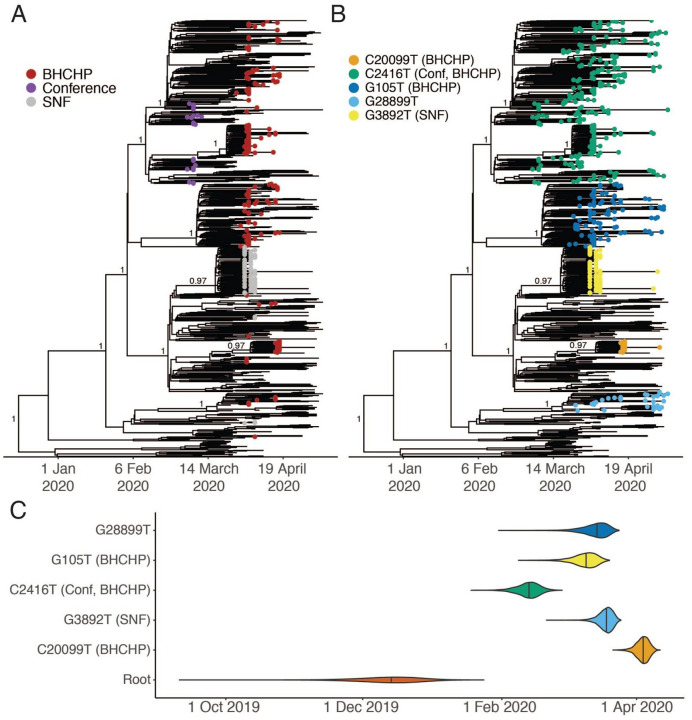
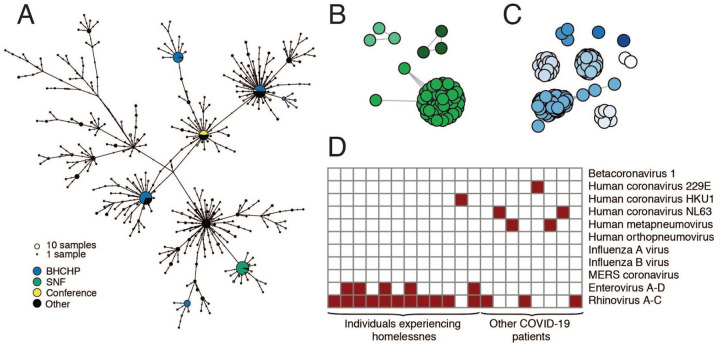
SARS-CoV-2 has caused a severe, ongoing outbreak of COVID-19 in Massachusetts with 111,070 confirmed cases and 8,433 deaths as of August 1, 2020. To investigate the introduction, spread, and epidemiology of COVID-19 in the Boston area, we sequenced and analyzed 772 complete SARS-CoV-2 genomes from the region, including nearly all confirmed cases within the first week of the epidemic and hundreds of cases from major outbreaks at a conference, a nursing facility, and among homeless shelter guests and staff. The data reveal over 80 introductions into the Boston area, predominantly from elsewhere in the United States and Europe. We studied two superspreading events covered by the data, events that led to very different outcomes because of the timing and populations involved. One produced rapid spread in a vulnerable population but little onward transmission, while the other was a major contributor to sustained community transmission, including outbreaks in homeless populations, and was exported to several other domestic and international sites. The same two events differed significantly in the number of new mutations seen, raising the possibility that SARS-CoV-2 superspreading might encompass disparate transmission dynamics. Our results highlight the failure of measures to prevent importation into MA early in the outbreak, underscore the role of superspreading in amplifying an outbreak in a major urban area, and lay a foundation for contact tracing informed by genetic data.
Conflict of interest statement
Competing interests: J.E.L. has received consulting fees from Sherlock Biosciences. J.B. has been a consultant for T2 Biosystems, DiaSorin, and Roche Diagnostics. A.P. is a Venture Partner at Google Ventures. P.C.S. is a co-founder and shareholder of Sherlock Biosciences, and a Board member and shareholder of Danaher Corporation.
Figures
References
-
- Center for Systems Science and Engineering (CSSE) at Johns Hopkins University (JHU), COVID-19 Dashboard, (available at https://coronavirus.jhu.edu/map.html). - PMC - PubMed
-
- MA Department of Public Health, Man returning from Wuhan, China is first case of 2019 Novel Coronavirus confirmed in Massachusetts (2020), (available at https://www.mass.gov/news/man-returning-from-wuhan-china-is-first-case-o...).
-
- Coronavirus COVID-19 Cases in Massachusetts (2020), (available at http://boston.maps.arcgis.eom/apps/opsdashboard/index.html#/a2f67ae81479...).
-
- Arons M. M., Hatfield K. M., Reddy S. C., Kimball A., James A., Jacobs J. R., Taylor J., Spicer K., Bardossy A. C., Oakley L. P., Tanwar S., Dyal J. W., Harney J., Chisty Z., Bell J. M., Methner M., Paul P., Carlson C. M., McLaughlin H. P., Thornburg N., Tong S., Tamin A., Tao Y., Uehara A., Harcourt J., Clark S., Brostrom-Smith C., Page L. C., Kay M., Lewis J., Montgomery P., Stone N. D., Clark T. A., Honein M. A., Duchin J. S., Jernigan J. A., Public Health-Seattle and King County and CDC COVID-19 Investigation Team, Presymptomatic SARS-CoV-2 Infections and Transmission in a Skilled Nursing Facility. N. Engl. J. Med. 382, 2081–2090 (2020). - PMC - PubMed
Publication types
Grants and funding
LinkOut - more resources
Full Text Sources
Miscellaneous