. 2020 Sep 1:9:e59003.
doi: 10.7554/eLife.59003.

Extensive and spatially variable within-cell-type heterogeneity across the basolateral amygdala

Affiliations

Extensive and spatially variable within-cell-type heterogeneity across the basolateral amygdala

Timothy P O'Leary et al. Elife. .

Abstract

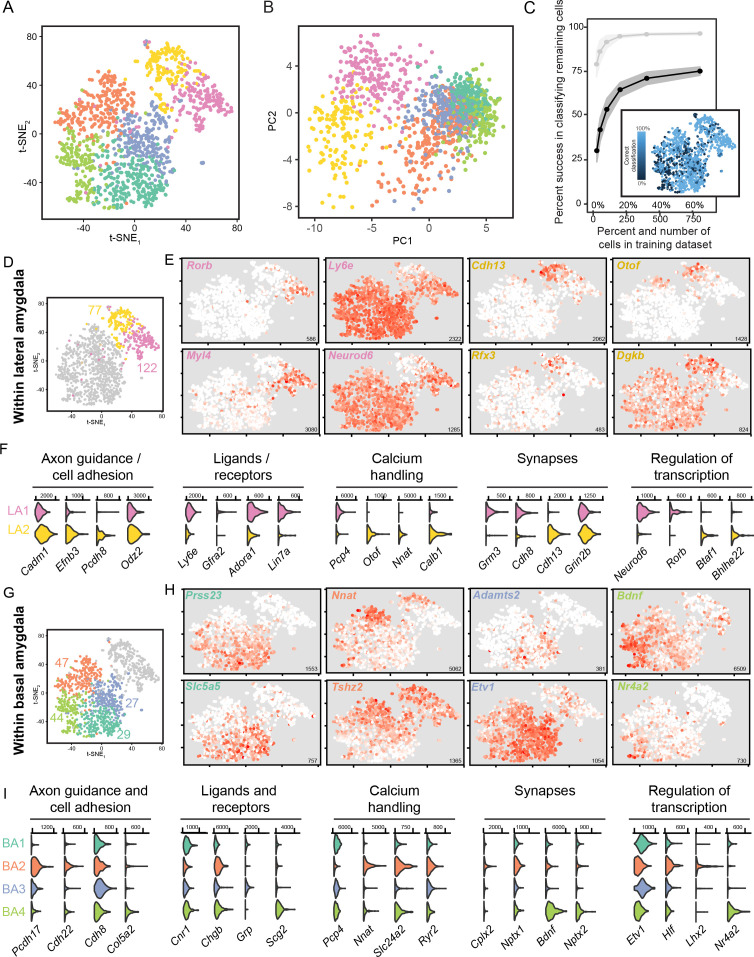
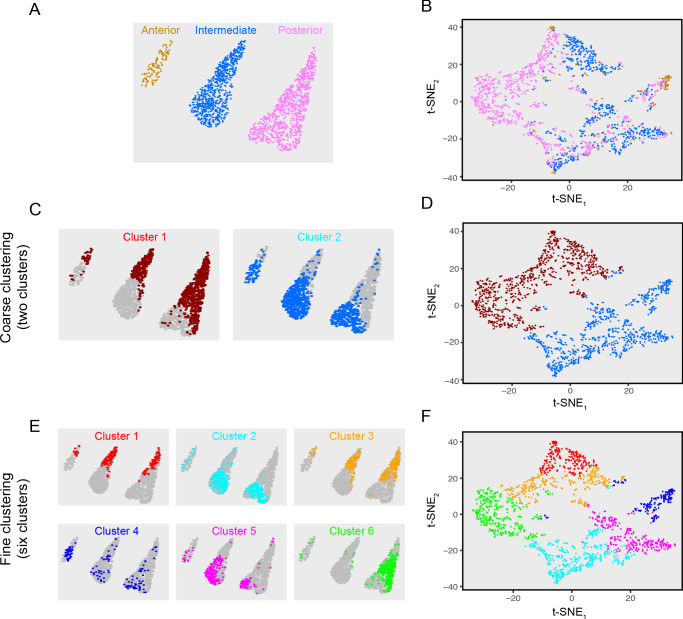
The basolateral amygdala complex (BLA), extensively connected with both local amygdalar nuclei as well as long-range circuits, is involved in a diverse array of functional roles. Understanding the mechanisms of such functional diversity will be greatly informed by understanding the cell-type-specific landscape of the BLA. Here, beginning with single-cell RNA sequencing, we identified both discrete and graded continuous gene-expression differences within the mouse BLA. Via in situ hybridization, we next mapped this discrete transcriptomic heterogeneity onto a sharp spatial border between the basal and lateral amygdala nuclei, and identified continuous spatial gene-expression gradients within each of these regions. These discrete and continuous spatial transformations of transcriptomic cell-type identity were recapitulated by local morphology as well as long-range connectivity. Thus, BLA excitatory neurons are a highly heterogenous collection of neurons that spatially covary in molecular, cellular, and circuit properties. This heterogeneity likely drives pronounced spatial variation in BLA computation and function.

Keywords: amygdala; cell type; mouse; neural circuits; neuroscience; transcriptomics.


Conflict of interest statement

TO, KS, LW, JC, AL, MC No competing interests declared

Figures

Figure 1.
Figure 1.. Workflow for assessing heterogeneity within the basolateral amygdala complex.
(A) Atlas schematic of the basolateral amygdala complex (BLA), schematizing microdissection for scRNA-seq. (B) Overview of scRNA-seq data, as visualized through t-SNE dimensionality reduction. Data, along with analysis and visualization tools, available at http://scrnaseq.janelia.org/amygdala. (C) Analysis of coarse discrete heterogeneity within the BLA (see Figures 2 and 3). (D) Analysis of fine continuous heterogeneity within the BLA (see Figures 4 and 5). (E) Spatial registration of discrete and continuous heterogeneity (see Figure 6). (F) Higher order discrete and continuous heterogeneity within the BLA (see Figures 7 and 8).
Figure 2.
Figure 2.. scRNA-seq analysis of coarse, discrete transcriptomic differences.
(A) Overview of scRNA-seq data, as visualized through t-SNE dimensionality reduction and colored according to cluster identity. The number of enriched genes for each cluster is provided. (B) As in (A), but with projections onto the first two principal components. (C) Random forest classification of subsampled data. (D) Expression of known control genes. Expression is colored from low (white) to high (red). Inset numerical values denote maximum CPM value across all cells. (E) As in (D), but with novel cluster-enriched marker genes. (F) Functionally relevant neuronal genes that are differentially expressed between clusters. Numerical values denote CPM values of right tick mark.
Figure 2—figure supplement 1.
Figure 2—figure supplement 1.. UMAP and t-SNE dimensionality reduction recapitulate the same general organization.
(A) UMAP visualization of scRNA-seq, with two coarse clusters. (B) t-SNE visualization of scRNA-seq data, with two coarse clusters, included for comparison to UMAP reduction. (C,D) As in (A,B), but for six finer subpopulations.
Figure 2—figure supplement 2.
Figure 2—figure supplement 2.. Comparison with previously published BLA scRNA-seq data.
(A) t-SNE visualization of scRNA-seq from Zeisel et al., 2018 excitatory basolateral amygdala neurons (‘TEGLU22’). Example enriched genes listed, which tend to correlate with cell health (e.g. Malat1, mt-Atp6) or with neuronal populations outside of the BLA (e.g. Zbtb20, Strip2; see panels C-Q). (B) As in (A), but for projection onto first two principal components. (C) Expression of Kcng1, a marker restriction to the BLA, in the Allen Mouse Brain Atlas (AMBA) (Lein et al., 2007). (D) Expression of Kcng1 in the TEGLU22 scRNA-seq dataset. Most cells (76%) do not express this BLA marker. (E) Expression of Kcng1 in the dataset of our manuscript. Most cells (86%) express this BLA marker. (F-H) As in (C–E), but for the LA marker Negr1. (I-K) As in (C–E), but for the BA marker Cplx1. L-N. As in (C–E), but for the TEGLU22 marker Strip2, which is expressed outside the BLA. O-Q. As in (L–N), but for Zbtb20.
Figure 3.
Figure 3.. Differentially expressed genes show spatially discrete variation within the BLA.
(A) Three-dimensional coronal volumetric rendering of the BLA in the mouse brain. Image modified from Allen Brain Explorer (Lau et al., 2008). (B,C) As in (A), but for sagittal (B) and horizontal (C) views of the mouse brain. Coronal sections defined in (D) are shown. (D) Coronal sections highlighting the anterior, intermediate, and posterior geometry of the BLA. Atlas definitions of LA vs. BA are shown (modified from Paxinos and Franklin, 2004). (E) Spatial expression of Slc17a7 via chromogenic ISH across the anterior, intermediate, and posterior BLA. Scale bar: 500 μm. Inset shows scRNA-seq expression. (F) Segmentation of Slc17a7-expressing cells from the BLA. (G,H) As in (E,F), but for Negr1 and Ddit4l, novel markers of cluster 1. For reference, locations of segmented cells are superimposed on the location of excitatory (Slc17a7-expressing) neurons within the BLA. (I,J) As in (G,H), but for Cplx1 and Lynx1, novel markers of cluster 2.
Figure 3—figure supplement 1.
Figure 3—figure supplement 1.. Spatial organization of inhibitory marker gene expression, and additional cluster-specific marker gene expression.
(A) Representative ISH images for inhibitory neuron marker genes (Gad1, Slc32a1) along the A/P axis of the BLA (left to right). Inserts show t-SNE visualization of scRNA-seq data for each gene with points colored based on expression levels within cells (white to red). (B) Locations of segmented cells for marker genes along the A/P axis of the BLA (anterior, intermediate, posterior). For reference, locations of cells are superimposed on the location of excitatory neurons (Slc17a7-positive) within the BLA. (C,D) As in (A,B), except for an additional pair of marker genes (Cpne8, Gpr88) for the LA cluster (cluster 1). (E,F) As in (A and B), except for except for an additional pair (Rspo2, Cdh9) of marker genes for the BA cluster (cluster 2).
Figure 3—figure supplement 2.
Figure 3—figure supplement 2.. Cplx1 expression in the lateral amygdala is associated with inhibitory neurons.
(A) Representative mFISH images of Cplx1 and Gad1 expression in the LA. Scale bar: 200 µm. (B) As in (A), but for an expansion of the LA. Scale bar: 20 µm. (C) Summary of Cplx1-expressing cells that co-expressed Gad1 in the LA. Numbers within each bar denote total number of cells in each category (n = 8 sections from n = 5 animals, cells counted manually).
Figure 4.
Figure 4.. scRNA-seq analysis of fine, graded transcriptomic differences.
(A) Overview of scRNA-seq data, as visualized through t-SNE dimensionality reduction, at a relatively fine clustering resolution. (B) As in (A), but with projections onto the first two principal components. (C) Random forest classification of subsampled data. For comparison, results from the coarse 2-cluster scheme are also provided in light grey. Inset illustrates rates of misclassification on a per-cell basis, with misclassified cells typically found at the interface of fine clusters. Inset results depict averages across 1000 simulations for 800 training cells. (D) t-SNE illustration of fine-scale clustering within the LA, with number of enriched genes shown for each subpopulation. (E) Expression of example marker genes for the two subpopulations of LA neurons. Note high gene-to-gene variation in expression for marker genes associated with each subpopulation. Inset numerical values denote maximum CPM value across all cells. (F) Expression of functionally relevant genes that are enriched in each LA subpopulation. (G,H,I) As in (D,E), but for subpopulations of the BA.
Figure 5.
Figure 5.. Graded spatial variation, within the LA and BA, of subpopulation-enriched marker genes.
(A) Representative ISH images for selected LA subpopulation-enriched genes. Scale bar: 500 μm. Insets show t-SNE visualization of scRNA-seq data for each gene. (B) Locations of segmented cells for pairs of genes for each LA subpopulation across anterior, intermediate, and posterior sections. For reference, locations of cells are superimposed on the location of excitatory (Slc17a7-expressing) neurons within the BLA. (C,D) As in (A,B), except for pairs of enriched genes for BA subpopulations.
Figure 6.
Figure 6.. Multiplexed FISH simultaneously maps discrete and continuous heterogeneity.
(A) Overview of mFISH in the anterior amygdala. Scale bar: 400 µm. (B) As in (A), but for intermediate amygdala. Inset provides representative expansion, scale bar: 20 µm. (C) As in (B), but for posterior amygdala. (D) Overview of discrete heterogeneity in the BLA, obtained by assessing relative expression of Negr1 and Cplx1 across cells. (E) Histogram of phenotype identities for (D). (F) Illustration of gene-expression correlations for all cells, relative to the Negr1 phenotype seed cell highlighted in magenta. (G) Correlations computed and averaged across space, relative to the magenta seed cell shown in (F). Magenta and green points represent other cells within the posterior BLA with a binarized discrete cell-type identity. Blue and orange lines indicate binned average correlation across all cells at 100 µm spacing for the same and opposite phenotypes. (H,I) As in (F,G), but for a Cplx1 phenotype seed cell. (J) As in (G,I), but pooling and analyzing averages across all cells in the BLA. Blue and orange lines illustrate mean correlations to other cells of the same and opposite phenotypes, respectively, with spread about mean indicating one standard deviation.
Figure 6—figure supplement 1.
Figure 6—figure supplement 1.. Individual mFISH marker-gene expression in the BLA.
(A) Overview of smFISH signals for the 12 BLA marker genes used in this study. Scale bar: 300 μm. (B) Expanded views of marker gene expression, for the respective boxed areas shown in (A). Scale bar: 40 μm.
Figure 6—figure supplement 2.
Figure 6—figure supplement 2.. Clustering of mFISH excitatory neurons.
(A) Points denoting individual excitatory neurons in mFISH data, colored according to respective coronal section. (B) t-SNE visualization of mFISH data for the cells shown in (A). (C) Spatial location of cells comprising two clusters. (D) t-SNE visualization for two excitatory neuron clusters, colored according to cluster identity from (C). (E,F) As in (C,D), but for six clusters.
Figure 6—figure supplement 3.
Figure 6—figure supplement 3.. Interneuron subtypes resolved by scRNA-seq and chromogenic ISH.
(A) t-SNE visualization of 51 interneurons, colored according to cluster identity (Int1 and Int2). Inset numeric values denote number of enriched genes in each cluster, relative to the other interneuron cluster. Inset t-SNE visualization shows expression of interneuron marker Gad1. (B) Examples of novel interneuron cluster-enriched genes obtained from scRNA-seq. (C) Summary of all genes differentially expressed between the two interneuron clusters. Functional categories include calcium handling (Hpca, Wfs1), synapses (Gabra1, Cplx1, Syt5), and regulation of transcription (Tshz1). (D) Chromogenic ISH images for differentially expressed genes. Genes enriched in Int1 show diffuse spatial patterning across the BLA and minimal labeling in the intercalated region. Genes enriched in Int2, conversely, show dense expression in the capsular region. Scale bar: 300 μm.
Figure 7.
Figure 7.. BLA projection neurons show spatially discrete and continuous cellular variation.
(A) Atlas schematic showing retrograde viral injection site for the ACX (modified from Paxinos and Franklin, 2004). (B) Representative maximum intensity projections of labeled cells within the BLA. Scale bar: 500 μm. The boundary of the BLA is shown (solid line) along with the division between the lateral and basal sub-regions (dashed line) (C). Locations of all virally labeled cells along the A/P axis of the BLA (left to right). For reference, virally labeled cells (black) are superimposed over the position of excitatory neurons (Slc17a7-expressing cells), with cells colored to illustrate LA (magenta) and BA (green) per atlas definitions. (D) Percentage of total labeled cells located within the LA and BA, depicted as mean ± SEM. Grey lines indicate range of values within 95% confidence intervals for the expected number of cells in the LA and BA, via Monte Carlo simulations of random selection of excitatory neurons. E-X. As in (A–D), except for the NAC (E–H), PFC (I–L), VHC (M–P), MEC (Q–T) and RSC (U–X) injection sites.
Figure 7—figure supplement 1.
Figure 7—figure supplement 1.. Spatial cellular gradients of projection neurons are present in the BLA and differ based on projection site.
(A) Illustration of the BLA showing the LA (magenta) and sub-regional parcellation of the BA (green; B-M: basal medial; B-L: basal lateral). (B) Percentage of virally labeled NAC projection neurons located within the lateral BLA, and sub-regions of the BA. Individual points and connecting lines represent values from single animals. Bars depict means ± SEM. Solid black line indicates percentage of excitatory cells (Slc17a7 positive) expected in each region. (C-F) As in (B), except for PFC, VHC, MEC and RSC projection neurons. (G) As in (A), except showing parcellation of the LA (L-M: lateral medial; L-L: lateral lateral). (H) Percentage of ACX projection cells located within the BA and sub-regions of the LA.
Figure 8.
Figure 8.. LA and BA neurons vary by morphology.
(A) Representative images of labeled cells projecting to the ACX, NAC, PFC, VHC, MEC, and RSC. Scale bars: 25 μm. (B) The cell-body area of virally labeled cells for each projection site, depicted as mean ± SEM. (C) Top row: overview of mFISH signals for Slc17a7, Negr1, and Cplx1 in the intermediate BLA. Scale bars: 300 μm. Middle, bottom rows: expansions for the LA and BA, respectively. Scale bars: 40 μm. (D) Left: Cell-body area of Slc17a7-expressing cells segmented from (C). Middle, right: Cell-body area of Slc17a7-expressing cells that also express Negr1 or Cplx1, respectively. (E) Cell-body area for Slc17a7-expressing cells that also express Negr1 (magenta) or Cplx1 (green), depicted as mean ± SEM.
Figure 9.
Figure 9.. Summary of heterogeneity within the basolateral amygdala.
Examples of spatially variable gene-expression, circuit, and cellular properties of excitatory neurons in the basolateral amygdala, as resolved in this study.

References

    1. Alheid GF. Extended amygdala and basal forebrain. Annals of the New York Academy of Sciences. 2003;985:185–205. doi: 10.1111/j.1749-6632.2003.tb07082.x. - DOI - PubMed
    1. Amir A, Headley DB, Lee S-C, Haufler D, Paré D. Vigilance-Associated gamma oscillations coordinate the ensemble activity of basolateral amygdala neurons. Neuron. 2018;97:656–669. doi: 10.1016/j.neuron.2017.12.035. - DOI - PMC - PubMed
    1. Baxter MG, Murray EA. The amygdala and reward. Nature Reviews Neuroscience. 2002;3:563–573. doi: 10.1038/nrn875. - DOI - PubMed
    1. Becht E, McInnes L, Healy J, Dutertre C-A, Kwok IWH, Ng LG, Ginhoux F, Newell EW. Dimensionality reduction for visualizing single-cell data using UMAP. Nature Biotechnology. 2019;37:38–44. doi: 10.1038/nbt.4314. - DOI - PubMed
    1. Bergstrom HC, McDonald CG, Dey S, Tang H, Selwyn RG, Johnson LR. The structure of pavlovian fear conditioning in the amygdala. Brain Structure and Function. 2013;218:1569–1589. doi: 10.1007/s00429-012-0478-2. - DOI - PubMed

Publication types

Associated data