

In Situ Detection of Neurotransmitters from Stem Cell-Derived Neural Interface at the Single-Cell Level via Graphene-Hybrid SERS Nanobiosensing
- PMID: 32870013
- PMCID: PMC8849936
- DOI: 10.1021/acs.nanolett.0c03205
In Situ Detection of Neurotransmitters from Stem Cell-Derived Neural Interface at the Single-Cell Level via Graphene-Hybrid SERS Nanobiosensing
Abstract
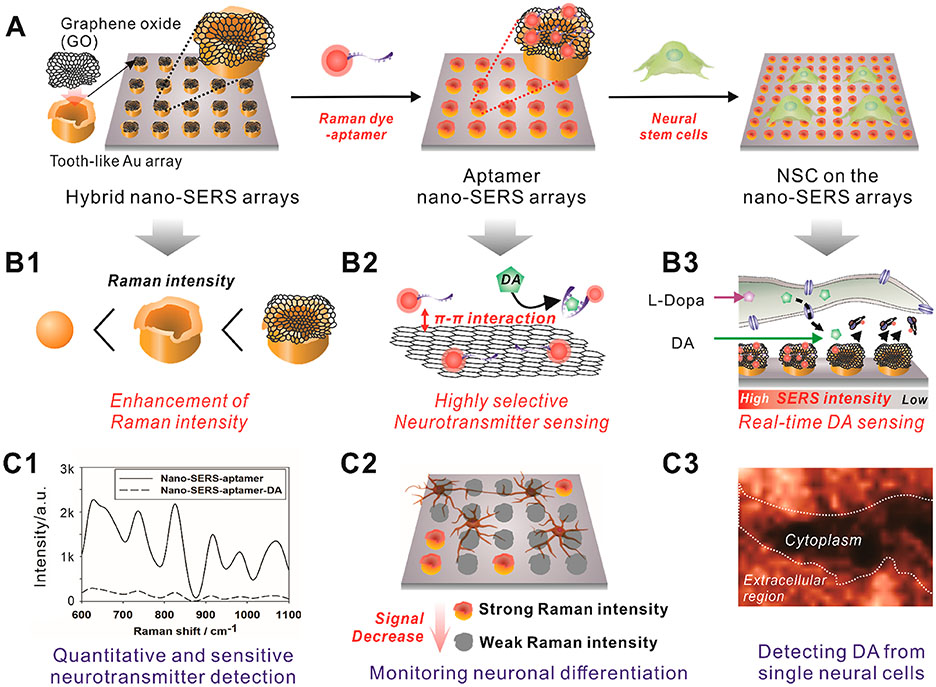
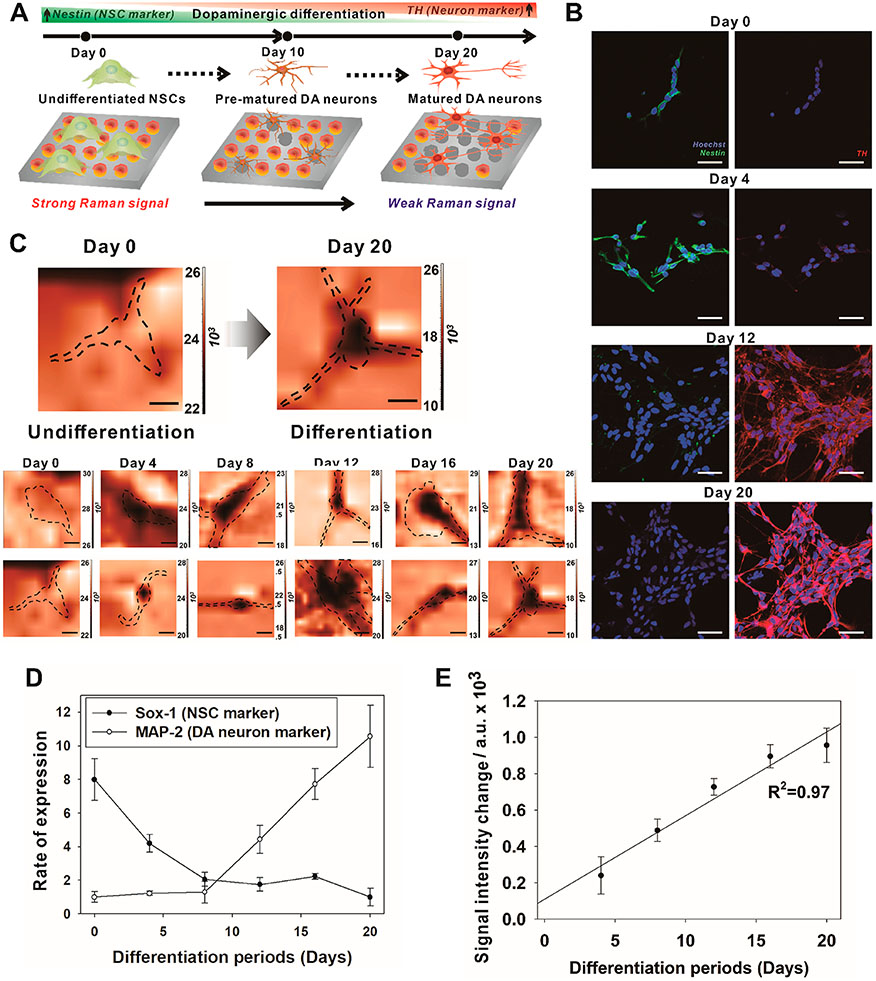
In situ quantitative measurements of neurotransmitter activities can provide useful insights into the underlying mechanisms of stem cell differentiation, the formation of neuronal networks, and neurodegenerative diseases. Currently, neurotransmitter detection methods suffer from poor spatial resolution, nonspecific detection, and a lack of in situ analysis. To address this challenge, herein, we first developed a graphene oxide (GO)-hybrid nanosurface-enhanced Raman scattering (SERS) array to detect dopamine (DA) in a selective and sensitive manner. Using the GO-hybrid nano-SERS array, we successfully measured a wide range of DA concentrations (10-4 to 10-9 M) rapidly and reliably. Moreover, the measurement of DA from differentiating neural stem cells applies to the characterization of neuronal differentiation. Given the challenges of in situ detection of neurotransmitters at the single-cell level, our developed SERS-based detection method can represent a unique tool for investigating single-cell signaling pathways associated with DA, or other neurotransmitters, and their roles in neurological processes.
Keywords: Detections of Neurotransmitters; Graphene-hybrid SERS nanobiosensing; Single-cell analysis; Surface-enhanced Raman scattering.
Figures
Similar articles
-
Dual-Enhanced Raman Scattering-Based Characterization of Stem Cell Differentiation Using Graphene-Plasmonic Hybrid Nanoarray.Nano Lett. 2019 Nov 13;19(11):8138-8148. doi: 10.1021/acs.nanolett.9b03402. Epub 2019 Nov 1. Nano Lett. 2019. PMID: 31663759
-
Surface-enhanced Raman scattering probes based on sea urchin-like Bi2S3@Co3O4 composite for the detection of dopamine during neural stem cell differentiation.Spectrochim Acta A Mol Biomol Spectrosc. 2025 May 5;332:125845. doi: 10.1016/j.saa.2025.125845. Epub 2025 Feb 2. Spectrochim Acta A Mol Biomol Spectrosc. 2025. PMID: 39923712
-
Dynamic SERS nanosensor for neurotransmitter sensing near neurons.Faraday Discuss. 2017 Dec 4;205:387-407. doi: 10.1039/c7fd00131b. Faraday Discuss. 2017. PMID: 28895964
-
Lighting up the Raman signal of molecules in the vicinity of graphene related materials.Acc Chem Res. 2015 Jul 21;48(7):1862-70. doi: 10.1021/ar500466u. Epub 2015 Jun 9. Acc Chem Res. 2015. PMID: 26056861 Review.
-
Graphene and Graphene Oxide Applications for SERS Sensing and Imaging.Curr Med Chem. 2019;26(38):6878-6895. doi: 10.2174/0929867325666181004152247. Curr Med Chem. 2019. PMID: 30289065 Review.
Cited by
-
Raman Spectroscopy on Brain Disorders: Transition from Fundamental Research to Clinical Applications.Biosensors (Basel). 2022 Dec 26;13(1):27. doi: 10.3390/bios13010027. Biosensors (Basel). 2022. PMID: 36671862 Free PMC article. Review.
-
Recent Advances in Aptamer-Based Sensors for Sensitive Detection of Neurotransmitters.Biosensors (Basel). 2023 Mar 23;13(4):413. doi: 10.3390/bios13040413. Biosensors (Basel). 2023. PMID: 37185488 Free PMC article. Review.
-
Graphene and its Derivatives-Based Optical Sensors.Front Chem. 2021 Feb 5;9:615164. doi: 10.3389/fchem.2021.615164. eCollection 2021. Front Chem. 2021. PMID: 33614600 Free PMC article. Review.
-
Recent advances in two-dimensional materials for the diagnosis and treatment of neurodegenerative diseases.Discov Nano. 2024 Sep 17;19(1):151. doi: 10.1186/s11671-024-04099-1. Discov Nano. 2024. PMID: 39289310 Free PMC article. Review.
-
Graphene-Based Materials for Efficient Neurogenesis.Adv Exp Med Biol. 2022;1351:43-64. doi: 10.1007/978-981-16-4923-3_3. Adv Exp Med Biol. 2022. PMID: 35175611
References
-
- Sarter M; Parikh V Choline transporters, cholinergic transmission and cognition. Nat. Rev. Neurosci 2005, 6, 48–56. - PubMed
-
- Snyder SH; Taylor KM; Coyle JT; Meyerhoff JL The role of brain dopamine in behavioral regulation and the actions of psychotropic drugs. Am. J. Psychiatry 1970, 127, 199–207. - PubMed
-
- Zeng X; Cai J; Chen J; Luo Y; You ZB; Fotter E; Wang Y; Harvey B; Miura T; Backman C; Chen GJ; Rao MS; Freed WJ Dopaminergic differentiation of human embryonic stem cells. Stem Cells 2004, 22, 925–940. - PubMed
Publication types
MeSH terms
Substances
Grants and funding
LinkOut - more resources
Full Text Sources
Miscellaneous
