. 2020 Sep 25;48(17):9505-9520.
doi: 10.1093/nar/gkaa725.

Inference and multiscale model of epithelial-to-mesenchymal transition via single-cell transcriptomic data

Affiliations

Inference and multiscale model of epithelial-to-mesenchymal transition via single-cell transcriptomic data

Yutong Sha et al. Nucleic Acids Res. .

Abstract

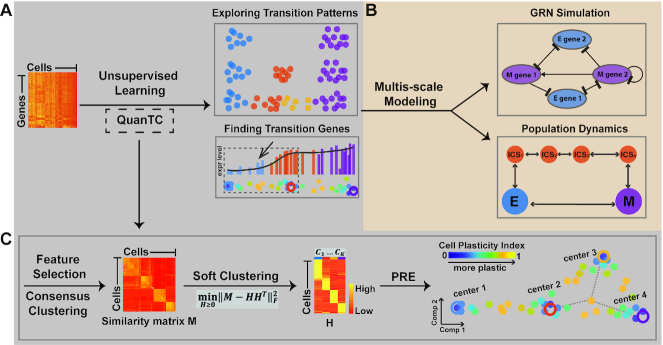
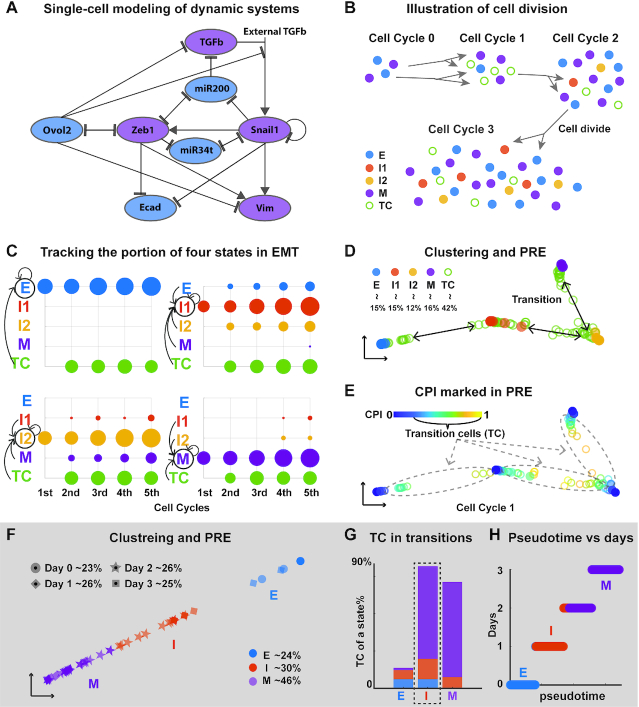
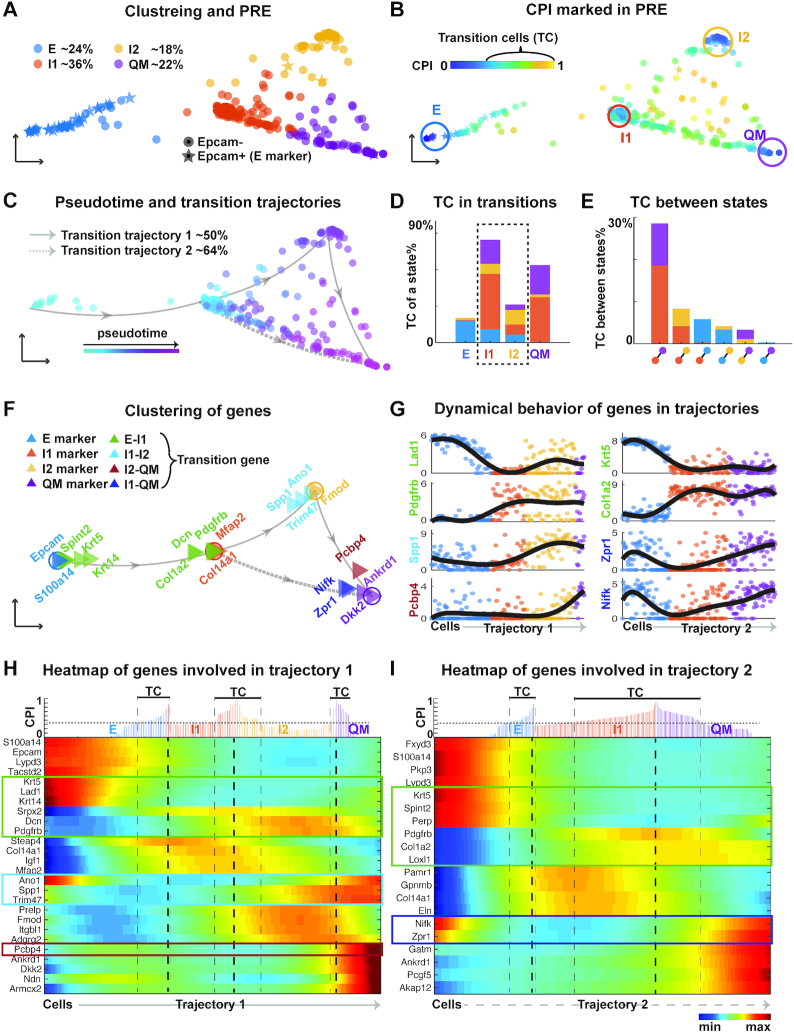
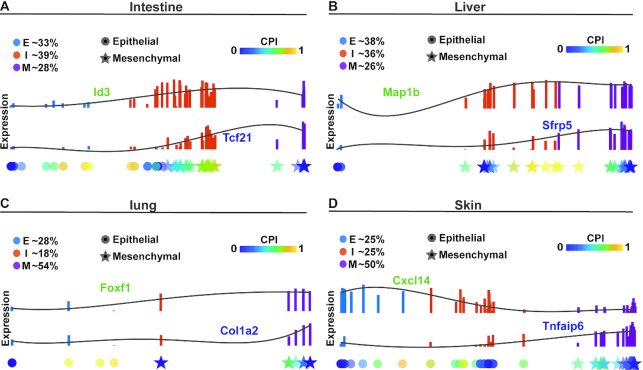
Rapid growth of single-cell transcriptomic data provides unprecedented opportunities for close scrutinizing of dynamical cellular processes. Through investigating epithelial-to-mesenchymal transition (EMT), we develop an integrative tool that combines unsupervised learning of single-cell transcriptomic data and multiscale mathematical modeling to analyze transitions during cell fate decision. Our approach allows identification of individual cells making transition between all cell states, and inference of genes that drive transitions. Multiscale extractions of single-cell scale outputs naturally reveal intermediate cell states (ICS) and ICS-regulated transition trajectories, producing emergent population-scale models to be explored for design principles. Testing on the newly designed single-cell gene regulatory network model and applying to twelve published single-cell EMT datasets in cancer and embryogenesis, we uncover the roles of ICS on adaptation, noise attenuation, and transition efficiency in EMT, and reveal their trade-off relations. Overall, our unsupervised learning method is applicable to general single-cell transcriptomic datasets, and our integrative approach at single-cell resolution may be adopted for other cell fate transition systems beyond EMT.


Figures

Figure 1.
Figure 1.
Outline of key components of the approach in analyzing transition cells and ICS. (A) Input single-cell transcriptomic datasets to an unsupervised learning method (QuanTC) to explore the transition cells, transition genes and other transition properties. (B) Develop multi-scale agent-based of gene regulatory network and cell-population dynamics models to validate and test outputs from QuanTC. (C) Overview of QuanTC: 1) feature selection and consensus clustering, 2) calculation of cell-to-cell similarity matrix, 3) computing cell-to-cluster matrix via NMF, and 4) using probabilistic regularized embedding (PRE) for two-dimensional visualization: Each solid circle represents one cell, colored by the value of Cell Plasticity Index (CPI) that quantifies the transition capability of each cell, and each larger circle represents the center of a stable cell subpopulation.
Figure 2.
Figure 2.
Testing QuanTC on simulated EMT datasets and a qPCR dataset for hepatic differentiation of hESCs. (A) The EMT gene regulatory network used in the multi-scale agent-based model; blue: epithelial promoting factor; purple: mesenchymal promoting factor. (B) Illustration of the modeling output: each cell colored by its true state labels. (C) A simulation dataset: the proportion of each state induced by the previous cell states at the end of each cell cycle. The size of the dot is proportional to the number of cells, and the color denotes the cell states of the mother cell. The arrows represent the occurred state transitions and the circle represents the state of the daughter cell. It shows the transition dynamics of each state. (D, E) PRE visualization of each cell at the end of first cell cycle (a circle) colored by its true state from the model (D) and the calculated CPI value (E). The percentage for each cell type is the percentage of a given cell type over the entire cell population size. (F) Clustering and PRE visualization of the qPCR dataset. Each dot represents one cell colored by the identified state, and its shape represents its real time. (G) Percentage of TC in each state relative to the total number of TC with colors consistent with (F). Dashed box: the intermediate cell state. (H) Comparison of the inferred pseudotime and the day collected in the experiment of each cell. The parameters are provided in Supplementary Table S1.
Figure 3.
Figure 3.
Analyzing EMT in mouse skin squamous cell carcinoma (SCC) dataset using QuanTC. (A–C) Visualization of cells via PRE. (A) Each star or solid circle colored by the corresponding cell state represents one of the 67 epithelial YFP+Epcam+ and 292 mesenchymal-like YFP+Epcam- tumor cells. (B) Identification of TC. Each dot is colored by its CPI value. The cells outside circles with relatively high CPI values are considered as TC. The parameters are given in Supplementary Table S1. (C) Transition trajectory inference. Arrowed solid and dashed lines show two main transition trajectories, with cells colored based on their pseudotime. (D) Percentage of TC associated with each state relative to the total number of TC. (E) Percentage of TC between two states relative to the total number of cells. (F) Visualization of marker genes and transition genes between states. Each triangle represents a gene colored by its type and arrowed lines indicate the transition direction of EMT. (G) Expression levels of top transition genes with cells ordered along the two most probable transition trajectories. Solid lines, smoothed expression curves for each gene in the transition trajectory. (H, I) Heat map of normalized expression of marker genes and transition genes. Columns represent cells ordered along the transition trajectory and rows represent genes. Coloring represents the normalized expression value of each gene. Transition genes are marked in the box. Top: CPI values of each cell along the transition trajectory.
Figure 4.
Figure 4.
Comparison analysis of EMT during organogenesis in intestine, liver, lung and skin. (A–D) Top: the expression levels of E-I transition genes (green) and I-M transition genes (blue) along the E–I–M transition colored by inferred state of cells. Solid lines are smoothed expression curves for each gene in the transition trajectory. Bottom: Cells are ordered along a line according to their pseudotime values. Each dot represents a single cell shaped by the cell states previously identified in the original study on the corresponding dataset and colored by the CPI value. The parameters are given in Supplementary Table S1.
Figure 5.
Figure 5.
State transition index and gene regulatory networks for five EMT datasets and their comparisons with QuanTC outputs. (A) State transition index of relatively stable cells in each state and the TC between states. Dashed box: TC with high value of state transition index. (B) Gene regulatory networks of top marker genes and transition genes using the PIDC algorithm from the SCC and mouse embryonic development datasets (the top ∼80% of edges are shown). The parameters are given in Supplementary Table S1. Each dot represents a gene colored by its type. Each large dashed circle labels marker genes of a particular cell state. Graph edges indicate the top interactions and the length of the edge is inversely proportional to the interaction strength between genes.
Figure 6.
Figure 6.
Dynamical properties of inferred ICS-regulated EMT trajectories. (A) The definitions and measurements of three quantities – adaptation, noise attenuation and population transition properties of cell population dynamics. (B) The key parameters of model including ICS number N and ITR gamma (see also Materials and Methods, Supplementary Figure S3). Increase of ICS number N can result in the multiple peaks in M population trajectory, forming the oscillatory adaptation. (C) Effect of tuning N and gamma on the three quantities (see also Supplementary Figure S3). (top row) Changes in three quantities by fixing N = 2 and tuning gamma from 5 to 80. The increase in ITR gamma lowers the noise coefficient of variance (CV) of output M population, and increases the transition efficiency from E to M. The signal adaptation sensitivity is not a monotonic function of gamma, which reaches the peak before a certain threshold and declines afterwards with further increase in gamma. (bottom row) Change of three quantities by fixing gamma and tuning N from 1 to 18. The increase in N improves adaptation sensitivity and noise attenuation, however reducing the value of transition efficiency. (D) Tuning parameter gamma and N separately cannot achieve all the desired properties (i.e. simultaneous increase of adaptation sensitivity, noise attenuation and EMT efficiency, indicated by brown dashed line). The desired properties can be achieved by increasing ITR gamma (blue line, increase gamma from 5 to 80 and fix N as 1) first and increasing N subsequently (red line, increase N from 1 to 8 and fix gamma as 80). (E) EMT trajectories inferred from SCC dataset, with node colors consistent with Figure 3. Other inferred trajectories are shown in Supplementary Figures S12–S13. The arrow represents potential transition between states, and number represents the percentage of TC. The red arrows indicate the major transition trajectory mediated by ICS, and the dashed arrow refers to the direct transition route from E to QM state.

References

    1. Nieto M.A., Huang R.Y., Jackson R.A., Thiery J.P.. Emt: 2016. Cell. 2016; 166:21–45. - PubMed
    1. Sha Y., Haensel D., Gutierrez G., Du H., Dai X., Nie Q.. Intermediate cell states in epithelial-to-mesenchymal transition. Phys. Biol. 2018; 16:021001. - PMC - PubMed
    1. Zhang J., Tian X.-J., Zhang H., Teng Y., Li R., Bai F., Elankumaran S., Xing J.. TGF-β–induced epithelial-to-mesenchymal transition proceeds through stepwise activation of multiple feedback loops. Sci. Signaling. 2014; 7:ra91–ra91. - PubMed
    1. Huang R.Y., Wong M.K., Tan T.Z., Kuay K.T., Ng A.H., Chung V.Y., Chu Y.S., Matsumura N., Lai H.C., Lee Y.F. et al. .. An EMT spectrum defines an anoikis-resistant and spheroidogenic intermediate mesenchymal state that is sensitive to e-cadherin restoration by a src-kinase inhibitor, saracatinib (AZD0530). Cell Death. Dis. 2013; 4:e915. - PMC - PubMed
    1. Lu M., Jolly M.K., Levine H., Onuchic J.N., Ben-Jacob E.. MicroRNA-based regulation of epithelial-hybrid-mesenchymal fate determination. Proc. Natl. Acad. Sci. U.S.A. 2013; 110:18144–18149. - PMC - PubMed

Publication types

MeSH terms