. 2022 Mar;28(3):1457-1468.
doi: 10.1109/TVCG.2020.3020958. Epub 2022 Jan 28.

3D Virtual Pancreatography

3D Virtual Pancreatography

Shreeraj Jadhav et al. IEEE Trans Vis Comput Graph. 2022 Mar.

Abstract

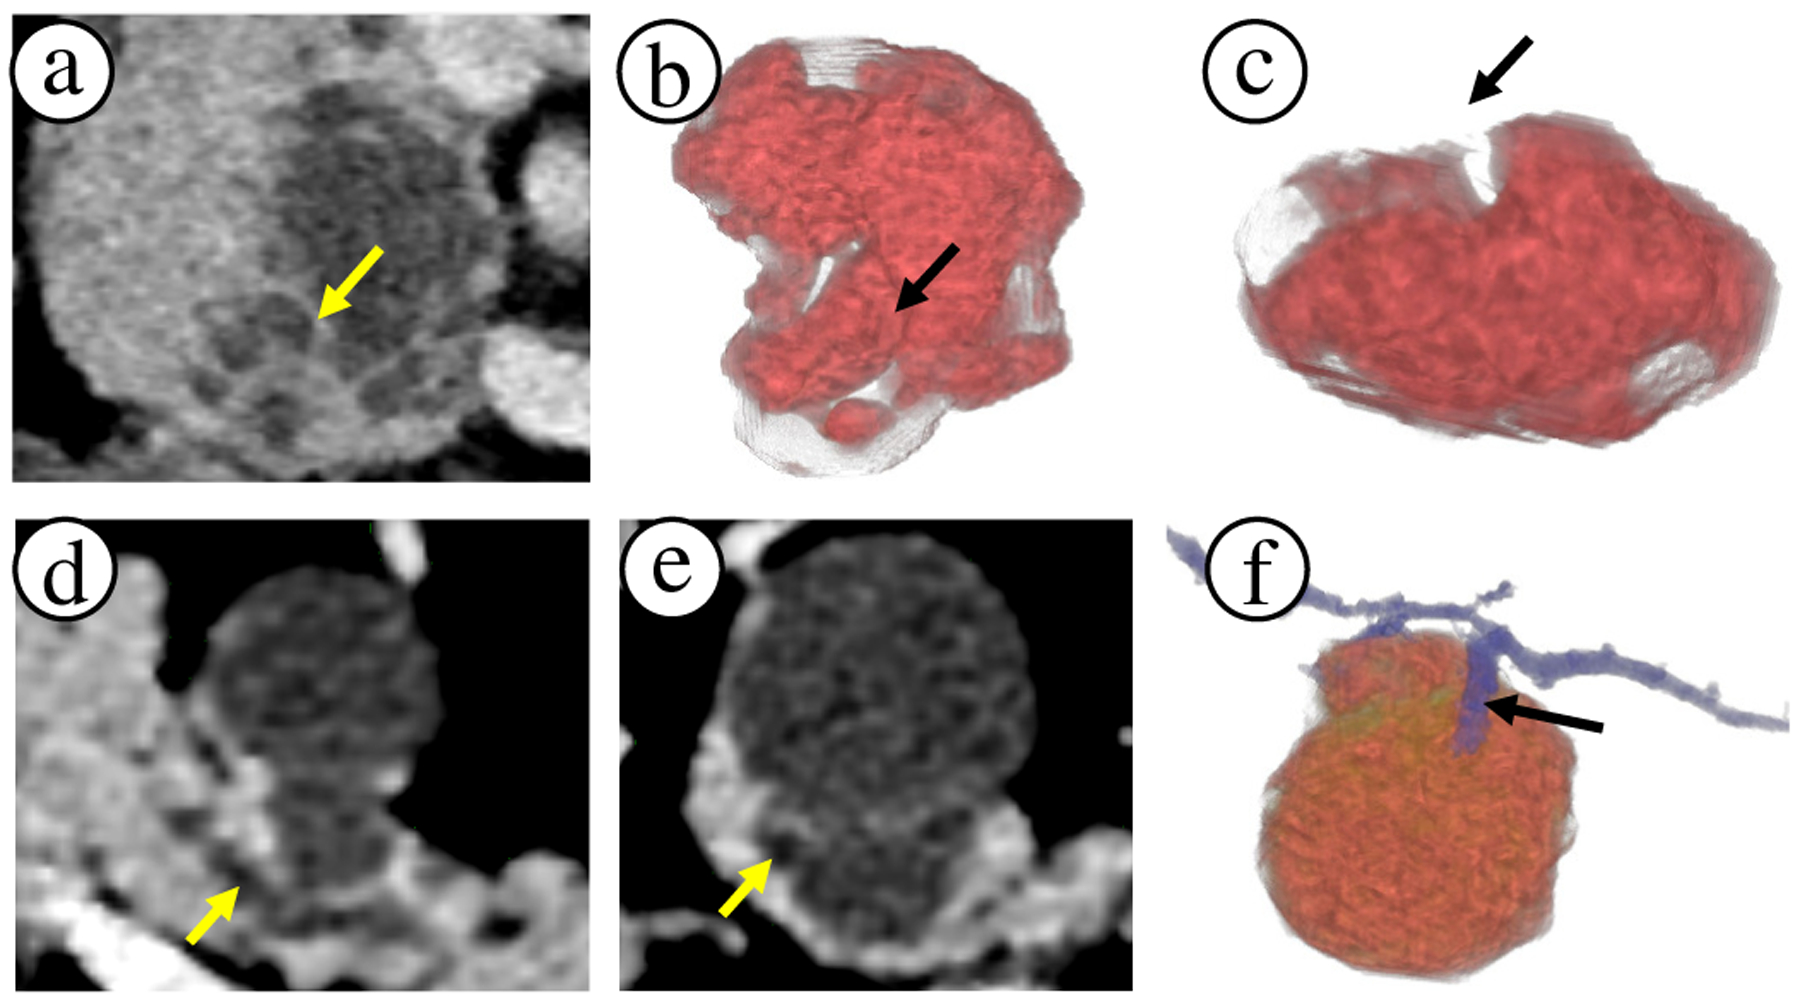
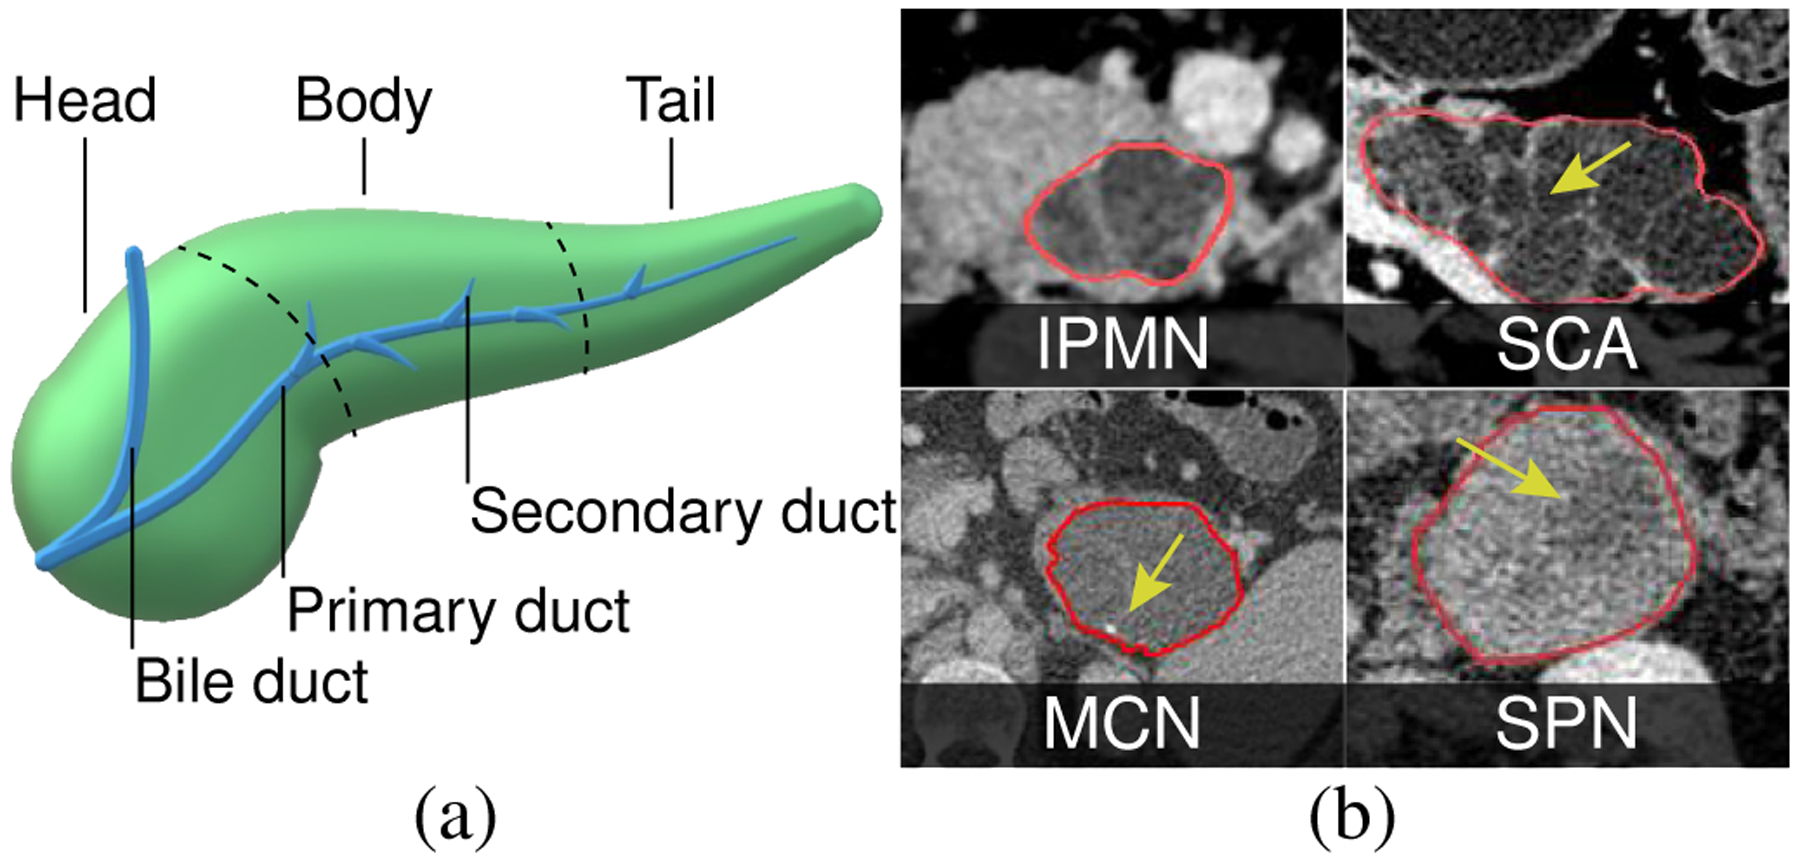
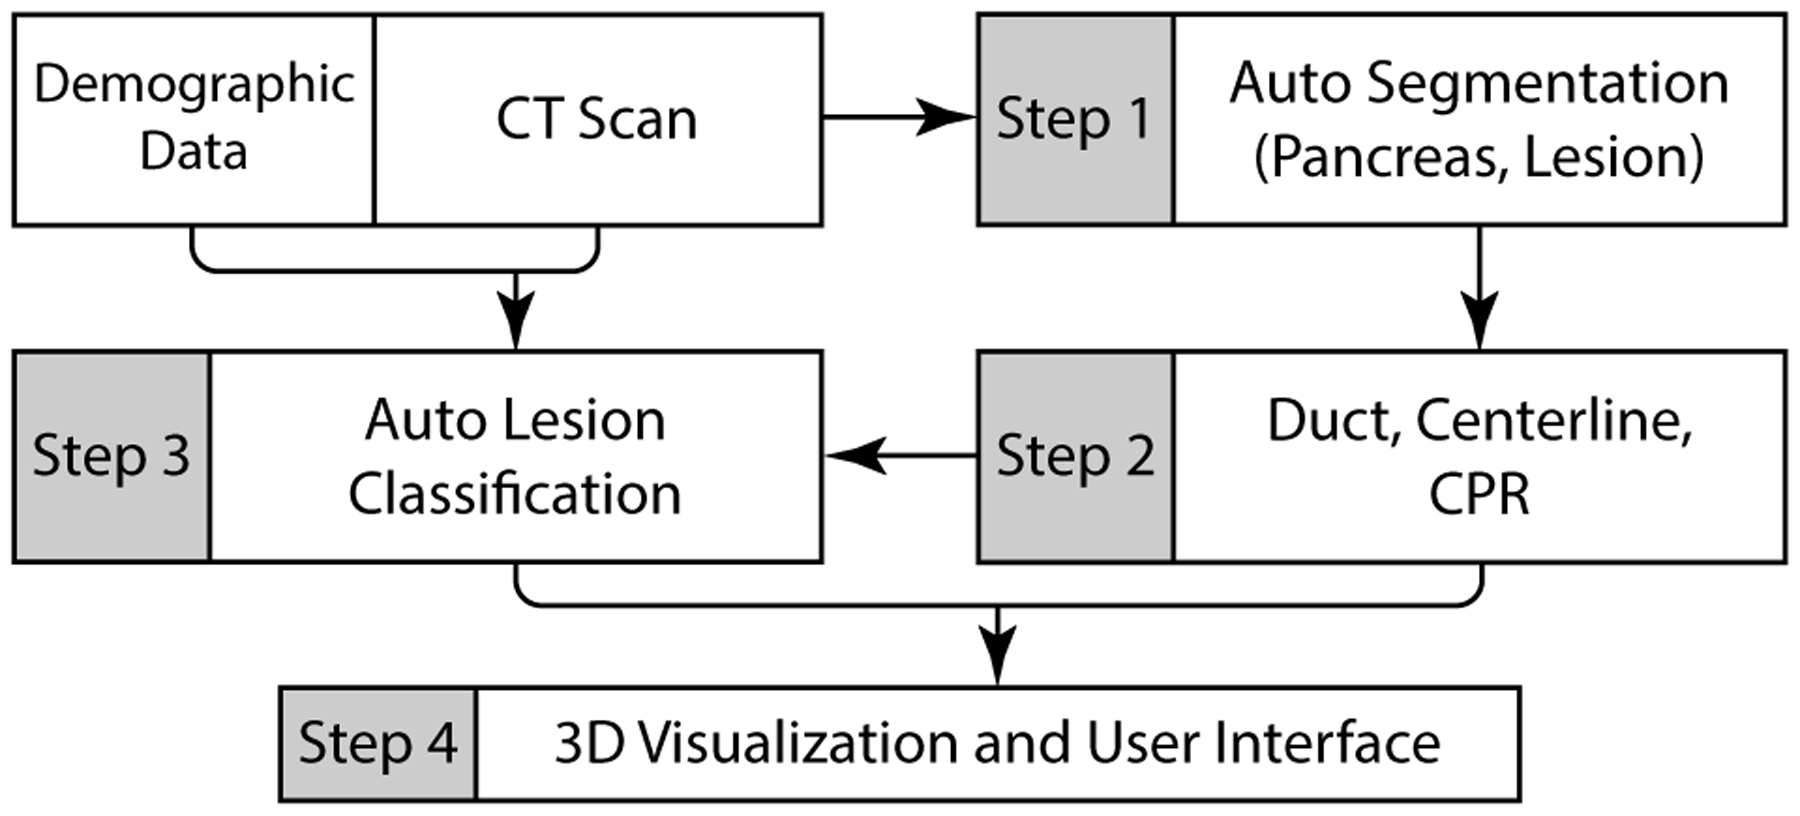
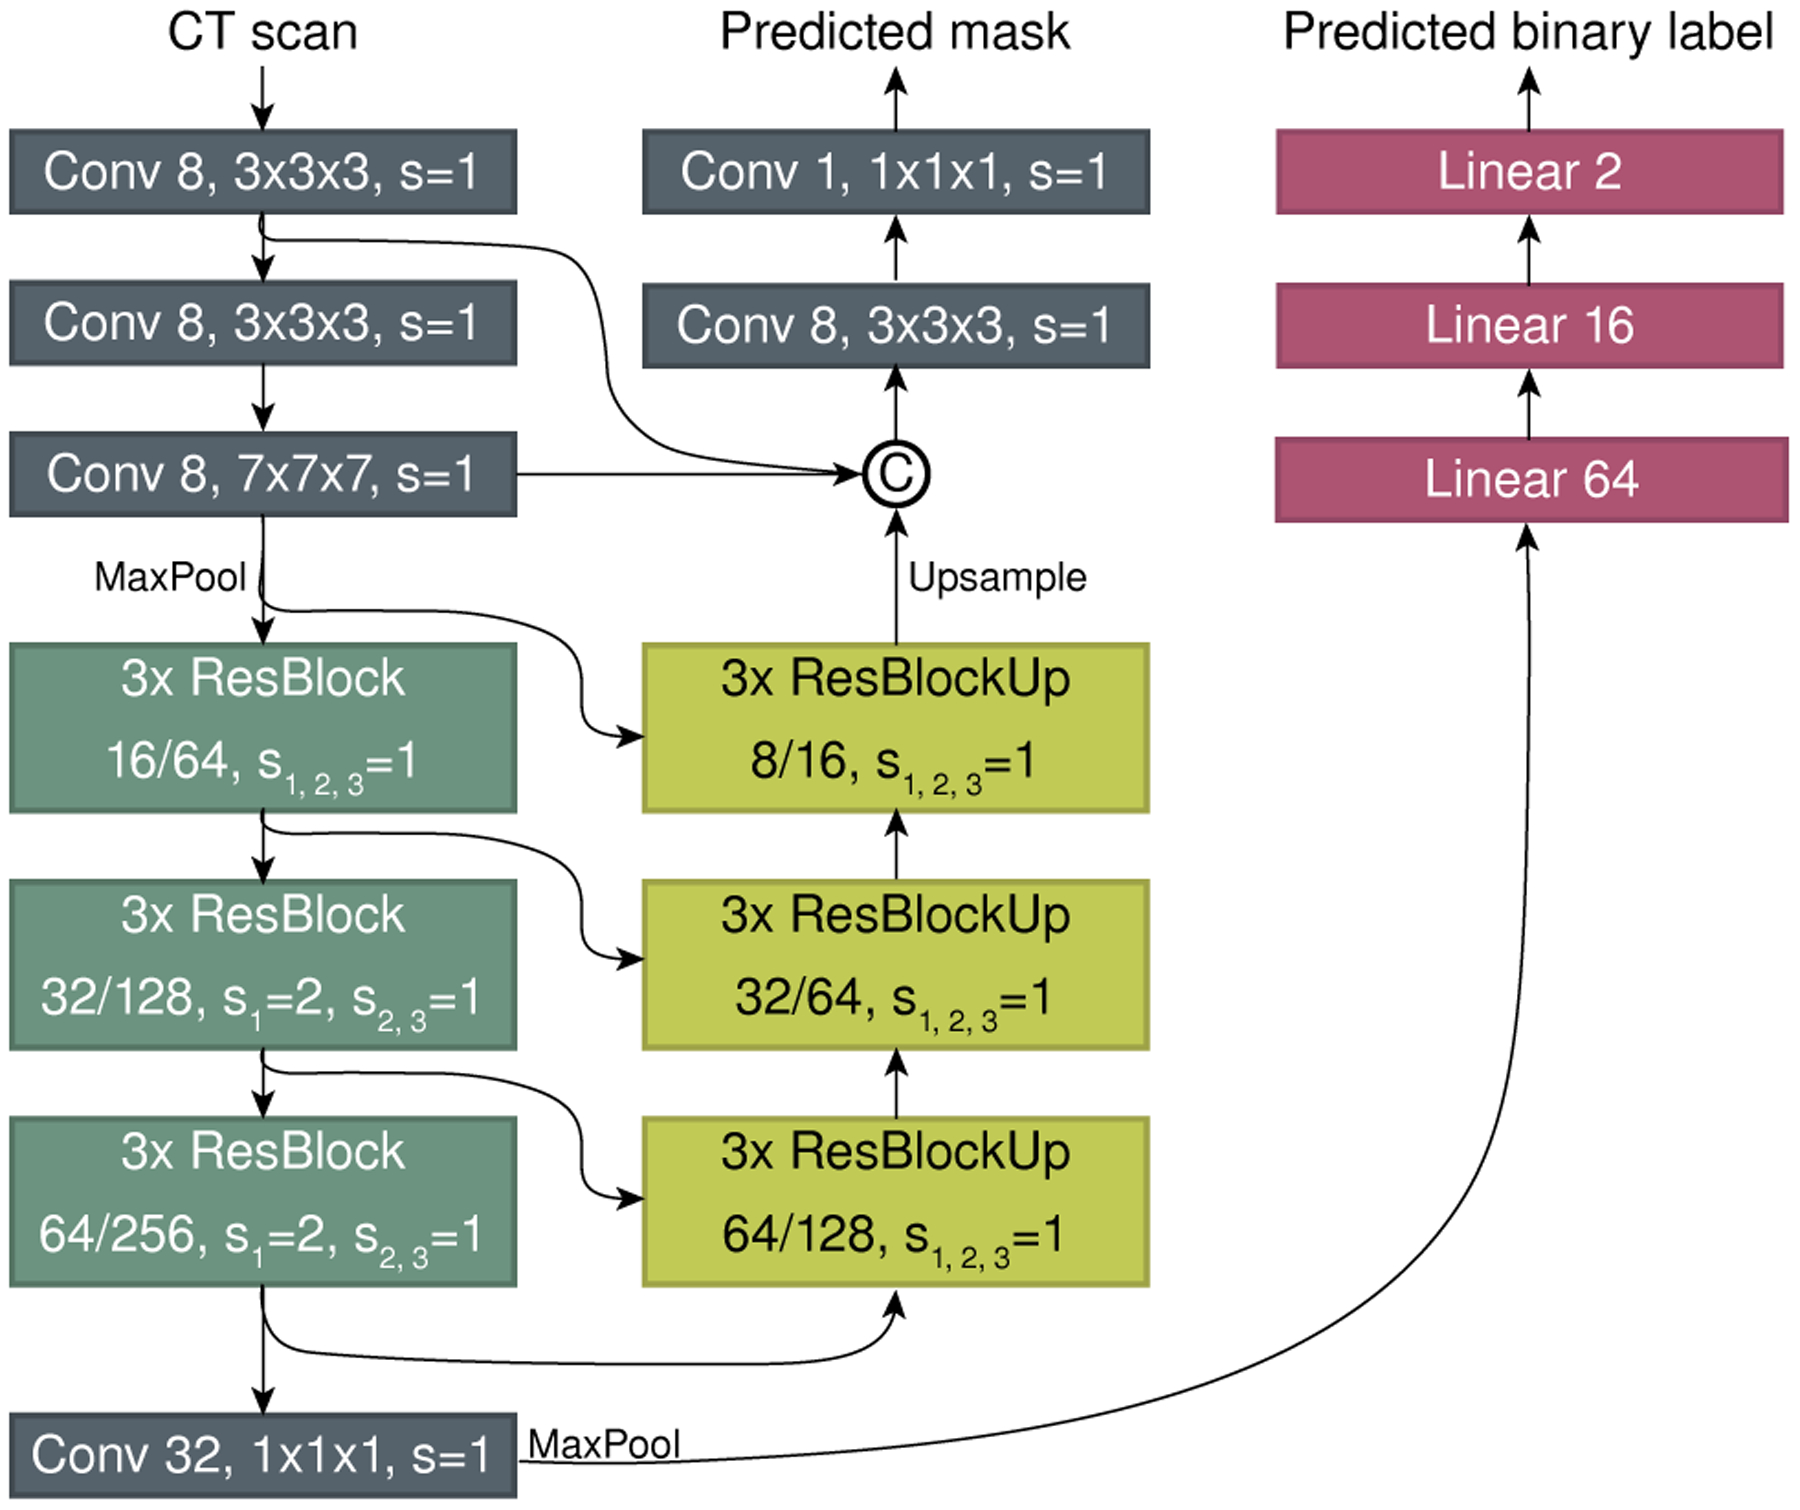
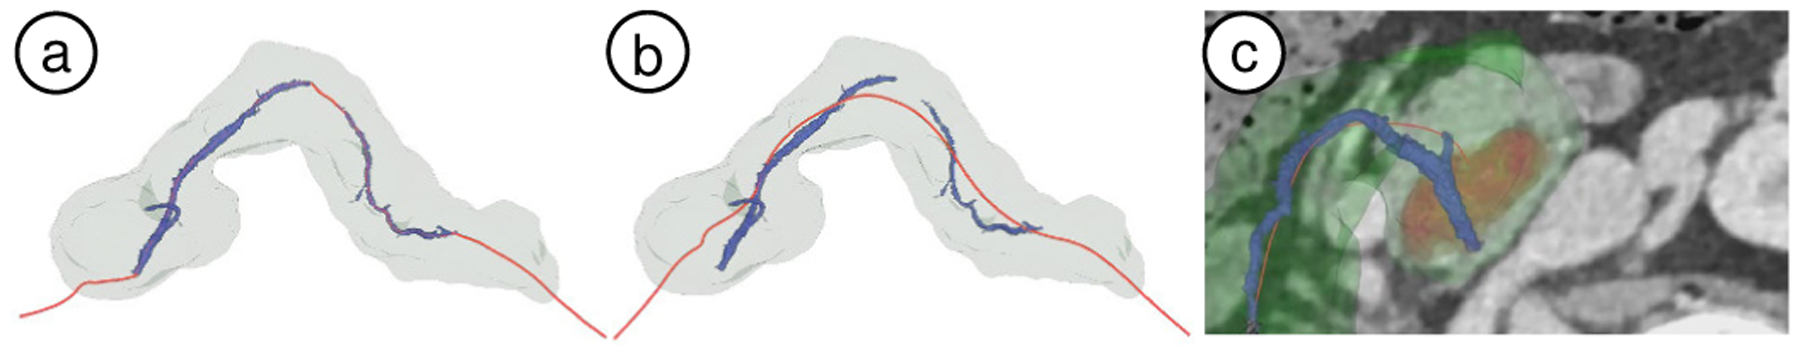
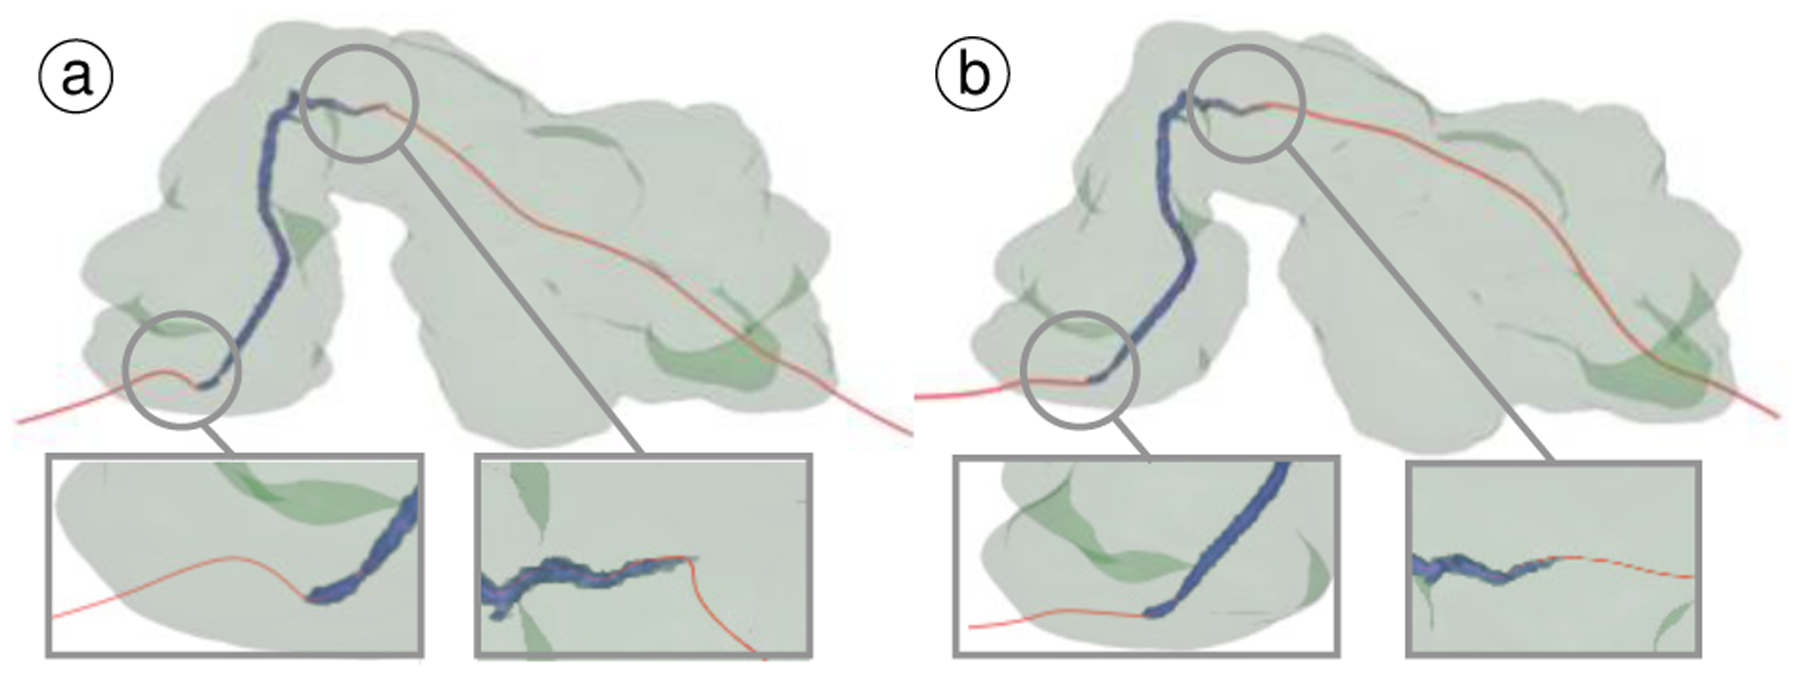
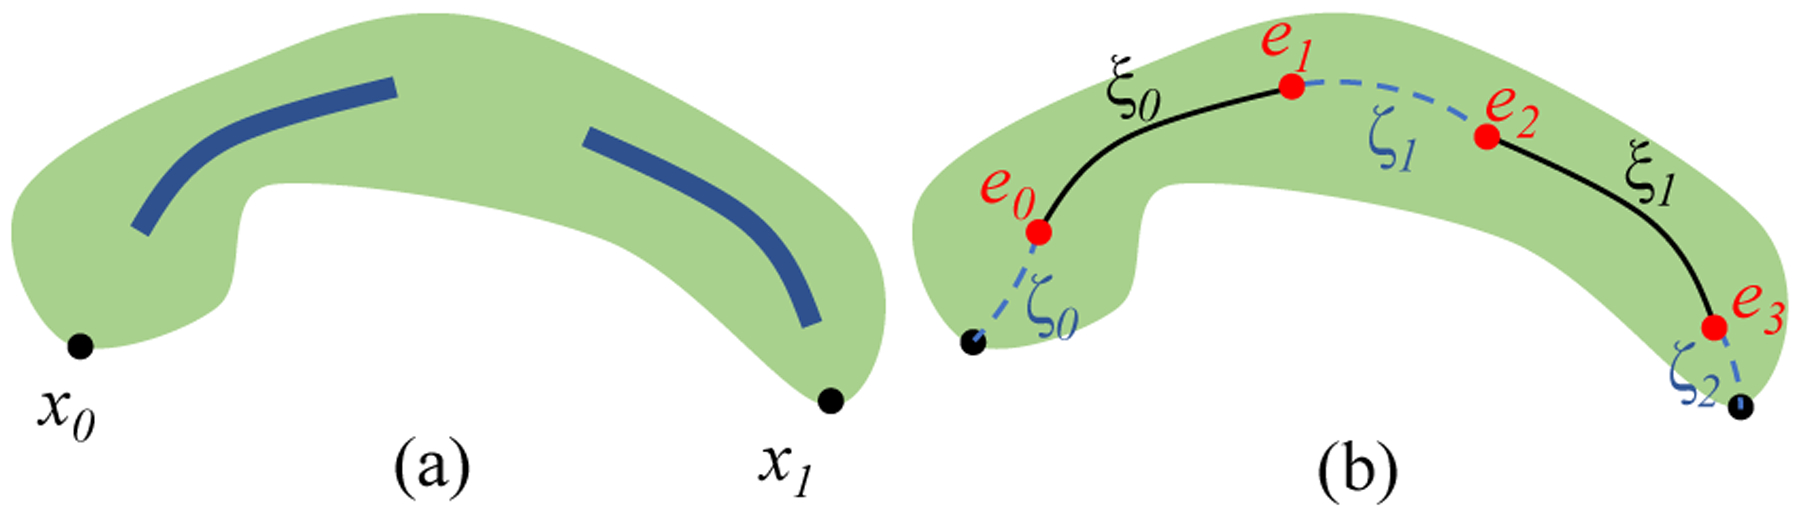
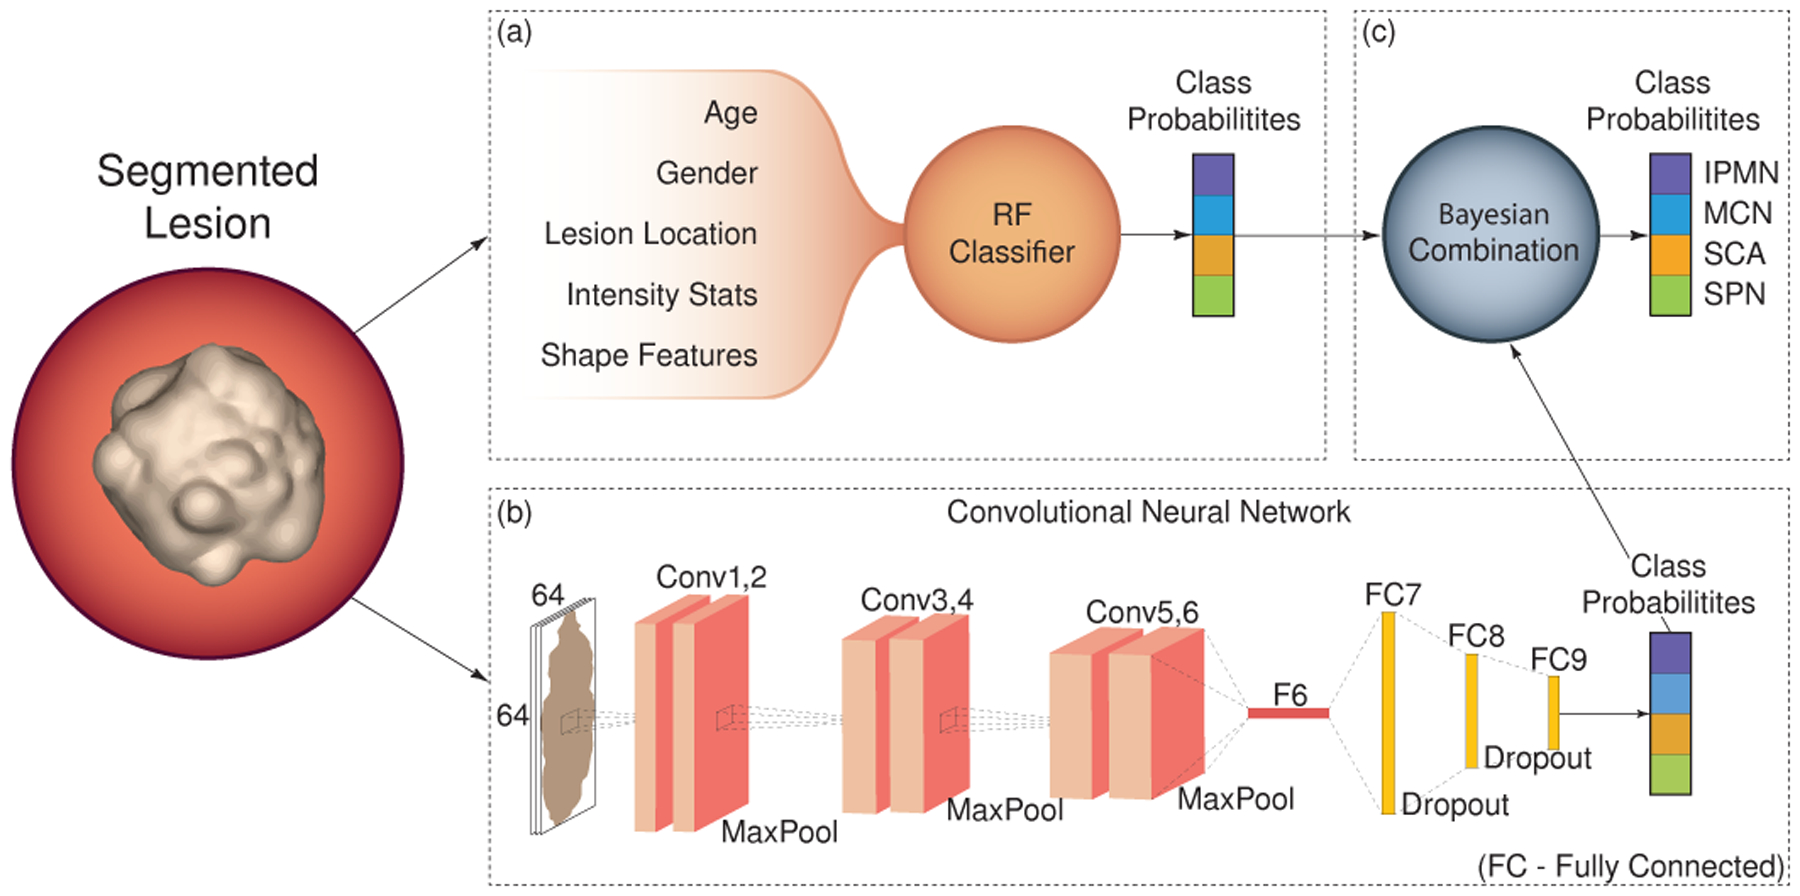
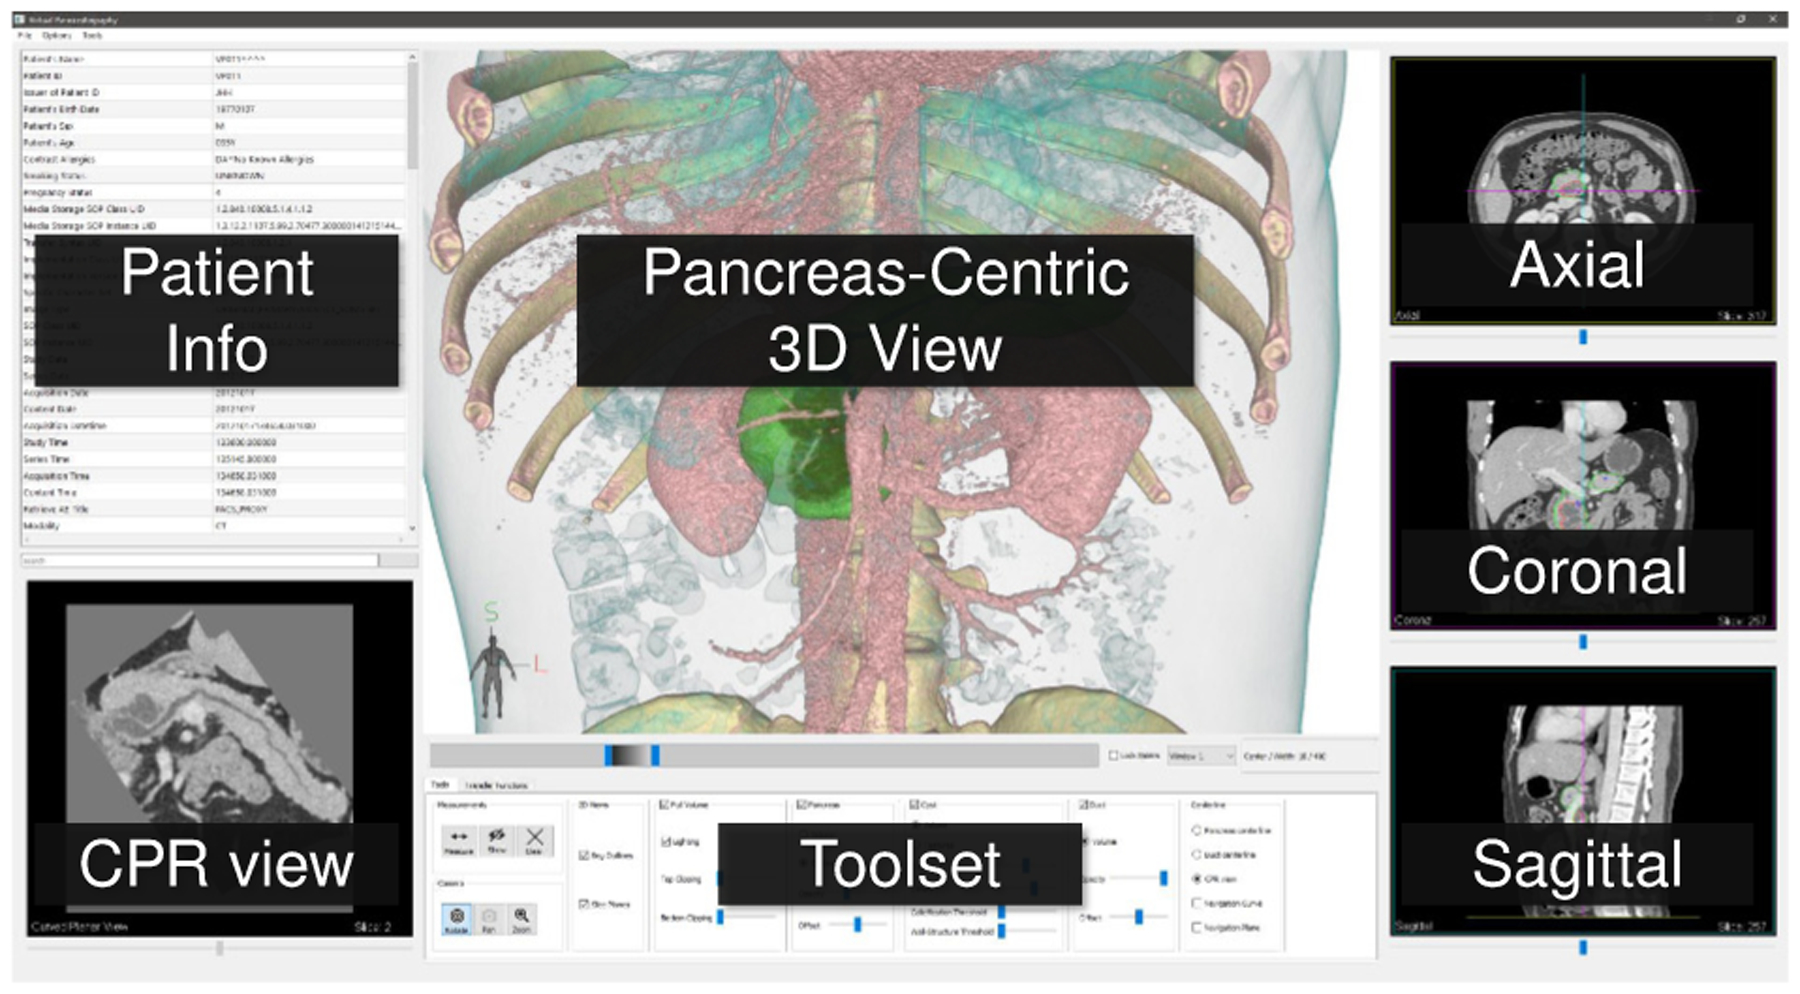
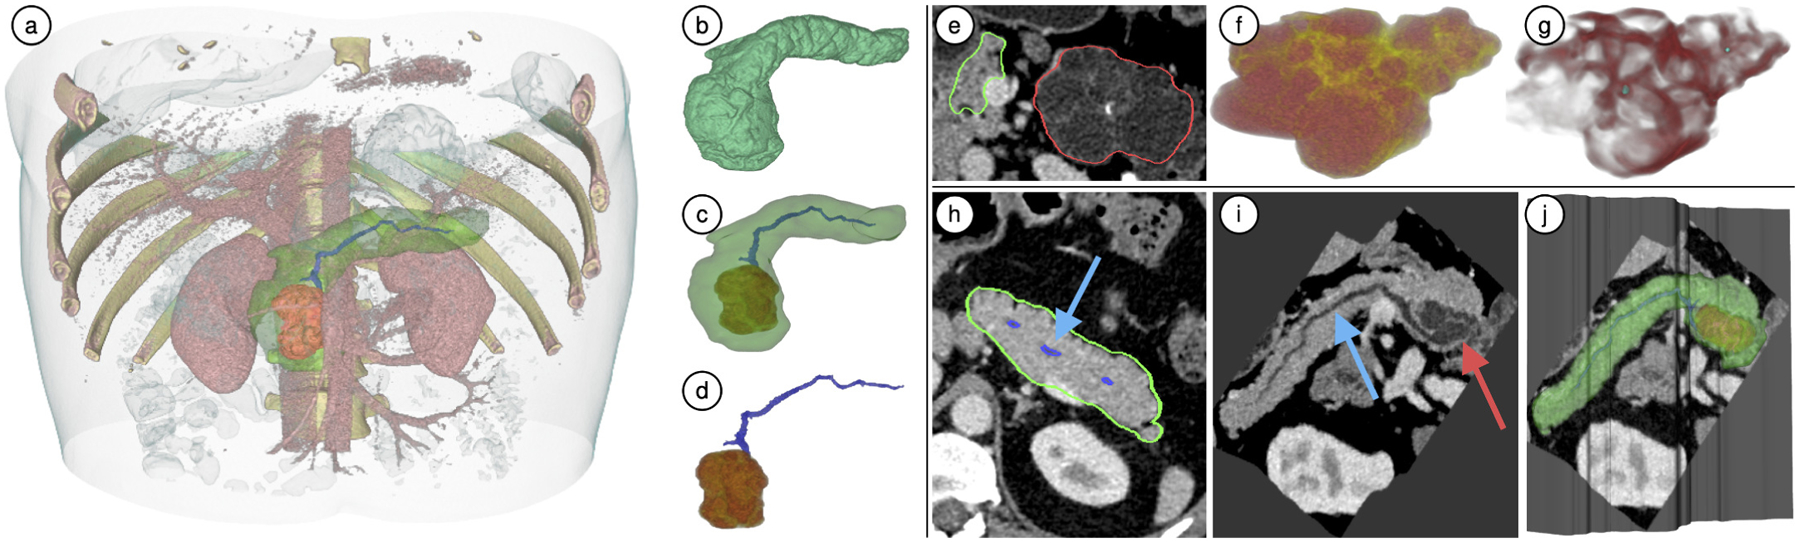
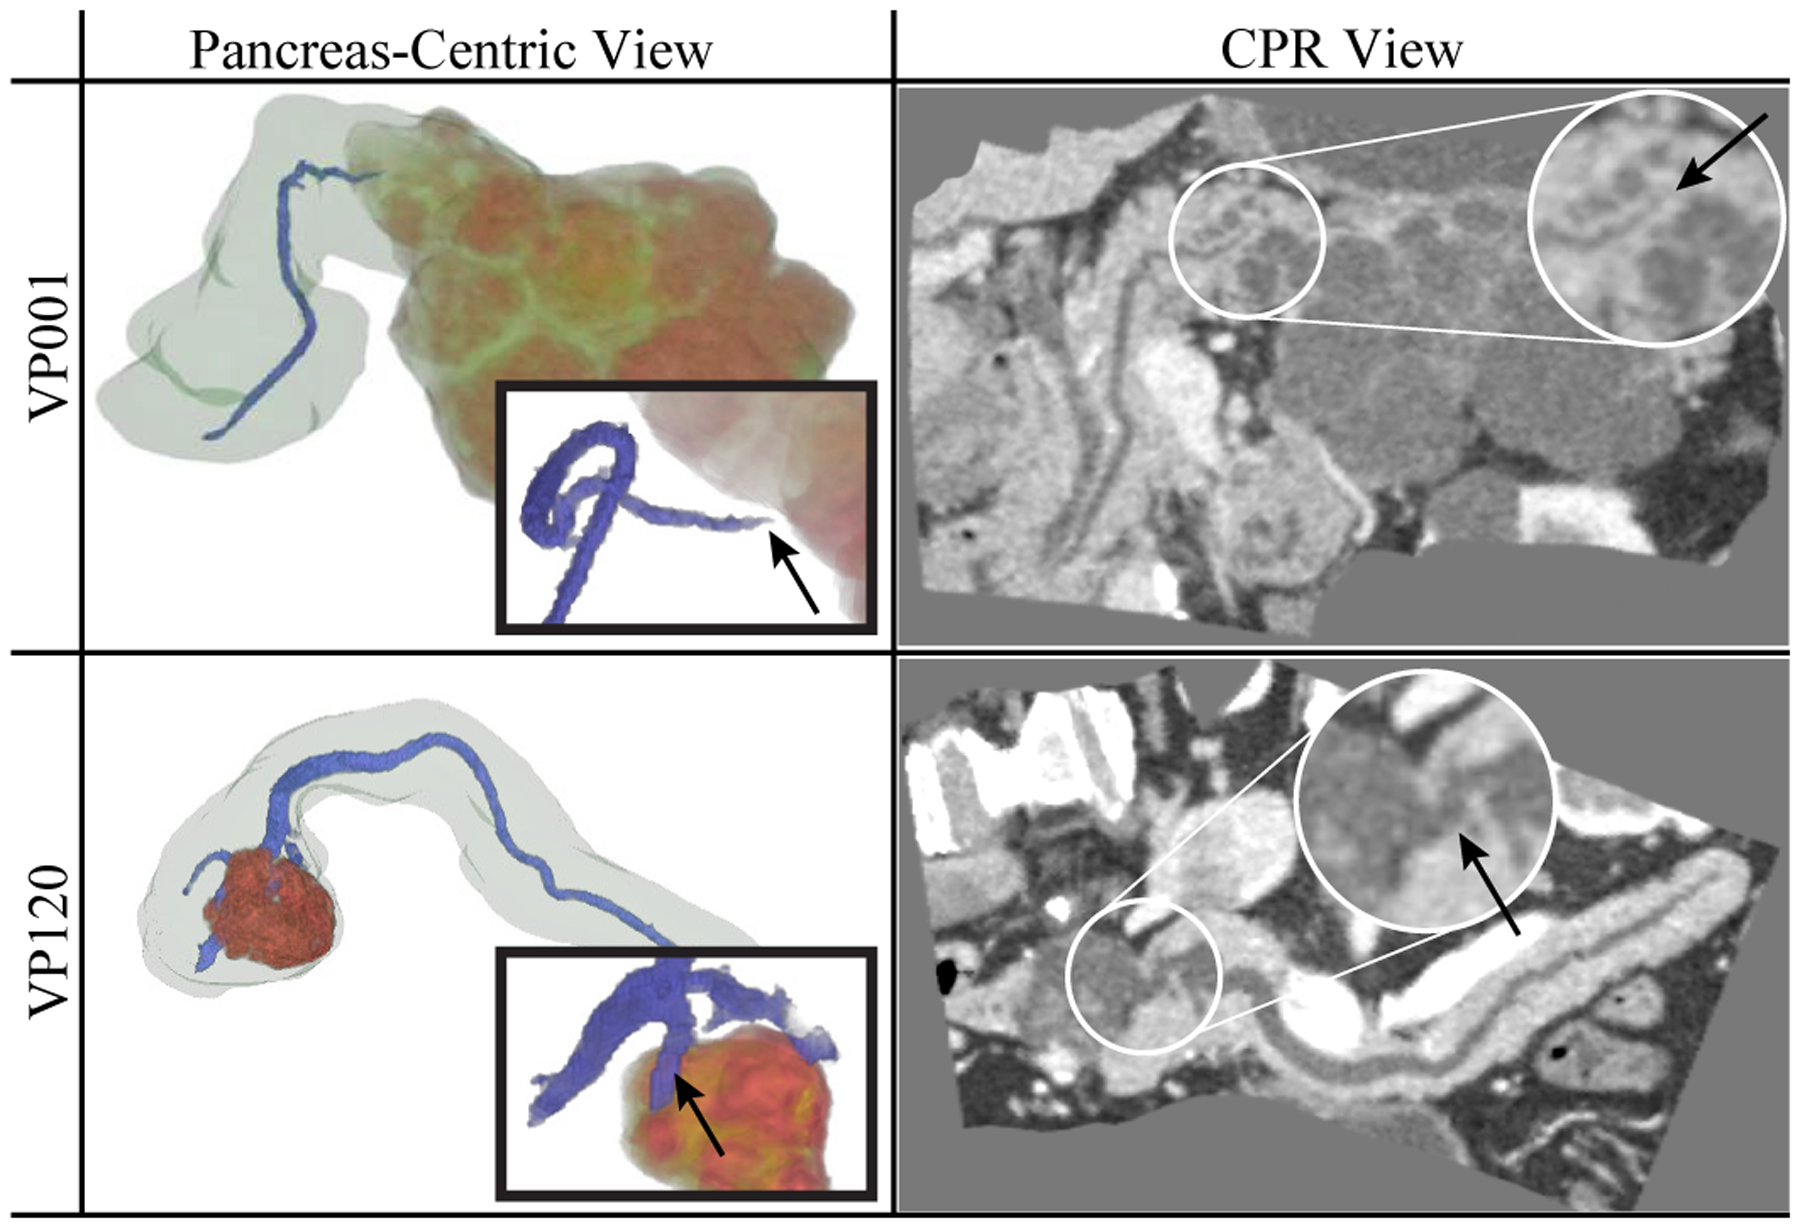
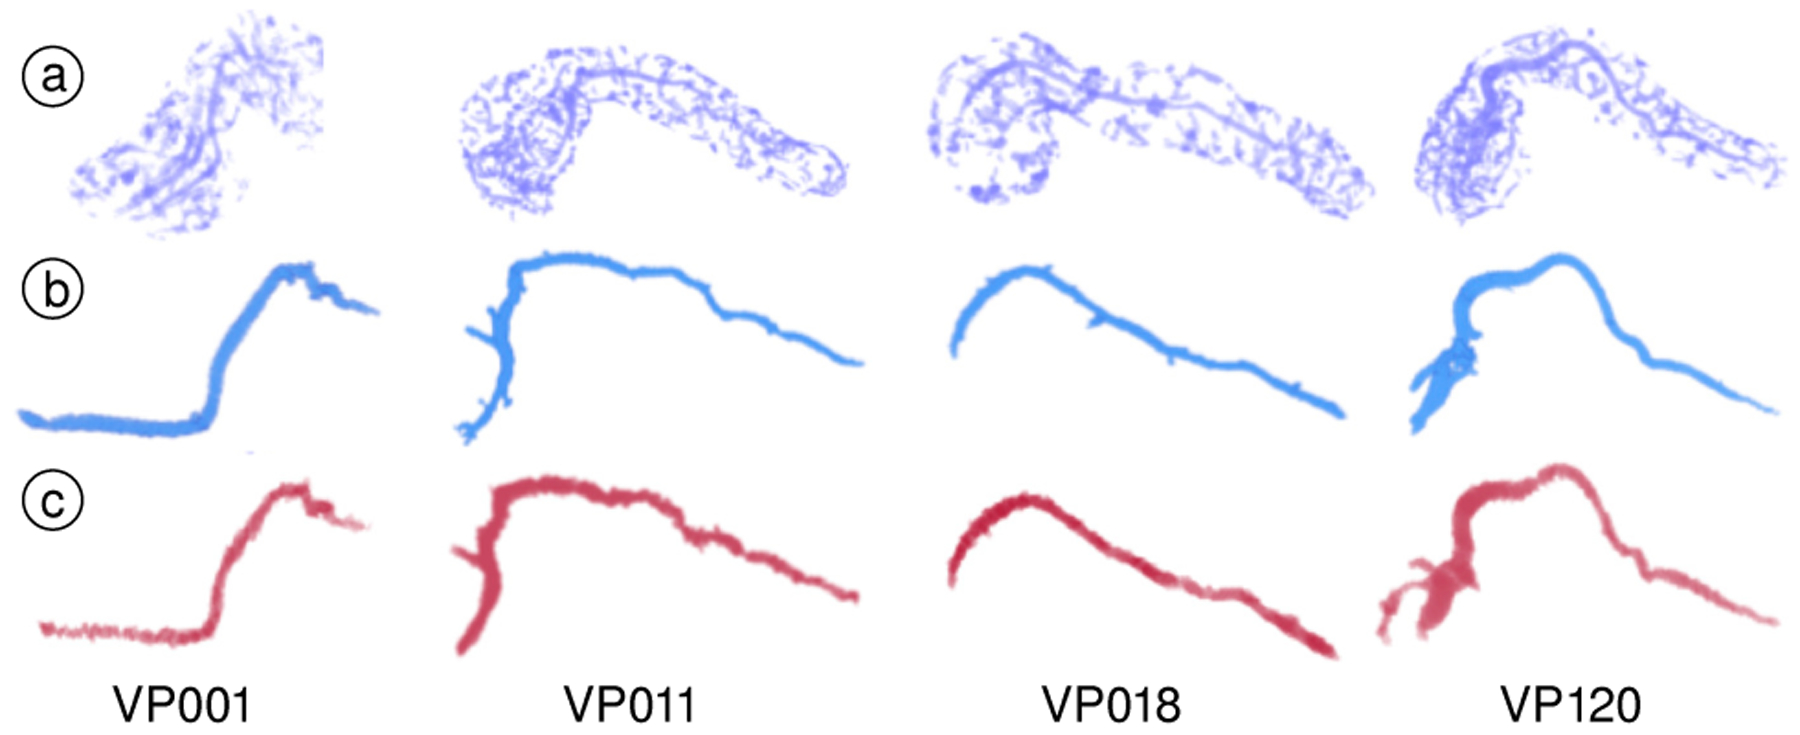
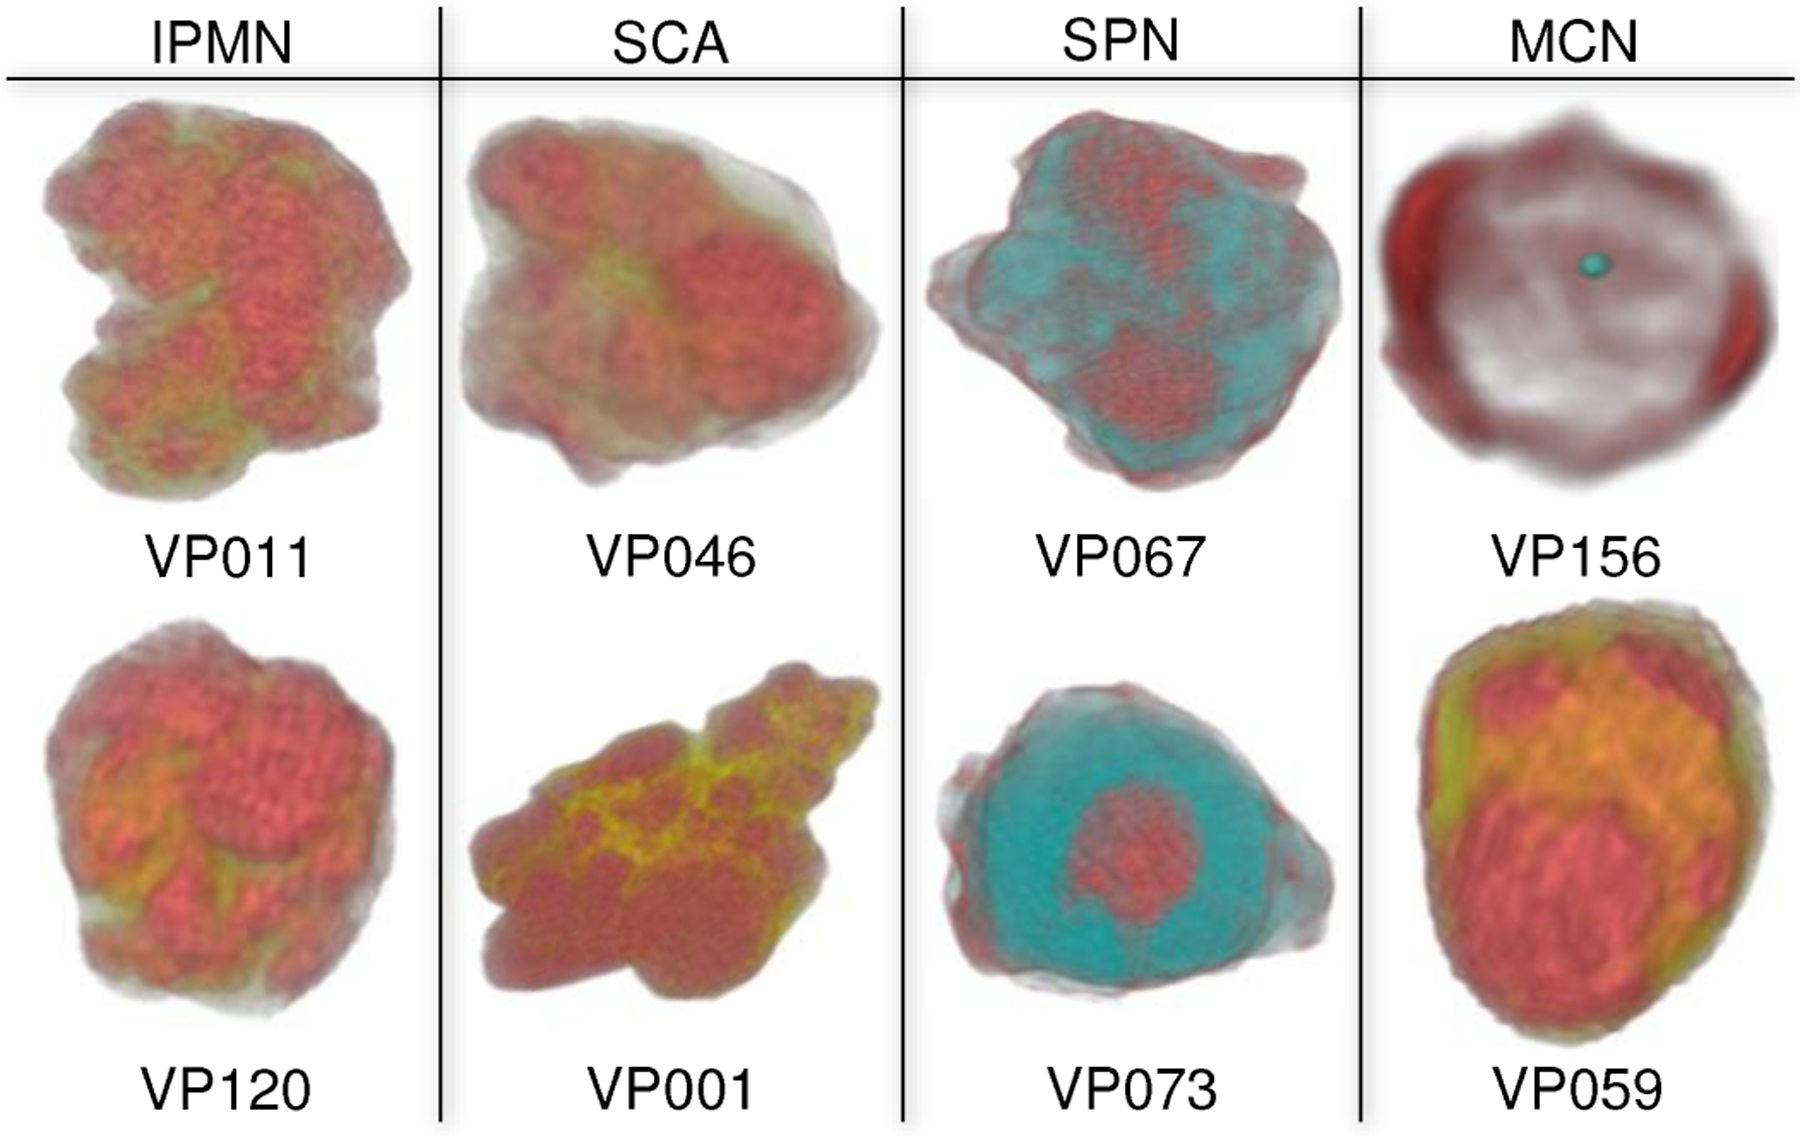
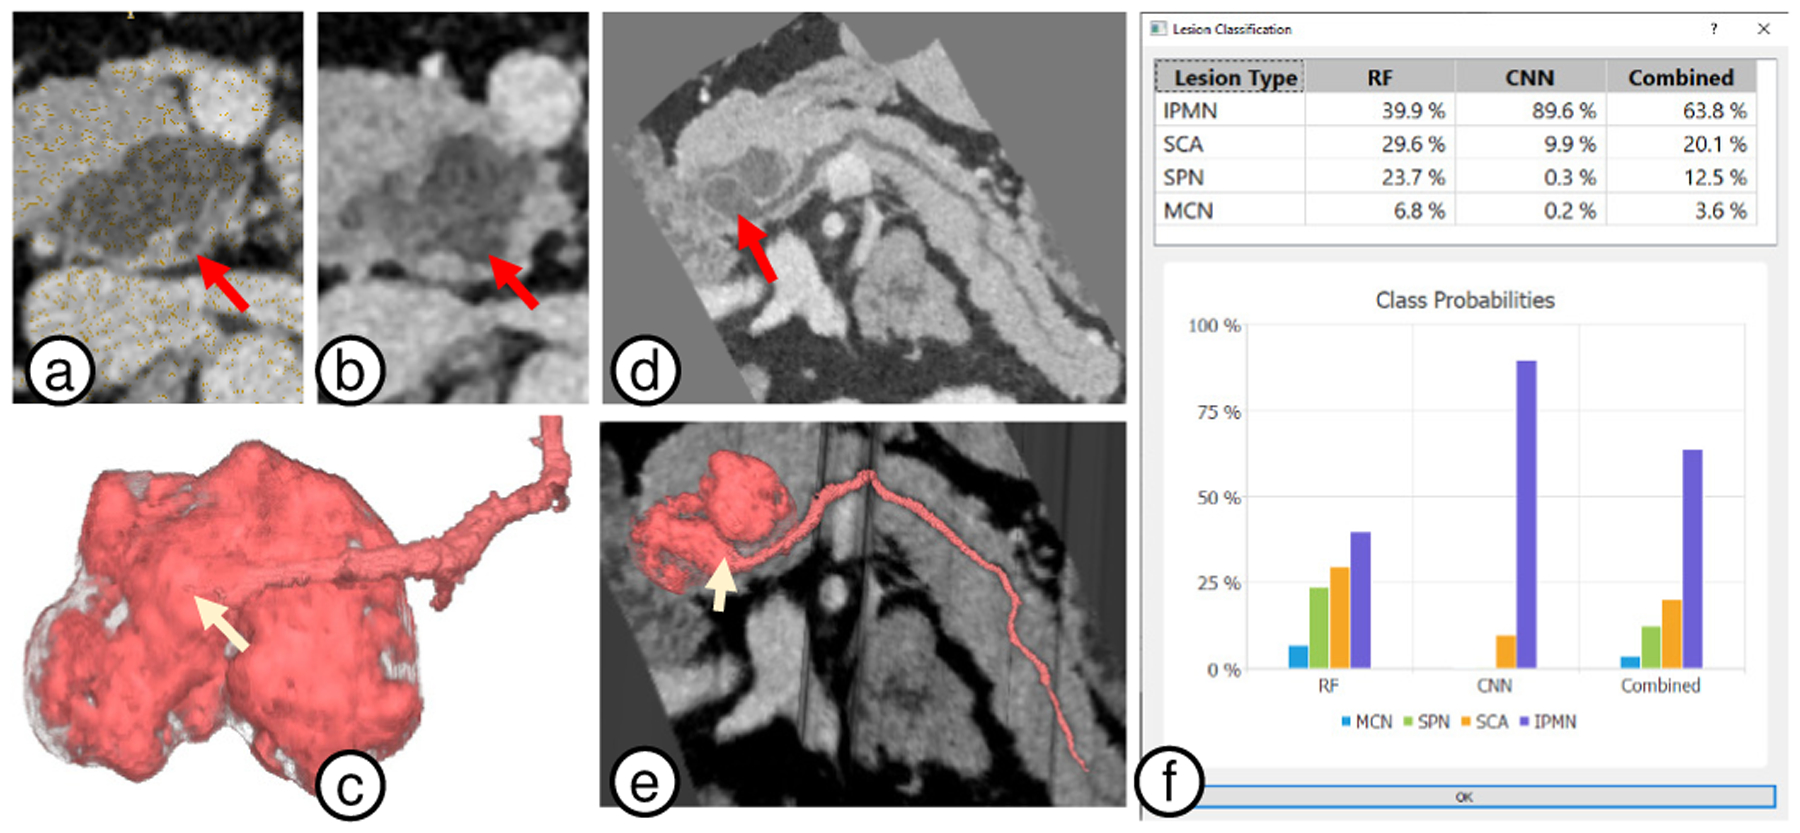
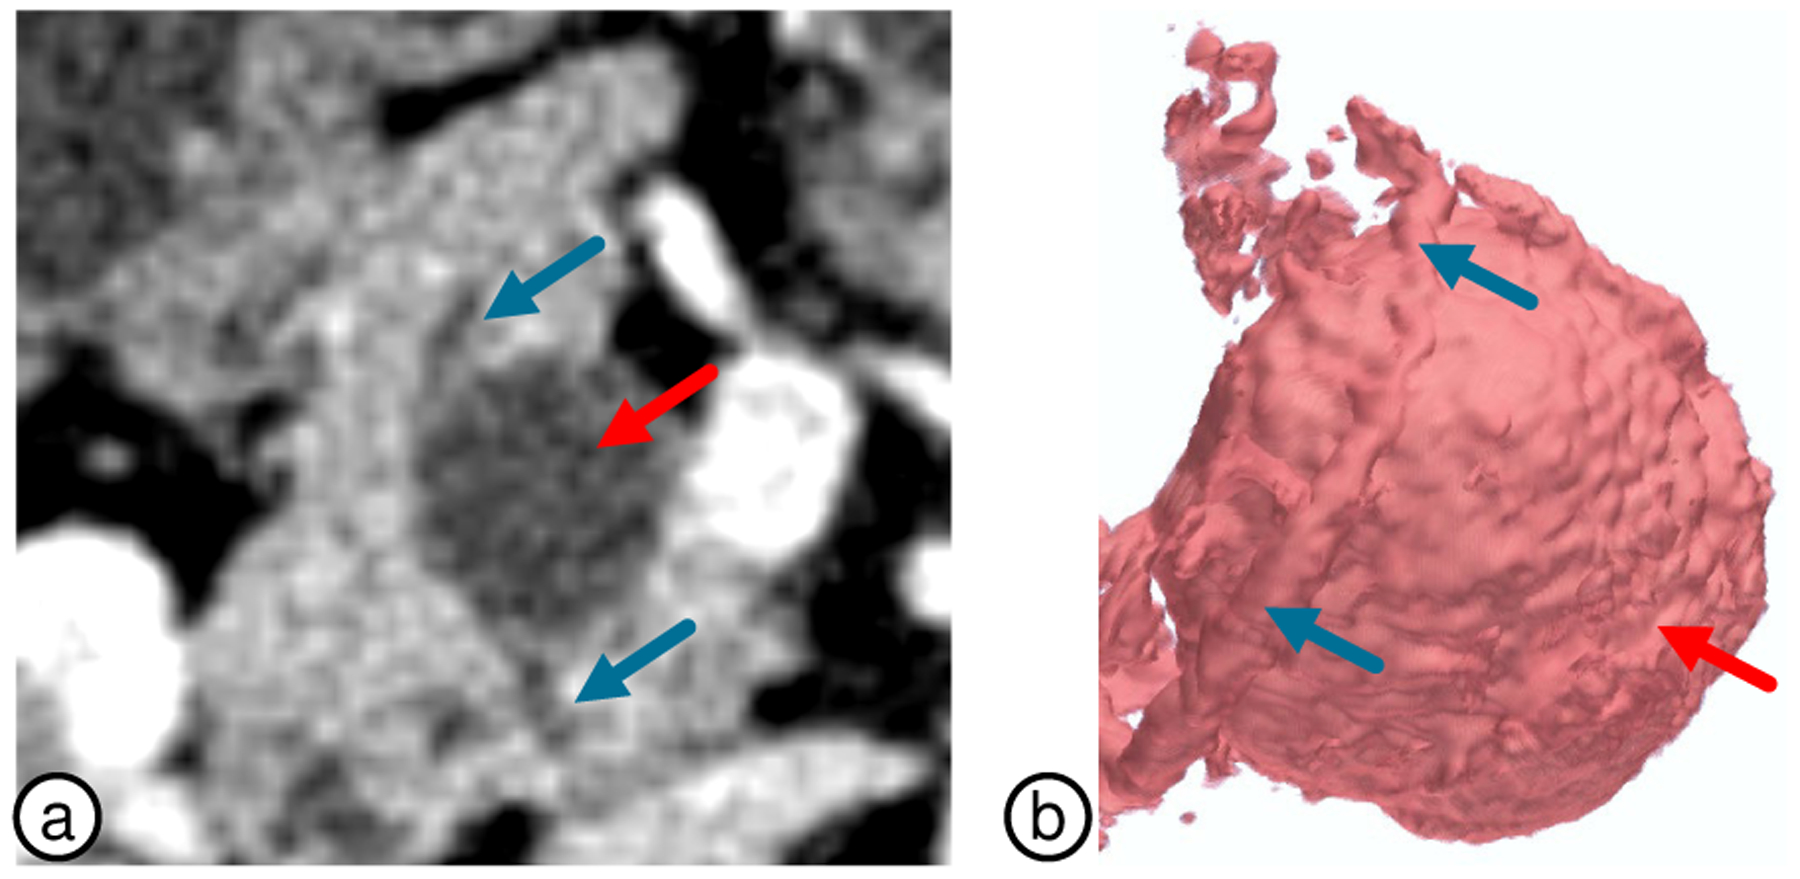
We present 3D virtual pancreatography (VP), a novel visualization procedure and application for non-invasive diagnosis and classification of pancreatic lesions, the precursors of pancreatic cancer. Currently, non-invasive screening of patients is performed through visual inspection of 2D axis-aligned CT images, though the relevant features are often not clearly visible nor automatically detected. VP is an end-to-end visual diagnosis system that includes: A machine learning based automatic segmentation of the pancreatic gland and the lesions, a semi-automatic approach to extract the primary pancreatic duct, a machine learning based automatic classification of lesions into four prominent types, and specialized 3D and 2D exploratory visualizations of the pancreas, lesions and surrounding anatomy. We combine volume rendering with pancreas- and lesion-centric visualizations and measurements for effective diagnosis. We designed VP through close collaboration and feedback from expert radiologists, and evaluated it on multiple real-world CT datasets with various pancreatic lesions and case studies examined by the expert radiologists.


Figures

Fig. 1.
Fig. 1.
Comparison of 2D slice views to 3D visualizations. (a) Axial slice of a lesion on pancreas head with apparent internal lesion septation wall (see arrow). (b)-(c) The same region can be external crevice rather than an internal septation wall. Thus, 3D visualizations reveal important shape and size information of the lesion cystic components, which can impact the diagnosis. (d) Axial slice of a lesion and primary duct (arrow) in the pancreas body. (e) Secondary duct that connects to the lesion appears very subtle on the slice view (arrow). (f) 3D visualization clearly shows the branching secondary duct connecting with the lesion. 3D visualizations can draw attention to such subtleties.
Fig. 2.
Fig. 2.
(a) The pancreas. (b) Pancreatic lesions with classical radiological features: peripheral calcification (MCN), macrocystic components with septation (SCA), cyst encapsulated by solid component (SPN), multiple cystic components connected to pancreatic duct (IPMN).
Fig. 3.
Fig. 3.
A schematic overview of the VP system pipeline.
Fig. 4.
Fig. 4.
A schematic view of the segmentation model.
Fig. 5.
Fig. 5.
(a) Duct centerline (red curve) on case VP002. It passes through the primary duct (blue) two components, following the pancreas elongated shape, while approximately maintaining constant distance from the pancreas surface. (b) Pancreas centerline (red curve) on VP002. (c) Centerline-guided re-sectioning view embedded in the 3D view for VP011 (red: lesion volume, green: pancreas surface, blue: duct volume).
Fig. 6.
Fig. 6.
Comparing benefits of our approach to compute duct centerline: (a) computed naively using penalty field, and (b) our approach. Note the reduction in bending at entry and exit points. Smoother centerline is necessary for constructing CPR and re-sectioning views.
Fig. 7.
Fig. 7.
Duct centerline algorithm. (a) Pancreas with two duct components (blue). x0, x1 are end-points of pancreas centerline. (b) ξ0, ξ1 are detached duct component centerlines. ζ0, ζ1, ζ2 are connecting curves. Together, the path ζ0, ξ0, ζ1, ξ1, ζ2 forms the entire duct centerline.
Fig. 8.
Fig. 8.
A schematic view of our classification model.
Fig. 9.
Fig. 9.
The VP user interface.
Fig. 10.
Fig. 10.
(a-d) Pancreas-centric 3D visualizations of case VP011: (a) Context volume around the pancreas clipped from the top and bottom for focused visualization; (b-d) The segmented anatomical structures and the CT volume rendered in different combinations. (e-g) Enhanced lesion visualization for VP001: (e) Axial view of the lesion (red) and pancreas (green); (f) DLR view shows septation (yellow) and cystic components (red); (g) EFR view: calcifications (cyan blobs) and septation (red) are enhanced through a Hessian-based objectness filter to provide clearer view of internal lesion features. (h-j) CPR views of VP011: (h) Axial 2D view of pancreas: pancreatic primary duct does not lie in a single plane and appears broken; (i) Duct-centric CPR view of the pancreas: the primary duct is completely visible in a single plane along with a lesion sectional view; (j) CPR surface embedded in 3D view: incorporating such a view along with 3D visualization is helpful in understanding how the CPR view was constructed.
Fig. 11.
Fig. 11.
Pancreas-centric and CPR views, assisting in confirming presence (VP120, IPMN) or absence (VP001, SCA) of duct-lesion connection (see arrows).
Fig. 12.
Fig. 12.
Duct volume rendering. (a) Direct application of the vesselness filter. (b) Extraction using our approach. (c) Manual segmentations.
Fig. 13.
Fig. 13.
3D visualization of lesions enhancing the important characteristics that can inform their visual classification. VP156 in EFR mode to render wall structures (red) and calcification (cyan). Others are in DLR mode: cystic components (red), septation / soft tissue (yellow), and solid components (cyan) that is an SPN characteristic feature.
Fig. 14.
Fig. 14.
Case VP011. (a) 2D view with duct footprint (red arrow) next to grey lesion. (b) 2D lesion view as the duct (red arrow) merges into the lesion. It is difficult to visualize the separation between the duct and lesion, and thus notice the duct geometry. (c) 3D visualizations show a clear fusiform dilatation (white arrow) of the main duct as it connects with the lesion. (d-e) 2D and 3D CPR views provide additional views to confirm the diagnosis. (f) Finally, lesion classification independently classifies the lesion as an IPMN (overall probability 63.8%).
Fig. 15.
Fig. 15.
Case VP018. (a) 2D axial view of the main duct (blue arrows) and the lesion (gray circular region, red arrow). It was hard for the radiologist to discern whether the duct is adjacent or enters the lesion. (b) 3D visualization clearly shows the main duct (blue arrows) touching the lesion (red arrow), but passes around without entering it.

References

    1. Cancer Facts & Figures. American Cancer Society, 2019.
    1. Sahani DV, Sainani NI, Blake MA, Crippa S, Mino-Kenudson M, and del Castillo CF, “Prospective evaluation of reader performance on MDCT in characterization of cystic pancreatic lesions and prediction of cyst biologic aggressiveness,” Am J Roentgenol, 197(1):W53–W61, 2011. - PubMed
    1. Bartz D, “Virtual endoscopy in research and clinical practice,” Comput Graph Forum, 24(1):111–126, 2005.
    1. Hong L, Kaufman A, Wei Y-C, Viswambharan A, Wax M, and Liang Z, “3D virtual colonoscopy,” IEEE Biomed Vis, 26–32, 1995.
    1. Hong L, Muraki S, Kaufman A, Bartz D, and He T, “Virtual voyage: Interactive navigation in the human colon,” SIGGRAPH, pp. 27–34, 1997.

Publication types