. 2020 Oct 2;5(19):e141736.
doi: 10.1172/jci.insight.141736.

Fibroblast growth factor homologous factors tune arrhythmogenic late NaV1.5 current in calmodulin binding-deficient channels

Affiliations

Fibroblast growth factor homologous factors tune arrhythmogenic late NaV1.5 current in calmodulin binding-deficient channels

Jeffrey Abrams et al. JCI Insight. .

Abstract

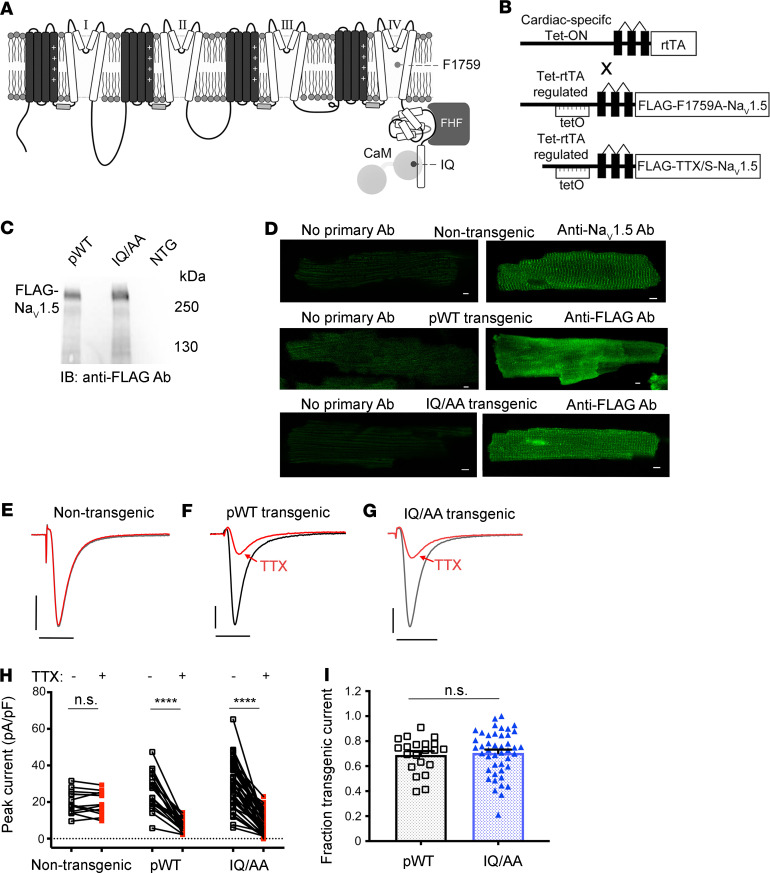
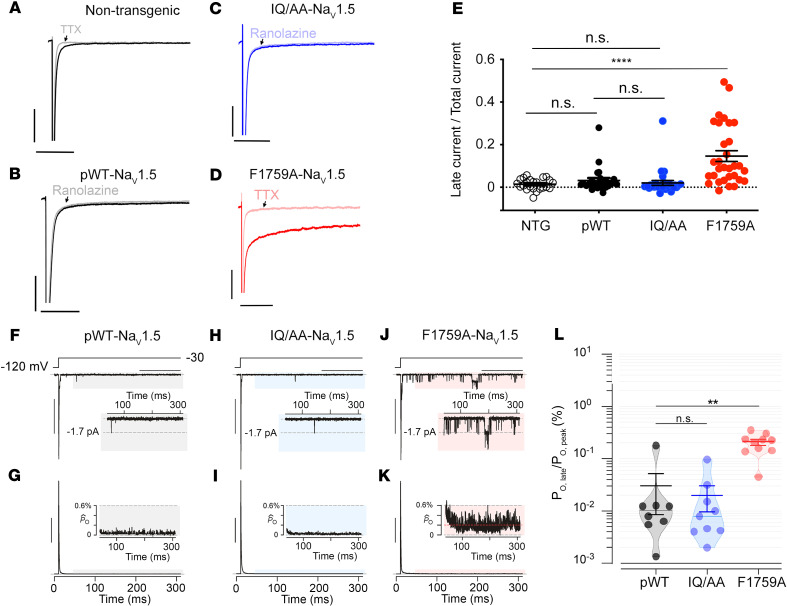
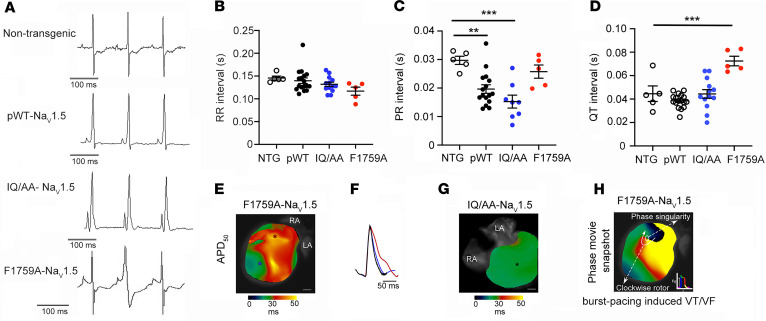
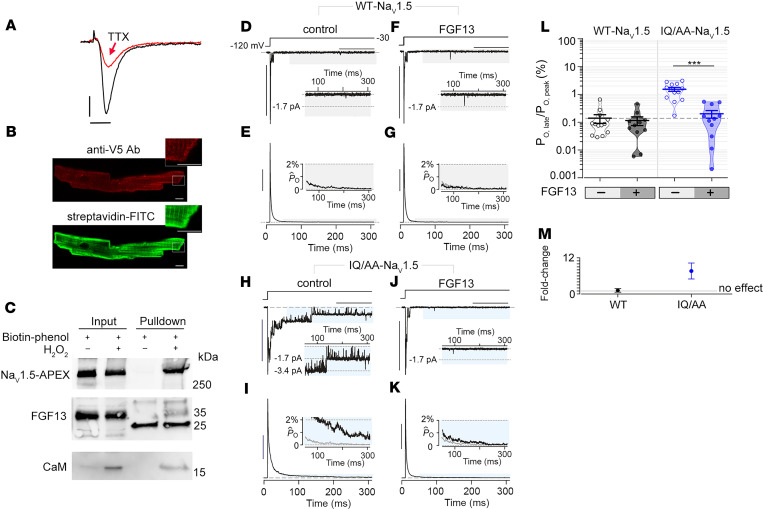
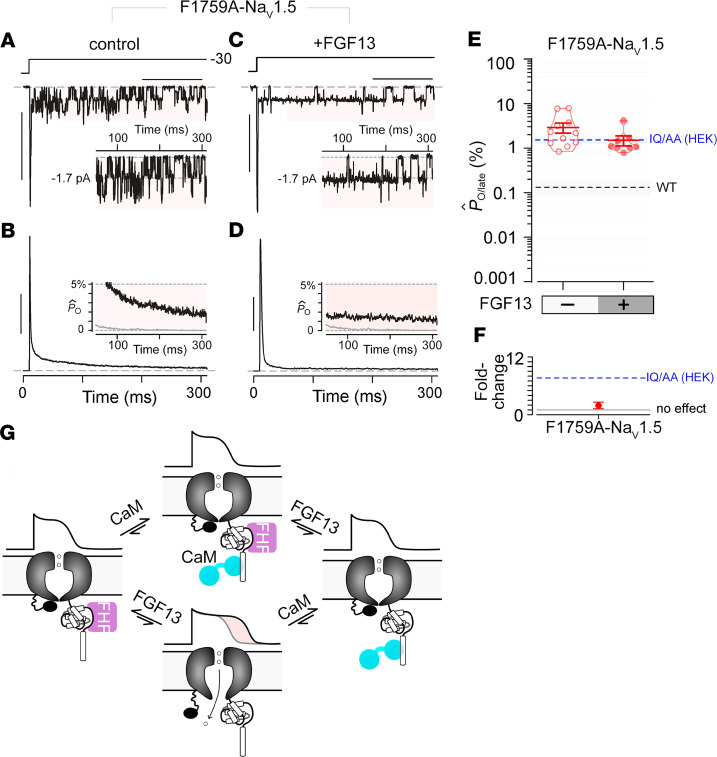
The Ca2+-binding protein calmodulin has emerged as a pivotal player in tuning Na+ channel function, although its impact in vivo remains to be resolved. Here, we identify the role of calmodulin and the NaV1.5 interactome in regulating late Na+ current in cardiomyocytes. We created transgenic mice with cardiac-specific expression of human NaV1.5 channels with alanine substitutions for the IQ motif (IQ/AA). The mutations rendered the channels incapable of binding calmodulin to the C-terminus. The IQ/AA transgenic mice exhibited normal ventricular repolarization without arrhythmias and an absence of increased late Na+ current. In comparison, transgenic mice expressing a lidocaine-resistant (F1759A) human NaV1.5 demonstrated increased late Na+ current and prolonged repolarization in cardiomyocytes, with spontaneous arrhythmias. To determine regulatory factors that prevent late Na+ current for the IQ/AA mutant channel, we considered fibroblast growth factor homologous factors (FHFs), which are within the NaV1.5 proteomic subdomain shown by proximity labeling in transgenic mice expressing NaV1.5 conjugated to ascorbate peroxidase. We found that FGF13 diminished late current of the IQ/AA but not F1759A mutant cardiomyocytes, suggesting that endogenous FHFs may serve to prevent late Na+ current in mouse cardiomyocytes. Leveraging endogenous mechanisms may furnish an alternative avenue for developing novel pharmacology that selectively blunts late Na+ current.

Keywords: Arrhythmias; Calmodulin; Cardiology; Sodium channels.


Conflict of interest statement

Conflict of interest: The authors have declared that no conflict of interest exists.

Figures

Figure 1
Figure 1. Cardiac-specific, FLAG-tagged TTX-sensitive NaV1.5-expressing transgenic mice.
(A) Diagram showing NaV1.5. The pore-forming α-subunit is a pseudotetramer of transmembrane domains (I–IV) linked by intracellular loops. The channel’s inactivation gate is in the III–IV linker. The best-established CaM binding site is on the C-terminal domain, where the FHF binding site also resides. (B) Schematic of binary transgene system. The expression of reverse tetracycline-controlled transactivator (rtTA) is driven by the cardiac-specific α-myosin heavy chain promoter. The cDNAs for FLAG-F1759A-NaV1.5 or FLAG-tagged TTX-sensitive NaV1.5 were ligated behind 7 tandem tetO sequences. (C) Anti-FLAG antibody immunoblots of cleared lysates of hearts from pWT, IQ/AA, and nontransgenic mice. Representative images of 3 independent experiments. (D) Immunostaining of nontransgenic, pWT, and IQ/AA mice cardiomyocytes. Nontransgenic cardiomyocytes: primary antibody, anti-NaV1.5 antibody. pWT and IQ/AA cardiomyocytes: primary antibody, anti-FLAG antibody. FITC-conjugated secondary antibody was used for all experiments. Scale bar: 5 μm. Representative of 20 cardiomyocytes from at least 3 independent cardiomyocyte isolations for all groups. (E–G) Exemplar whole cell Na+ current trace of ventricular cardiomyocyte from nontransgenic, pWT, and IQ/AA transgenic mice in the absence (black) and presence (red) of 20 nM TTX. Representative of n = 13, 21, and 44 cells, from left to right. Vertical scale bars: 10 pA/pF; horizontal scale bars: 5 ms. (H) Graph showing effect of 20 nM TTX on peak Na+ current. ****P < 0.0001 by paired t test. For nontransgenic, P = 0.61. n = 13, 21, and 44 cells from left to right. (I) Graph of fraction transgenic Na+ current for pWT and IQ/AA. Mean ± SEM. n = 21 and 44 cells from left to right. P = 0.73 by t test.
Figure 2
Figure 2. Late Na+ current is not increased in cardiomyocytes expressing IQ/AA NaV1.5.
(A–D) Exemplar whole cell Na+ current traces of ventricular cardiomyocytes isolated from nontransgenic, pWT, IQ/AA, and F1759A mice. Experiments designed to assess late Na+ current using a 190 ms depolarization from a holding potential of –110 to –30 mV in the absence and presence of 500 μM ranolazine or 40 μM TTX; intracellular solution contained 5 mM Na+ and extracellular solution contained 100 mM Na+. Horizontal scale bars: 50 ms; vertical scale bars: 10 pA/pF. (E) Graph of fraction of late Na+ current normalized to peak Na+ current. Mean ± SEM, ****P < 0.0001 by Kruskal-Wallis test with Dunn’s multiple comparison test. n = 23, 25, 29, and 31 cardiomyocytes from left to right. (F) Multichannel record from pseudo-WT myocyte shows rapid Na+ channel activation and inactivation, followed by a rare opening in the late phase, following 50 ms of depolarization (gray shaded region). Inset shows lone NaV1.5 opening to unitary current level (dashed line) in the late phase. Vertical scale bar: 10 pA; horizontal scale bar: 100 ms. (G) Normalized ensemble-average open probability relation computed from 50–80 stochastic records. Inset shows low levels of late PO following 50 ms of depolarization. Vertical scale bar: 25% for normalized PO (PO[t]/PO,peak). PO(t), time-dependent open probability; PO,peak denotes the peak open probability. (H and I) Multichannel recordings of Na+ channels from IQ/AA mice show minimal late current similar to pWT myocytes. Format as in F and G. (J and K) Appreciable late Na+–channel openings were detected for F1759A mutant. Format as in F and G. (L) Graph of PO normalized to peak PO. Mean ± SEM, **P < 0.001 by Kruskal-Wallis test, **P < 0.01 by Dunn’s multiple comparison test.
Figure 3
Figure 3. QT interval and ventricular repolarization is not prolonged in IQ/AA transgenic mice.
(A) Representative limb-lead surface electrocardiograms of isoflurane-anesthetized littermate nontransgenic, pWT, IQ/AA, and F1759A transgenic mice. (B–D) Bar graphs of RR, PR, and QT intervals from isoflurane-anesthetized mice. Mean ± SEM. For RR interval, P= 0.12; for PR interval, P = 0.0004; for QT interval, P < 0.001 by 1-way ANOVA. **P < 0.01, ***P < 0.001 by Dunnett’s multiple comparison test. NTG, n = 5; pWT, n = 17; IQ/AA, n = 13; F1759A, n = 5. (E–G) Representative optical APD maps (E and G) and optical action potential tracings (F) from F1759A and IQ/AA mice. APD maps for F1759A-dTG were obtained after hyperkalemia-induced conversion to sinus rhythm. The circles in panels E and G mark the regions for which optical action potential tracings are displayed in F. Scale bar: 1 mm. Representative of 3 similar recordings. (H) Snapshot from phase movie of Langendorff-perfused F1759A-dTG hearts demonstrating rotor in the ventricle after burst pacing–induced ventricular arrhythmia. Representative of 3 similar experiments.
Figure 4
Figure 4. Expression of FGF13 reduces late Na+ current in IQ/AA NaV1.5.
(A) Exemplar whole cell Na+ currents recorded from cardiomyocytes of TTX-sensitive NaV1.5-V5-APEX2 transgenic mice, before (black trace) and after (red trace) 20 nM TTX. Representative of 3 similar recordings. Vertical scale bar: 5 pA/pF; horizontal scale bar: 5 ms. (B) Immunofluorescence of cardiomyocytes isolated from mice expressing NaV1.5-V5-APEX2 exposed to biotin-phenol and H2O2. Staining is with anti-V5– and –Alexa 594–conjugated secondary antibodies (upper) and streptavidin-conjugated Alexa 488. Scale bar: 5 μm. (C) Immunoblots of biotin-labeled proteins from cardiomyocytes of NaV1.5-APEX2 mice. NaV1.5, FGF13, and CaM are detected in streptavidin pull-down. Blots are representative of 2 independent experiments. (D and E) Multichannel recordings show minimal late Na+–channel openings for WT-NaV1.5 expressed in HEK293 cells. Format as in Figure 2, F and G. Horizontal scale bar: 100 ms; vertical scale bar: 10 pA (D) and 25% for normalized PO (PO[t]/PO,peak) (E). (F and G) Late current of WT-NaV1.5 is unaffected by FGF13 overexpression. Same format as in D and E. (H and I) IQ/AA NaV1.5 mutant channel showing enhanced late-channel openings compared with WT-NaV1.5 in HEK293 cells. Same format as in D and E. (J and K) FGF13 coexpression with IQ/AA NaV1.5 reverses the increase in late current to WT levels. Same format as in D and E. (L) Dot plot summary of PO,late for WT-NaV1.5 and IQ/AA NaV1.5 in the presence and absence of FGF13. Mean ± SEM, ***P < 0.0001 by Kruskal-Wallis test with Dunn’s multiple comparison test. (M) Graph shows fold-change in PO,late for WT-NaV1.5 and IQ/AA NaV1.5 by FGF13. Mean ± SEM, computed from aggregate data in L.
Figure 5
Figure 5. Late Na+ current for F1759A-NaV1.5 is minimally perturbed by FGF13.
(A and B) Multichannel recordings show high late Na+ current for F1759A-NaV1.5 mutant when expressed in HEK293 cells. Format as in Figure 2, F and G. Horizontal scale bar: 100 ms; vertical scale bar: 10 pA (A) and 25% for normalized PO (PO[t]/PO,peak) (B). (C and D) FGF13 coexpression with F1759A-NaV1.5 mutant. Horizontal scale bar: 100 ms; vertical scale bar:10 pA (C) and 25% for normalized PO (PO[t]/PO,peak) (D). (E and F) Population data confirm minimal change in late PO for F1759A-NaV1.5 with FGF13. Format as in Figure 4, L and M. Open probability of late Na+ current from heterologously expressed IQ/AA NaV1.5 (without FHF13) is shown by the dashed blue line. (G) Schematic depicting late Na+ current in the absence of both FGF13 and CaM binding to the C-terminal domain of NaV1.5. Late Na+ current is not present when either FHF or CaM binds to the C-terminal domain of NaV1.5.

Similar articles

Cited by

References

    1. Yan Z, et al. Structure of the Nav1.4-β1 Complex from Electric Eel. Cell. 2017;170(3):470–482.e11. doi: 10.1016/j.cell.2017.06.039. - DOI - PubMed
    1. Abriel H, Rougier JS, Jalife J. Ion channel macromolecular complexes in cardiomyocytes: roles in sudden cardiac death. Circ Res. 2015;116(12):1971–1988. doi: 10.1161/CIRCRESAHA.116.305017. - DOI - PMC - PubMed
    1. Wilde AAM, Amin AS. Clinical Spectrum of SCN5A Mutations: Long QT Syndrome, Brugada Syndrome, and Cardiomyopathy. JACC Clin Electrophysiol. 2018;4(5):569–579. doi: 10.1016/j.jacep.2018.03.006. - DOI - PubMed
    1. Wang Q, et al. SCN5A mutations associated with an inherited cardiac arrhythmia, long QT syndrome. Cell. 1995;80(5):805–811. doi: 10.1016/0092-8674(95)90359-3. - DOI - PubMed
    1. Wan E, et al. Aberrant sodium influx causes cardiomyopathy and atrial fibrillation in mice. J Clin Invest. 2016;126(1):112–122. doi: 10.1172/JCI84669. - DOI - PMC - PubMed

Publication types

MeSH terms