. 2020 Nov 2;219(11):e201910149.
doi: 10.1083/jcb.201910149.

Loss of CBX2 induces genome instability and senescence-associated chromosomal rearrangements

Affiliations

Loss of CBX2 induces genome instability and senescence-associated chromosomal rearrangements

Claudia Baumann et al. J Cell Biol. .

Abstract

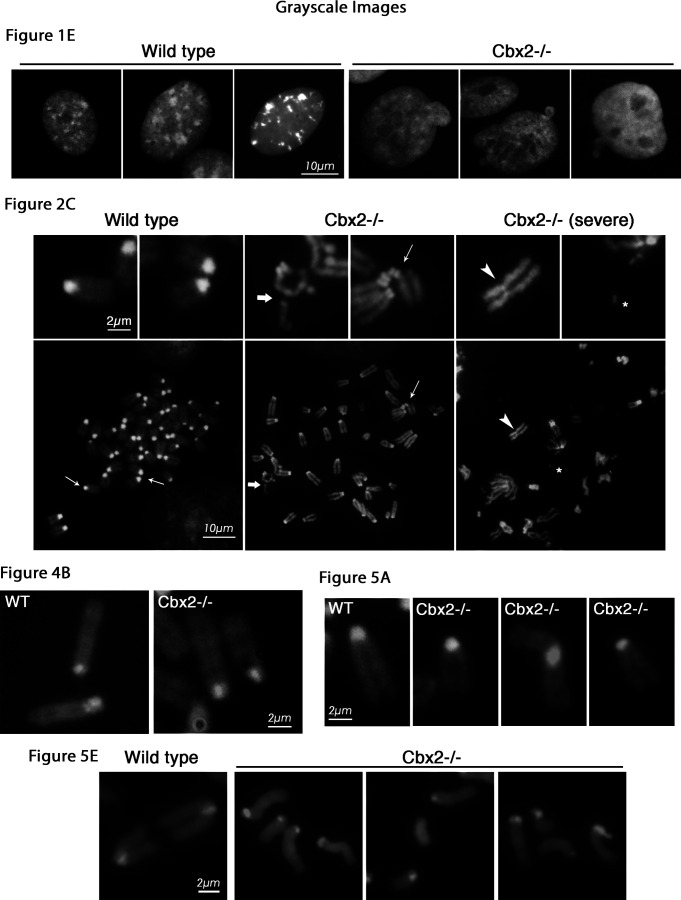
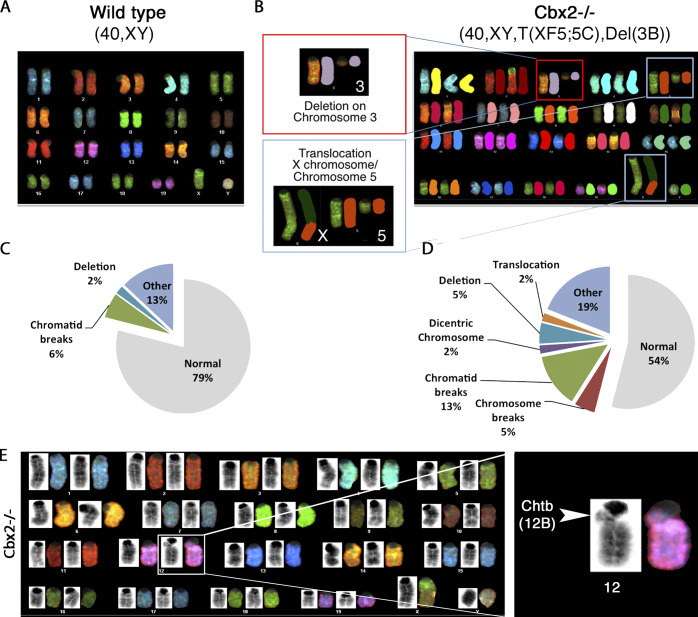
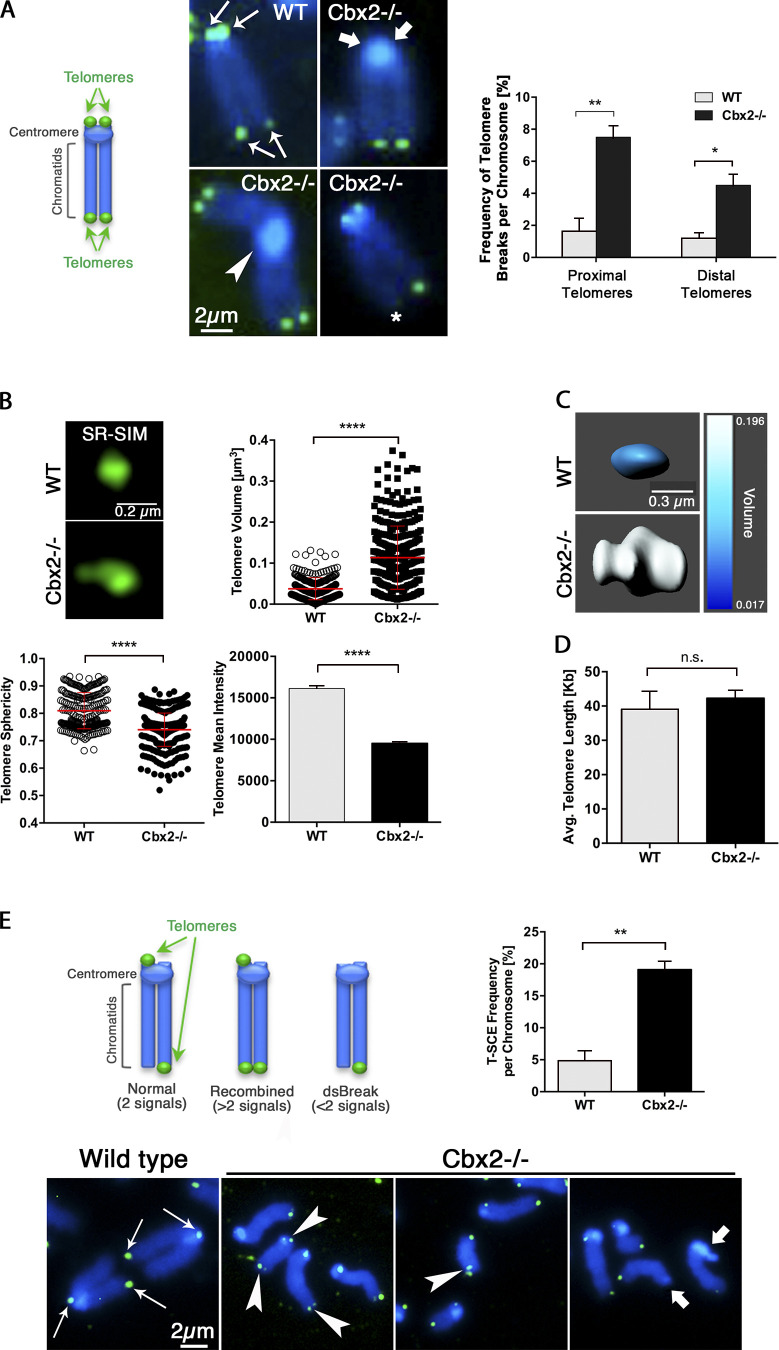
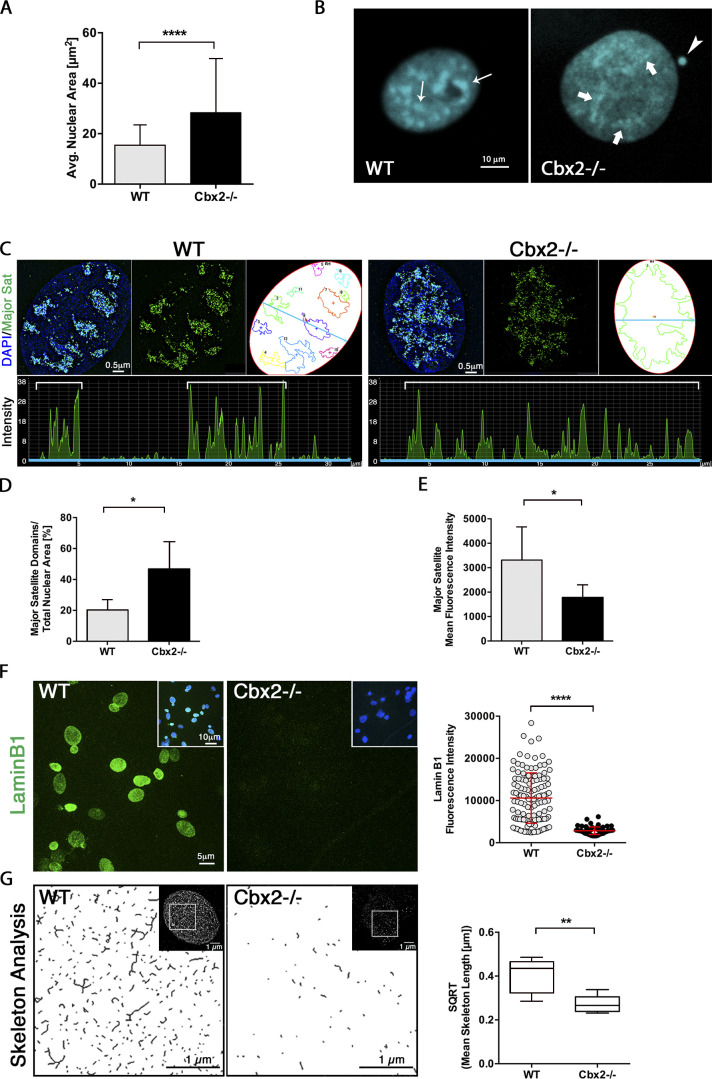
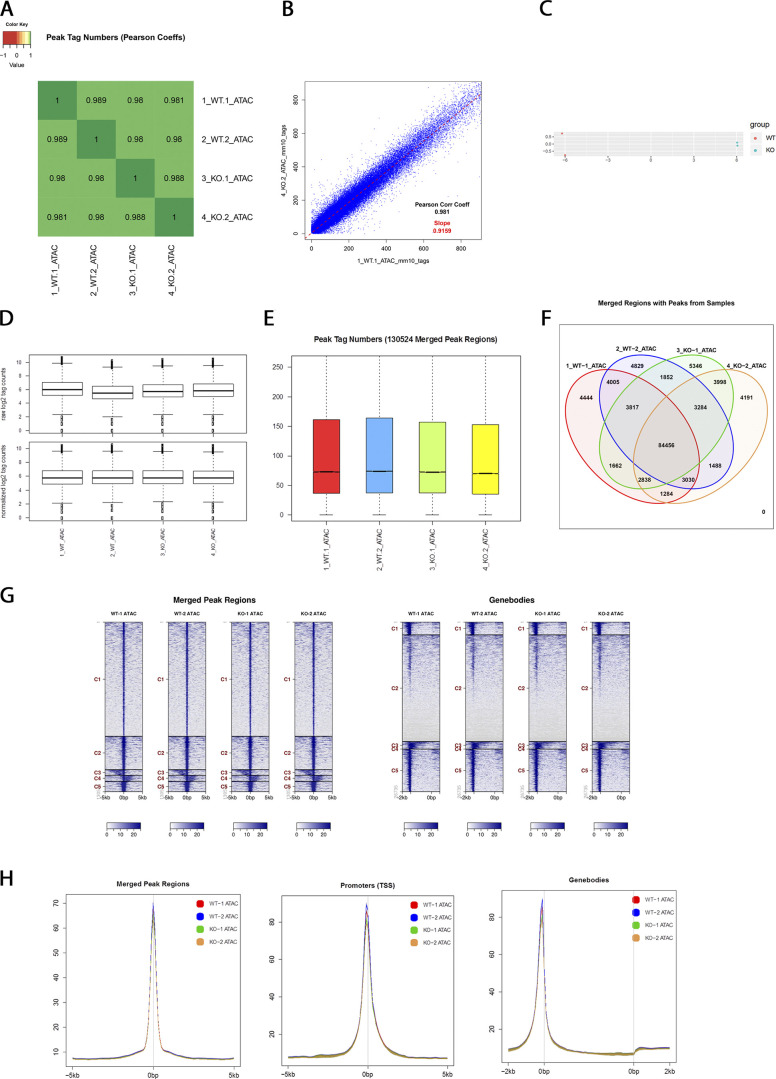
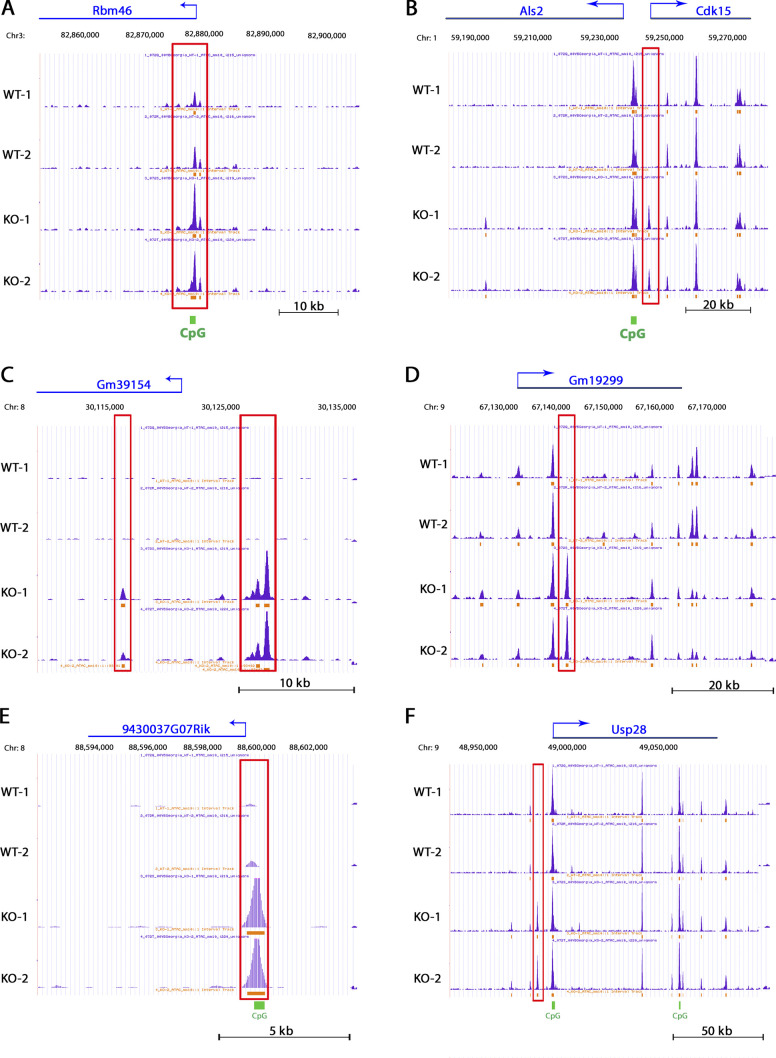
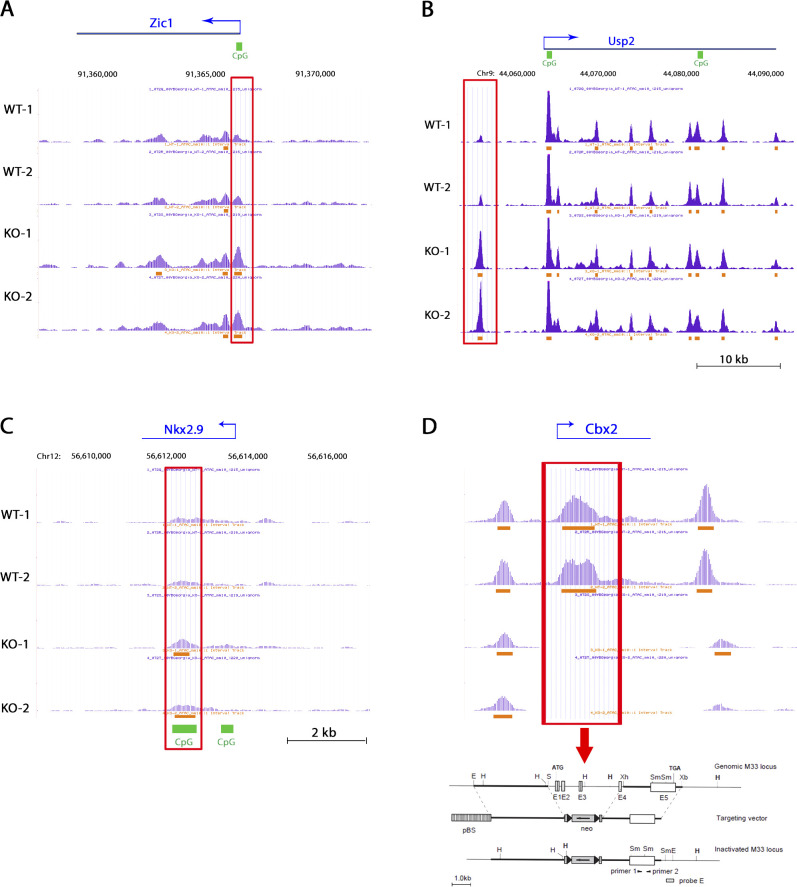
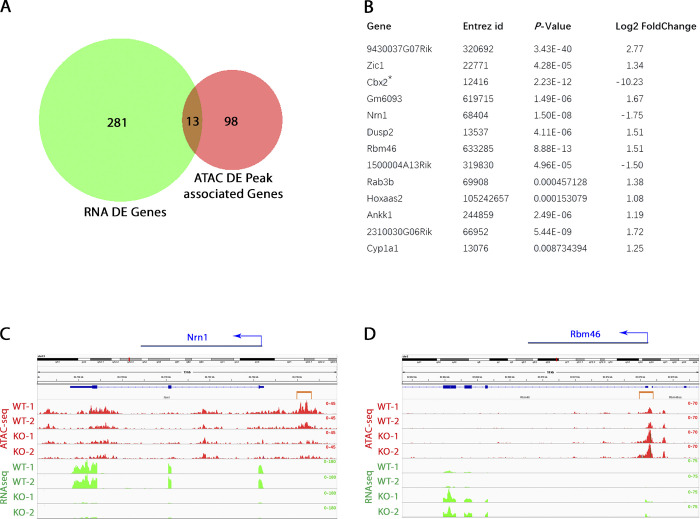
The polycomb group protein CBX2 is an important epigenetic reader involved in cell proliferation and differentiation. While CBX2 overexpression occurs in a wide range of human tumors, targeted deletion results in homeotic transformation, proliferative defects, and premature senescence. However, its cellular function(s) and whether it plays a role in maintenance of genome stability remain to be determined. Here, we demonstrate that loss of CBX2 in mouse fibroblasts induces abnormal large-scale chromatin structure and chromosome instability. Integrative transcriptome analysis and ATAC-seq revealed a significant dysregulation of transcripts involved in DNA repair, chromocenter formation, and tumorigenesis in addition to changes in chromatin accessibility of genes involved in lateral sclerosis, basal transcription factors, and folate metabolism. Notably, Cbx2-/- cells exhibit prominent decondensation of satellite DNA sequences at metaphase and increased sister chromatid recombination events leading to rampant chromosome instability. The presence of extensive centromere and telomere defects suggests a prominent role for CBX2 in heterochromatin homeostasis and the regulation of nuclear architecture.


Figures

Figure 1.
Figure 1.
Chromosome instability in Cbx2−/− fibroblasts. (A–D) Metaphases obtained from wild-type (n = 58) or Cbx2−/− (n = 68) fibroblast cultures showing base levels of chromosomal instability at P2. Culture to P5 significantly increases the incidence of chromosomal breaks and fragments (arrows, insets), fusions (arrowheads, inset) and premature centromere separation (asterisks, inset) in Cbx2−/− fibroblasts (n = 76) compared with wild-type controls (n = 68). Experiments were conducted in triplicate, and differences were considered statistically significant when P < 0.05 (two-way ANOVA and paired t tests). (E–F) Chromosome instability results in micronuclei formation (arrows) in interphase nuclei at P5 in Cbx2−/− (n = 76) compared with wild-type (n = 66) cells. (GH) Loss of CBX2 significantly increases the number of γH2AX foci (green, arrows) per nucleus as well as the proportion of nuclei with >10 γH2AX foci in Cbx2−/− nuclei (n = 97) at P5 compared with wild-type controls (n = 115). The arrowheads mark a micronucleus. Experiments were conducted in triplicate, and differences were considered statistically significant when P < 0.05 (paired t tests).
Figure S1.
Figure S1.
Grayscale images. Additional example images (DAPI in grayscale) of wild-type and Cbx2−/− fibroblast nuclei to Fig. 1 E.Image compilation of DAPI grayscale-only images of chromosomes in Figs. 1, 2, 3, 4, and 5.
Figure 2.
Figure 2.
Centromeric heterochromatin aberrations in Cbx2−/− metaphases. (A) Illustration of major satellite DNA-FISH signals in normal chromosomes and appearance of defects such as double strand breaks within and erosion of centromeric sequences. (B and C) Major satellite FISH demonstrates chromosome breaks at centromeric and pericentric heterochromatin domains (red) in Cbx2−/− fibroblasts (arrow) as well as presence of single chromatids lacking major satellite DNA (bold arrow) and detached chromosome fragments consisting of major satellite sequences (asterisk) in Cbx2−/− (n = 48) compared with wild-type (n = 49) metaphases. Extreme centromere erosion leads to the formation of chromosome fusions (arrowhead). Data represent the mean values ± SD of three biological replicates. (D) Quantitative centromere size measurements following major satellite FISH (red) using threshold masks (green) reveal centromere decondensation leading to (E) an increased average EqDiameter and (F) reduced sphericity in Cbx2−/− metaphase chromosomes (n = 579) as compared with wild-type chromosomes (n = 1,259). Data represent the mean values ± SD of three biological replicates. KO, knockout.
Figure 3.
Figure 3.
Large-scale rearrangements in Cbx2−/− chromosome complements. (A and B) SKY analysis results from wild-type (A) and Cbx2−/− (B) fibroblast metaphase spreads at P5. Cbx2−/− metaphases present evidence for extensive, nonrecurrent chromosomal aberrations. The representative Cbx2−/− example shows a large deletion in chromosome 3 resulting from a double strand break in band 3B proximal to the centromere (Del[3B]). The same metaphase also exhibits a translocation of a portion of chromosome 5 (break at band 5C) onto band F5 on the long arm of the X chromosome, giving rise to the formation of a derivative T(XF5;5C) chromosome. (C and D) Proportion of metaphases with different types of chromosomal aberrations in wild-type and Cbx2−/− fibroblasts at P5 (n = 30 per sample). “Other”: acentric fragments, tri-radial figures, as well as chromosome and chromatids gaps. (E) G-banded karyotype obtained through SKY analysis of Cbx2−/− fibroblast metaphases at P5. The magnification shows a chromatid break within pericentric heterochromatin on the long arm of chromosome 12.
Figure 4.
Figure 4.
High incidence of centromere recombination in Cbx2−/− fibroblasts. (A) Schematic representation of CO-FISH (red) signal appearance in normal chromosomes (left) and following C-SCEs (two signals = recombined) within minor satellite sequences. (B and C) In Cbx2−/− chromosomes (n = 1,416), C-SCEs occurred with significantly increased frequency as indicated by double FISH signals (B, arrowheads; (C) and an increased number of minor satellite signals per chromosome (D) compared with wild-type controls (n = 1,440), in which the vast majority of chromosomes demonstrate single CO-FISH signals (arrows in B and C). Data represent the mean values ± SD of three biological replicates. (E) SCEs within euchromatic regions of chromosomes were analyzed using BrdU immunodetection (red) in metaphase spreads after pulse-incorporation of BrdU nucleotides. The proportion of chromosomes with SCE is significantly higher in Cbx2−/− chromosomes (n = 599) compared with wild-type controls (n = 688). Characteristic patterns for absence of SCE events (“no SCE”) with sister chromatids clearly distinguishable by bright or pale staining and examples of chromosomes displaying one or two SCE (arrowheads) are shown. Data represent the mean values ± SD of three biological replicates. KO, knockout.
Figure 5.
Figure 5.
Telomere dysfunction in Cbx2−/− fibroblasts. (A) Schematic representation of Telomere DNA-FISH signals (green) in mouse chromosomes. The position of n = 4 telomeres (arrows) per chromosome in wild-type chromosomes is indicated. Telomere-FISH analysis of P5 mitotic metaphase spreads indicates increased frequency of proximal (bold arrows) and distal (asterisk) telomere breaks in Cbx2−/− chromosomes compared with wild-type controls. The arrowhead indicates a Robertsonian-like centromere–centromere fusion in a Cbx2−/− metaphase. (B) SR-SIM imaging and quantitative measurement analysis of telomere volume, sphericity, and fluorescence intensity in wild-type (n = 239) and Cbx2−/− (n = 341) chromosomes. Data represent the mean values ± SD of three biological replicates. (C) Representative individual telomeres are shown following 3D surface rendering analysis using Imaris, including color scale–indicated volume differences. (D) Absolute telomere length quantification of wild-type and Cbx2−/− MEFs. Data represent the mean values ± SD of three independent biological replicates. (E) Schematic representation of telomere orientation-FISH signal appearance in normal and in chromosomes with occurrence of T-SCEs (more than two signals per chromosome = recombined) or double strand breaks (dsBreaks, less than two signals). Representative chromosomes of wild-type Cbx2 fibroblasts showing a single telomere signal (green) per chromatid (arrows). Significantly increased rates of T-SCEs (arrowheads) and signal-free chromatids as a result of chromosome breaks (bold arrows) in Cbx2−/− chromosomes (n = 968) compared with wild-type controls (n = 1,021). Data represent the mean values ± SD of three independent biological replicates.
Figure 6.
Figure 6.
Altered nuclear architecture and distention of satellite DNA sequences in Cbx2−/− cells. (A) Changes in nuclear architecture in Cbx2−/− cells (n = 63) are associated with an increased nuclear area compared with wild-type control cells (n = 120) as assessed by HCA. Data represent the mean values ± SD of three biological replicates and were analyzed using Mann–Whitney tests. (B) Confocal microscopy reveals large-scale decondensation of (DAPI-bright) heterochromatin blocks in Cbx2−/− nuclei (bold arrows) compared with wild-type nuclei presenting densely packed chromocenters (thin arrows). The arrowhead indicates a micronucleus in a Cbx2−/− fibroblast. (C) SR-SIM imaging of DNA-FISH–labeled pericentric heterochromatin (green) at DAPI-bright nuclear domains (blue). Threshold masks indicate areas detected by the major satellite FISH probe, and line scan graphs depict intermittent fluorescence intensity peaks corresponding to a cross-section of the nucleus (blue line). (D and E) The proportion of the nuclear area occupied by pericentric heterochromatin (D) and the mean fluorescence intensity of these domains (E) in wild-type (n = 5) and Cbx2−/− (n = 5) nuclei. (F) SR-SIM and HCA indicate a significant reduction in Lamin B1 (green) fluorescence intensity in Cbx2−/− fibroblasts at P5 (n = 68) compared with wild-type controls (n = 123). The insets show merged images of Lamin B1 (green) and DAPI (blue). (G) Skeleton analysis revealed significantly decreased mean Lamin B1 skeleton lengths in Cbx2−/− nuclei (n = 6) compared with wild-type controls (n = 9). Images represent magnified areas of the nuclei as indicated in the insets.
Figure 7.
Figure 7.
Loss of CBX2 alters the transcriptome profile of early passage fibroblasts. (A) MA plot of DEGs between wild-type (n = 2 samples) and Cbx2−/− (n = 2 samples) fibroblasts at P2 to visualize the differences between measurements taken in wild-type and Cbx2−/− samples. Red dots = up-regulated DEGs (n = 175), blue dots = down-regulated DEGs (n = 119), and gray dots representing non-DEGs (n = 17,147). (B) Heat map of DEGs indicating log10 transformed gene expression levels. The color scale indicates up- or down-regulated gene expression. (C) Kegg pathway enrichment for up- and down-regulated genes in Cbx2−/− cells. The gene number per pathway and the Q value are indicated by size and color scales, respectively. X axis represents the rich factor. (D) GO term analysis of biological processes for up- and down-regulated genes in Cbx2−/− fibroblasts with the x axis representing the number of genes detected per respective enriched pathway. (E) Gene expression heat map of DEGs encoding TFs. (F) DEG classification by TF families. The number of differentially expressed TFs per TF family in Cbx2−/− fibroblasts is indicated in black, while the number of DEG CBX2 target genes per TF family is indicated in red. (G) Significantly up- (red) or down- (blue) regulated key transcripts in Cbx2−/− fibroblasts. Asterisks indicate that correlative changes in chromatin accessibility were observed by ATAC-seq. Known CBX2 targets in mESCs are labeled in red.
Figure S2.
Figure S2.
RNA-seq supplemental QC data and GO term classification. (A) Pearson correlation (corr) analysis between RNA-seq samples revealed strong correlation between the replicate samples of each genotype and led to the expected hierarchical clustering of the two wild-type samples and the two knockout samples, respectively. (B) A principal component analysis using an orthogonal transformation to convert a set of observations of variables into a set of values of linearly uncorrelated variables (principal components) also showed similar correlation between samples. (C) Box plot of the distribution of gene expression levels between samples, and (D) gene expression density map for all four samples indicating uniform gene expression levels. (E) The number of genes by different FPKM ranges across four samples. (F) GO classification of DEGs. Biological process (red), cellular component (blue), and molecular function (green). Coeff, coefficient; KO, knockout.
Figure 8.
Figure 8.
Loss of CBX2 induces changes in chromatin accessibility at key genomic loci in early passage MEFs. (A) The location of ATAC-seq peaks relative to genomic annotations is presented in pie charts for wild-type and Cbx2−/− fibroblasts at P2. (B) Heatmaps of tag distributions across TSS. (C) Volcano Plot of differential ATAC-seq peaks. Loci with significant loss (red, n = 238) and gain (green, n = 282) of chromatin accessibility in Cbx2−/− cells are highlighted. (D) Top-most regulated loci with gain (green bars) and loss (red bars) of accessibility in Cbx2−/− cells. (E) Comparative analysis relative to different genomic loci among all loci with gained versus all loci with lost accessibility. (F) UCSC browser view of ATAC-seq peak patterns at the Nrn1 locus. Cbx2−/− fibroblasts at P2 exhibit loss of chromatin accessibility at several CpG islands within the Nrn1 locus (red boxes). (G) Over-represented Kegg pathways identified in Cbx2−/− MEFs. (H) Top 10 over-represented GO terms.
Figure S3.
Figure S3.
ATAC-seq supplemental QC data. (A and B) Pearson correlation of peak tag numbers. Correlation analysis between ATAC-seq samples revealed strong correlation between the two replicate samples of each genotype and led to the expected hierarchical clustering of the two wild-type samples and the two knockout samples, respectively. (C) A principal component analysis using an orthogonal transformation to convert a set of observations of variables into a set of values of linearly uncorrelated variables (principal components) also showed similar correlation between samples. (D) Box plots of raw and normalized peak counts from WT and Cbx2−/− samples. (E) Peak tag numbers of merged peak regions. (F) Venn diagram of merged regions with peaks from wild-type and Cbx2−/− samples. (G) Heatmaps of tag distributions in merged peak regions and genebodies. (H) Histograms showing the distance from peak centers at merged peak regions, TSSs, and genebodies.
Figure S4.
Figure S4.
ATAC-seq genome browser views of key genomic loci. University of California Santa Cruz UCSC Genome Browser views of ATAC-seq peaks at the (A) Rbm46, (B) Als2, (C) Gm39154, (D) Gm19299, (E) 9430037G07Rik, and (F) Usp28 loci in wild-type and Cbx2−/− fibroblasts. Differential peaks are boxed in red. KO, knockout.
Figure S5.
Figure S5.
ATAC-seq genome browser views of additional key genomic loci. (A–C) University of California Santa Cruz UCSC Genome Browser views of ATAC-seq peaks at the (A) Zic1, (B) Usp2, and (C) Nkx2.9 locus in wild-type and Cbx2−/− fibroblasts. Differential peaks are boxed in red. (D) UCSC Genome Browser view of ATAC-seq peaks at the Cbx2 locus in wild-type and Cbx2−/− fibroblasts. Absence of peaks in Cbx2−/− cells at this locus is due to the targeting strategy used for generating the null allele. Cbx2 targeting strategy adapted from Coré et al. (1997). KO, knockout.
Figure 9.
Figure 9.
Integrative ATAC-seq/RNA-seq analysis. (A) Venn diagram illustrating correlative changes in chromatin accessibility and gene expression in Cbx2−/− fibroblasts. DE, differentially expressed. (B) Loci with significant correlation in ATAC-seq and RNA-seq peaks. (C) Track alignment for ATAC-seq and RNA-seq tracks at the Nrn1 locus. (D) Track alignment for ATAC-seq and RNA-seq tracks at the TSS of the Rbm46 locus. The orange bracket indicates differential ATAC-seq peaks.

References

    1. Aguilo F., Zhou M.M., and Walsh M.J.. 2011. Long noncoding RNA, polycomb, and the ghosts haunting INK4b-ARF-INK4a expression. Cancer Res. 71:5365–5369. 10.1158/0008-5472.CAN-10-4379 - DOI - PMC - PubMed
    1. Bailey S.M., Williams E.S., Cornforth M.N., and Goodwin E.H.. 2010. Chromosome Orientation fluorescence in situ hybridization or strand-specific FISH. Methods Mol. Biol. 659:173–183. 10.1007/978-1-60761-789-1_12 - DOI - PubMed
    1. Bastians H. 2015. Causes of Chromosomal Instability. Recent Results Cancer Res. 200:95–113. 10.1007/978-3-319-20291-4_5 - DOI - PubMed
    1. Baumann C., and De La Fuente R.. 2011. Role of polycomb group protein cbx2/m33 in meiosis onset and maintenance of chromosome stability in the Mammalian germline. Genes (Basel). 2:59–80. 10.3390/genes2010059 - DOI - PMC - PubMed
    1. Baumann C., Viveiros M.M., and De La Fuente R.. 2010. Loss of maternal ATRX results in centromere instability and aneuploidy in the mammalian oocyte and pre-implantation embryo. PLoS Genet. 6 e1001137 10.1371/journal.pgen.1001137 - DOI - PMC - PubMed

Publication types