

How Did Distribution Patterns of Particulate Matter Air Pollution (PM2.5 and PM10) Change in China during the COVID-19 Outbreak: A Spatiotemporal Investigation at Chinese City-Level
- PMID: 32872261
- PMCID: PMC7503249
- DOI: 10.3390/ijerph17176274
How Did Distribution Patterns of Particulate Matter Air Pollution (PM2.5 and PM10) Change in China during the COVID-19 Outbreak: A Spatiotemporal Investigation at Chinese City-Level
Abstract
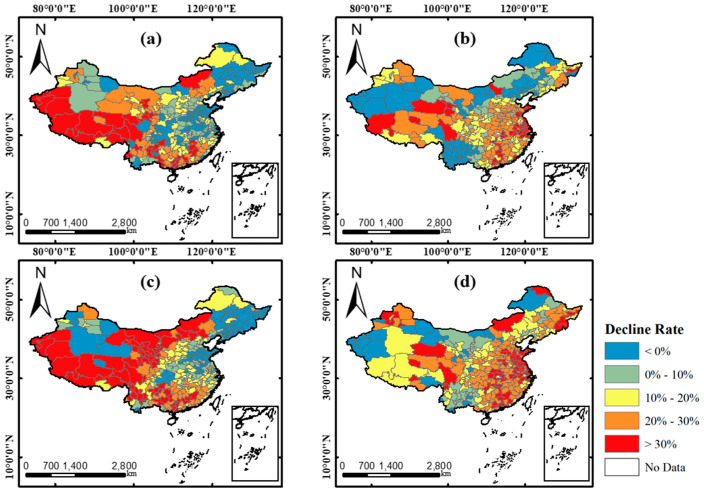
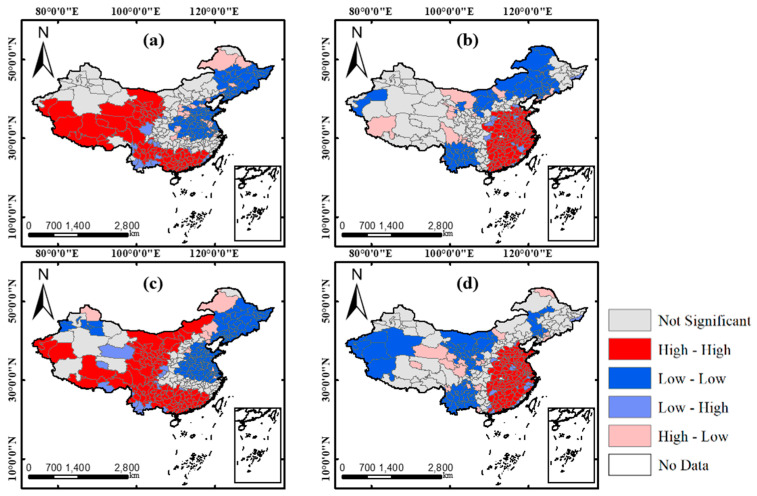
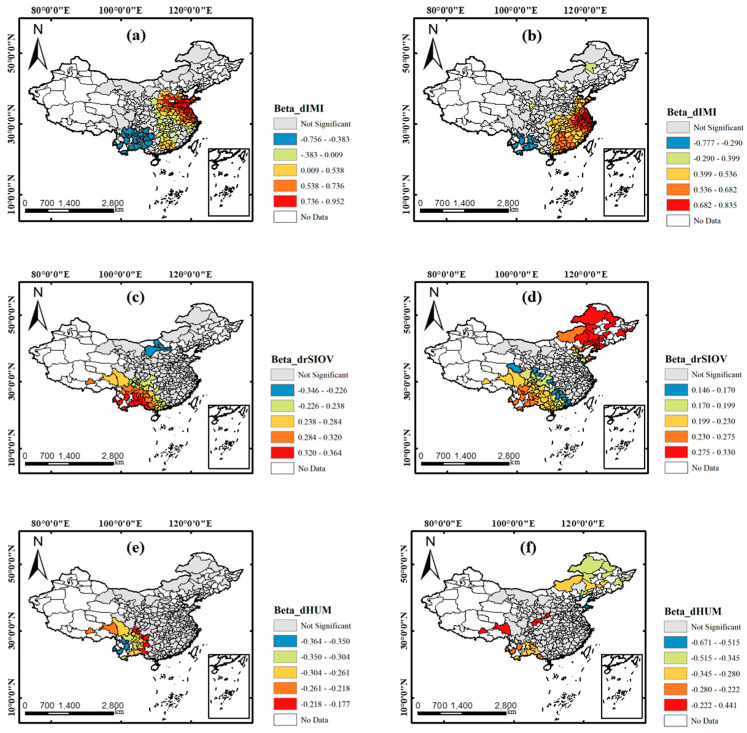
Due to the suspension of traffic mobility and industrial activities during the COVID-19, particulate matter (PM) pollution has decreased in China. However, rarely have research studies discussed the spatiotemporal pattern of this change and related influencing factors at city-scale across the nation. In this research, the clustering patterns of the decline rates of PM2.5 and PM10 during the period from 20 January to 8 April in 2020, compared with the same period of 2019, were investigated using spatial autocorrelation analysis. Four meteorological factors and two socioeconomic factors, i.e., the decline of intra-city mobility intensity (dIMI) representing the effect of traffic mobility and the decline rates of the secondary industrial output values (drSIOV), were adopted in the regression analysis. Then, multi-scale geographically weighted regression (MGWR), a model allowing the particular processing scale for each independent variable, was applied for investigating the relationship between PM pollution reductions and influencing factors. For comparison, ordinary least square (OLS) regression and the classic geographically weighted regression (GWR) were also performed. The research found that there were 16% and 20% reduction of PM2.5 and PM10 concentration across China and significant PM pollution mitigation in central, east, and south regions of China. As for the regression analysis results, MGWR outperformed the other two models, with R2 of 0.711 and 0.732 for PM2.5 and PM10, respectively. The results of MGWR revealed that the two socioeconomic factors had more significant impacts than meteorological factors. It showed that the reduction of traffic mobility caused more relative declines of PM2.5 in east China (e.g., cities in Jiangsu), while it caused more relative declines of PM10 in central China (e.g., cities in Henan). The reduction of industrial operation had a strong relationship with the PM10 drop in northeast China. The results are crucial for understanding how the decline pattern of PM pollution varied spatially during the COVID-19 outbreak, and it also provides a good reference for air pollution control in the future.
Keywords: COVID-19; PM pollution; influencing factors; multi-scale geographically weighted regression (MGWR); spatial correlation analysis; spatiotemporal patterns.
Conflict of interest statement
The authors declare no conflict of interest.
Figures
References
-
- Xu B., Lin B. Regional differences of pollution emissions in China: Contributing factors and mitigation strategies. J. Clean. Prod. 2016;112:1454–1463. doi: 10.1016/j.jclepro.2015.03.067. - DOI
-
- Yan D., Lei Y., Shi Y., Zhu Q., Li L., Zhang Z. Evolution of the spatiotemporal pattern of PM2.5 concentrations in China—A case study from the Beijing-Tianjin-Hebei region. Atmos. Environ. 2018;183:225–233. doi: 10.1016/j.atmosenv.2018.03.041. - DOI
Publication types
MeSH terms
Substances
Grants and funding
LinkOut - more resources
Full Text Sources
Miscellaneous
