Review
. 2020 Aug 30;21(17):6274.
doi: 10.3390/ijms21176274.

Proteomics and Metabolomics Approaches towards a Functional Insight onto AUTISM Spectrum Disorders: Phenotype Stratification and Biomarker Discovery

Affiliations
Review

Proteomics and Metabolomics Approaches towards a Functional Insight onto AUTISM Spectrum Disorders: Phenotype Stratification and Biomarker Discovery

Maria Vittoria Ristori et al. Int J Mol Sci. .

Abstract

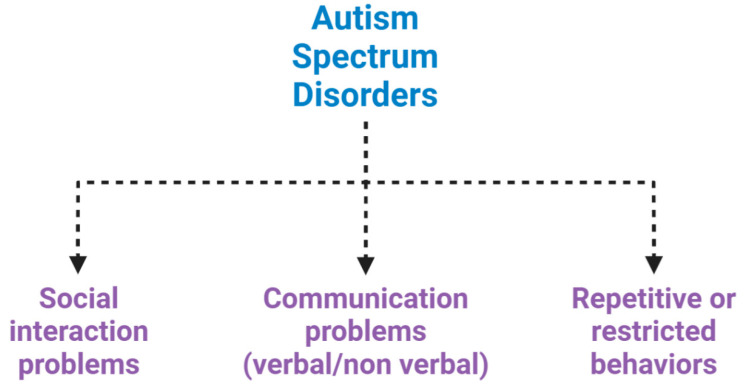
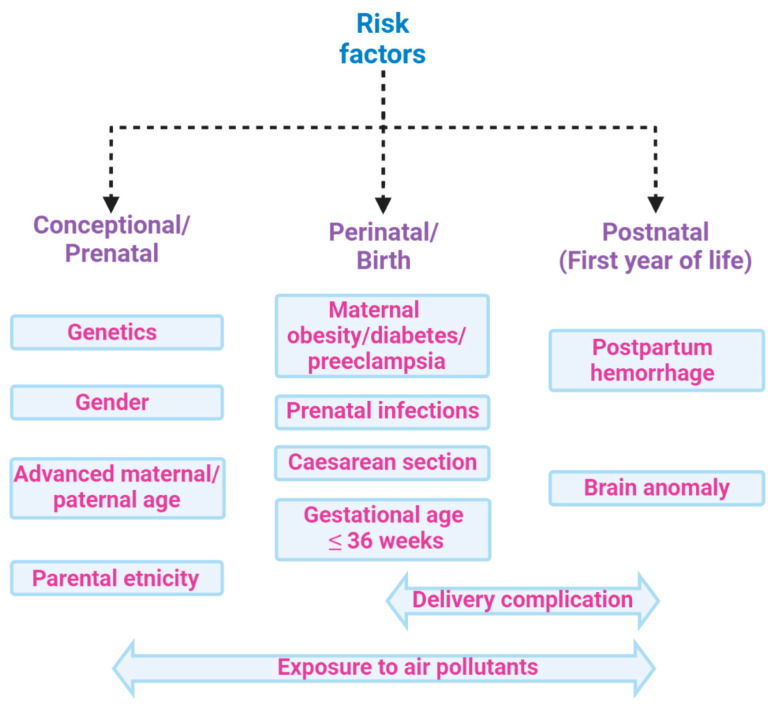
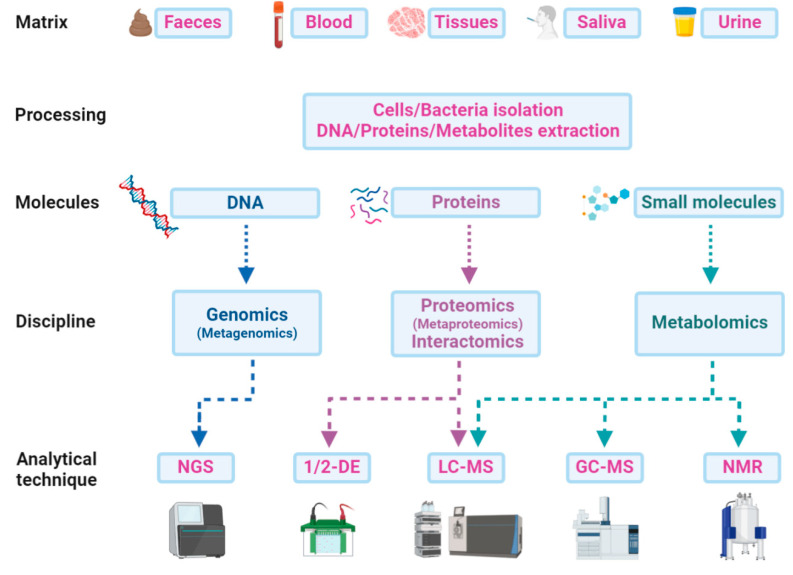
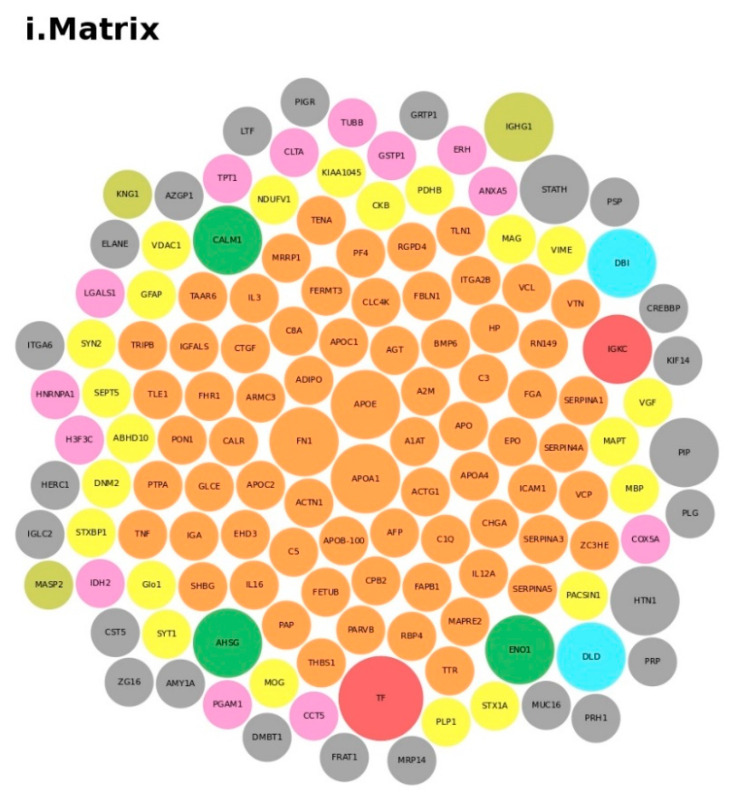
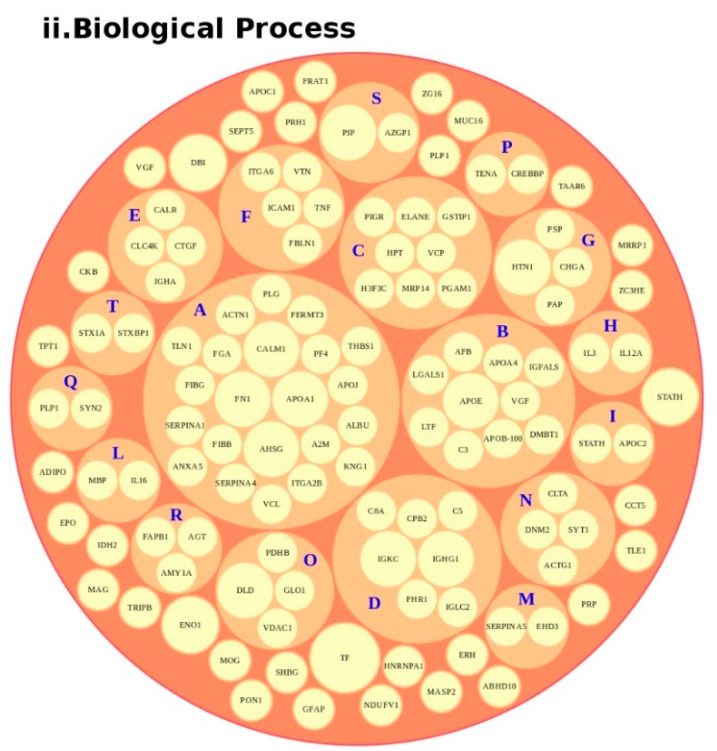
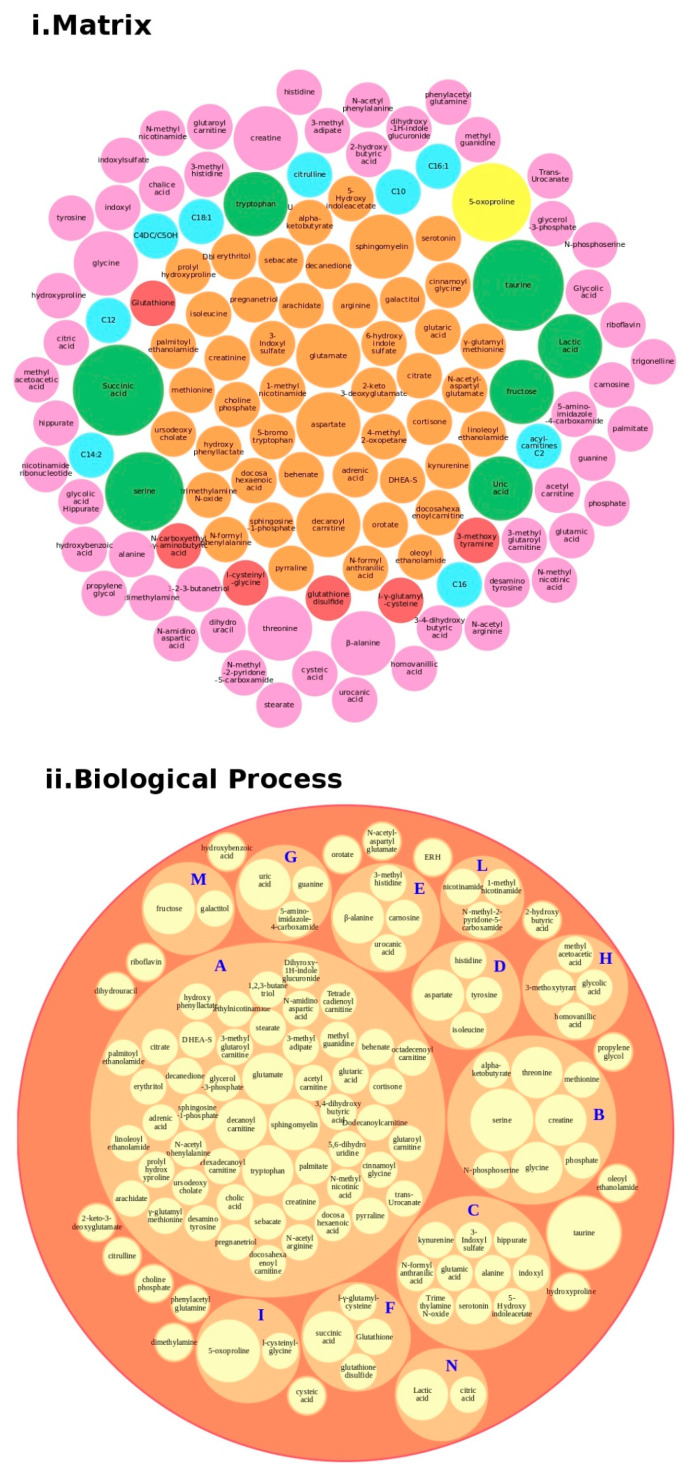
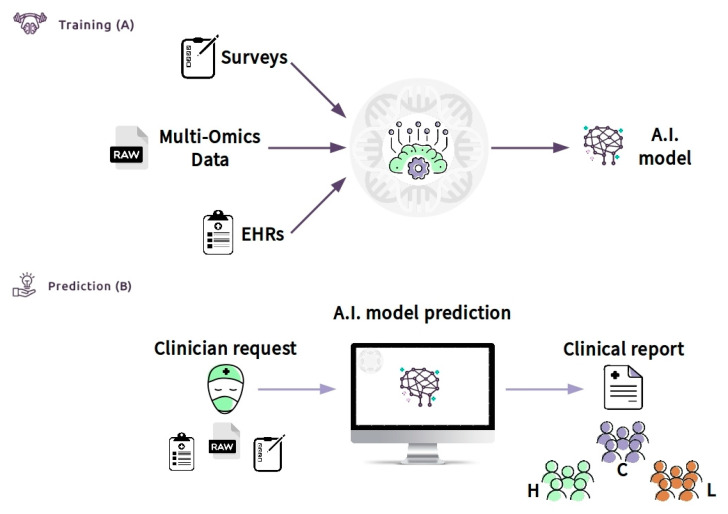
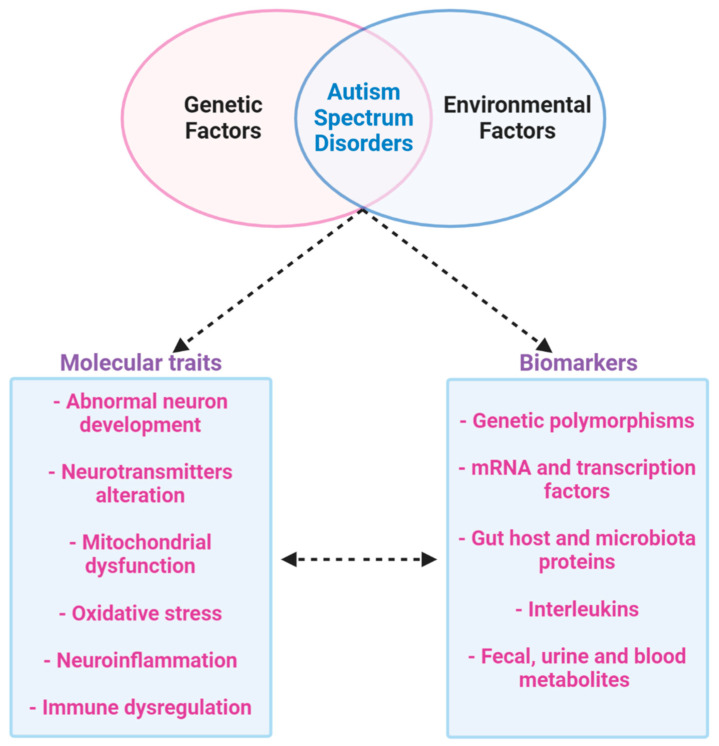
Autism spectrum disorders (ASDs) are neurodevelopmental disorders characterized by behavioral alterations and currently affect about 1% of children. Significant genetic factors and mechanisms underline the causation of ASD. Indeed, many affected individuals are diagnosed with chromosomal abnormalities, submicroscopic deletions or duplications, single-gene disorders or variants. However, a range of metabolic abnormalities has been highlighted in many patients, by identifying biofluid metabolome and proteome profiles potentially usable as ASD biomarkers. Indeed, next-generation sequencing and other omics platforms, including proteomics and metabolomics, have uncovered early age disease biomarkers which may lead to novel diagnostic tools and treatment targets that may vary from patient to patient depending on the specific genomic and other omics findings. The progressive identification of new proteins and metabolites acting as biomarker candidates, combined with patient genetic and clinical data and environmental factors, including microbiota, would bring us towards advanced clinical decision support systems (CDSSs) assisted by machine learning models for advanced ASD-personalized medicine. Herein, we will discuss novel computational solutions to evaluate new proteome and metabolome ASD biomarker candidates, in terms of their recurrence in the reviewed literature and laboratory medicine feasibility. Moreover, the way to exploit CDSS, performed by artificial intelligence, is presented as an effective tool to integrate omics data to electronic health/medical records (EHR/EMR), hopefully acting as added value in the near future for the clinical management of ASD.

Keywords: autism spectrum disorders (ASDs); clinical decision support systems (CDSSs); disease biomarkers; interactomics; metabolomics; proteomics.


Conflict of interest statement

The authors declare no conflict of interest.

Figures

Figure 1
Figure 1
Neuropsychiatric features of autism spectrum disorder (ASD). ASD is characterized by impairments in social interaction, difficulty in adapting behaviour in various social contexts, or lack of interest in peers; communication problems, such as difficulty making eye contact, facial expressions, body postures, and difficulty understanding or using the gestures that regulate interaction with others; and restricted or repetitive behaviours, such as rituals that are conducted with a rigid manner or movements.
Figure 2
Figure 2
Risk factors associated with ASD: ASD is a multifactorial condition characterized by genetic and environmental factors, including prenatal and postnatal factors that increase the risk of disease. Among the main factors, genetic predisposition, parents’ age, and exposures during pregnancy to air pollutants have been associated with poor cognitive outcomes in the perinatal age. Moreover, delivery complications or postpartum haemorrhage might also increase the risk of ASD. All these factors, globally constituting the exposome, may contribute to ASD, hence hampering the search for single biomarkers of the disease.
Figure 3
Figure 3
Scheme of the paths from matrices to analytical techniques in a multi-omics approach: An integrative approach could be a new strategy for ASD deep profiling, which combines data from genome sequencing (next-generation sequencing—NGS) with those from proteomics and metabolomics by one or two-dimensional gel electrophoresis (1/2-DE), liquid-chromatography and gas-chromatography mass spectrometry (LC-MS or GC-MS), or even from metabolomics data obtained by nuclear magnetic resonance (NMR) experiments.
Figure 4
Figure 4
Protein analysis as a tool for the decision support system (DSS). In box (i), we grouped the proteins highlighted in Table 1 and Table S1 according to the matrix in which the proteins were studied, such as blood (orange), blood and urine (lawn green), brain (red), dried blood (brown), urine (pink), and brain biopsies, urine and blood (lilac). The size of the bubbles indicates the number of times the protein was found in that matrix in the different studies taken into consideration. In box (ii), we analyzed the data for the biological process and clustered the protein. Legend code: (A) platelet degranulation (GO:0002576); (B) cellular protein metabolic process (GO:0044267); (C) neutrophil degranulation (GO:0043312); (D) regulation of complement activation (GO:0030449); (E) receptor-mediated endocytosis (GO:0006898); (F) extracellular matrix organization (GO:0030198); (G) antimicrobial humoral response (GO:0019730); (H) cytokine-mediated signaling pathway (GO:0019221); (I) retinoid metabolic process (GO:0001523); (L) immune response (GO:0006955); (M) blood coagulation (GO:0007596); (N) membrane organization (GO:0061024); (O) pyruvate metabolic process (GO:0006090); (P) signal transduction (GO:0007165); (Q) chemical synaptic transmission (GO:0007268); (R) regulation of lipid metabolic process (GO:0019216); (S) transmembrane transport (GO:0055085); (T) glutamate secretion (GO:0014047).
Figure 4
Figure 4
Protein analysis as a tool for the decision support system (DSS). In box (i), we grouped the proteins highlighted in Table 1 and Table S1 according to the matrix in which the proteins were studied, such as blood (orange), blood and urine (lawn green), brain (red), dried blood (brown), urine (pink), and brain biopsies, urine and blood (lilac). The size of the bubbles indicates the number of times the protein was found in that matrix in the different studies taken into consideration. In box (ii), we analyzed the data for the biological process and clustered the protein. Legend code: (A) platelet degranulation (GO:0002576); (B) cellular protein metabolic process (GO:0044267); (C) neutrophil degranulation (GO:0043312); (D) regulation of complement activation (GO:0030449); (E) receptor-mediated endocytosis (GO:0006898); (F) extracellular matrix organization (GO:0030198); (G) antimicrobial humoral response (GO:0019730); (H) cytokine-mediated signaling pathway (GO:0019221); (I) retinoid metabolic process (GO:0001523); (L) immune response (GO:0006955); (M) blood coagulation (GO:0007596); (N) membrane organization (GO:0061024); (O) pyruvate metabolic process (GO:0006090); (P) signal transduction (GO:0007165); (Q) chemical synaptic transmission (GO:0007268); (R) regulation of lipid metabolic process (GO:0019216); (S) transmembrane transport (GO:0055085); (T) glutamate secretion (GO:0014047).
Figure 5
Figure 5
Metabolites analysis as a tool for the decision support system (DSS). In box (i), we grouped the metabolites highlighted in Table 2 and Table S1 according to the matrix in which the metabolites were studied, such as blood (orange), blood and urine (lawn green), brain (red), dried blood (brown), urine (pink), and brain, urine and blood (lilac). The size of the bubbles indicates the number of times the metabolites were found in that matrix in the different studies taken into consideration. We analyzed the data for the biological process (box (ii) and clustered the metabolites. Legend code: A: Lipid Metabolism Pathway; B: Glycine and Serine Metabolism; C: Tryptophan Metabolism; D: Transcription/Translation; E: Histidine Metabolism; F: Glutamate Metabolism; G: Thioguanine Action Pathway; H: Tyrosine Metabolism; I: Glutathione Metabolism; L: Nicotinate and Nicotinamide Metabolism; M: Galactose metabolism; N: Glutaminolysis and Cancer.
Figure 6
Figure 6
Clinical decision support system (CDSS) as a new approach to ASD children to screen and improve the age of diagnosis: Box (A) (training) shows the flowchart including all data used (survey, such as Child Health Improvement through Computer Automation system (CHICA), omics data and electronic medical records (EHR)) by machine learning model to classify patients. Once the model has been constructed with good accuracy, the clinician (box (B)) (prediction) will upload the patient data. An A.I. model will predict the class with an actionable result summarized in the clinical report. The result will generate subgroups based on the patient’s features, for example, high functioning (H), low functioning (L), and control group (C). This system might be used by clinicians to improve early diagnosis because it provides significant information about the features of the ASD patient.
Figure 7
Figure 7
Multi-omics approach to ASD. ASD is a multifactor disease that includes genetic and environmental factors. The phenotype of ASD determines abnormal neurodevelopment with alteration in neurotransmitters. Furthermore, ASD is characterized by mitochondrial dysfunction, oxidative stress, inflammation and abnormal immune regulation. All of these dysfunctions produce possible biomarkers that could be identified by a new multi-omics approach to studying ASD.

References

    1. Nomi J.S., Uddin L.Q. Developmental changes in large-scale network connectivity in autism. Neuroimage Clin. 2015;7:732–741. doi: 10.1016/j.nicl.2015.02.024. - DOI - PMC - PubMed
    1. Uddin L.Q., Supekar K., Menon V. Reconceptualizing functional brain connectivity in autism from a developmental perspective. Front. Hum. Neurosci. 2013;7:458. doi: 10.3389/fnhum.2013.00458. - DOI - PMC - PubMed
    1. Fulceri F., Morelli M., Santocchi E., Cena H., Del Bianco T., Narzisi A., Calderoni S., Muratori F. Gastrointestinal symptoms and behavioral problems in preschoolers with Autism Spectrum Disorder. Dig. Liver Dis. 2016;48:248–254. doi: 10.1016/j.dld.2015.11.026. - DOI - PubMed
    1. Prosperi M., Santocchi E., Balboni G., Narzisi A., Bozza M., Fulceri F., Apicella F., Igliozzi R., Cosenza A., Tancredi R., et al. Behavioral phenotype of ASD preschoolers with gastrointestinal symptoms or food selectivity. J. Autism. Dev. Disord. 2017;47:3574–3588. doi: 10.1007/s10803-017-3271-5. - DOI - PubMed
    1. Erratum: Vol. 67, No. SS-6. MMWR Morb. Mortal. Wkly. Rep. 2018;67:564. doi: 10.15585/mmwr.mm6719a8. - DOI - PMC - PubMed