. 2020 Sep 1;5(5):e00539-20.
doi: 10.1128/mSystems.00539-20.

Negative Interplay between Biofilm Formation and Competence in the Environmental Strains of Bacillus subtilis

Affiliations

Negative Interplay between Biofilm Formation and Competence in the Environmental Strains of Bacillus subtilis

Qianxuan She et al. mSystems. .

Abstract

Environmental strains of the soil bacterium Bacillus subtilis have valuable applications in agriculture, industry, and biotechnology; however, environmental strains are genetically less accessible. This reduced accessibility is in sharp contrast to laboratory strains, which are well known for their natural competence, and a limitation in their applications. In this study, we observed that robust biofilm formation by environmental strains of B. subtilis greatly reduced the frequency of competent cells in the biofilm. By using model strain 3610, we revealed a cross-pathway regulation that allows biofilm matrix producers and competence-developing cells to undergo mutually exclusive cell differentiation. We further demonstrated that the competence activator ComK represses the key biofilm regulatory gene sinI by directly binding to the sinI promoter, thus blocking competent cells from simultaneously becoming matrix producers. In parallel, the biofilm activator SlrR represses competence through three distinct mechanisms involving both genetic regulation and cell morphological changes. Finally, we discuss the potential implications of limiting competence in a bacterial biofilm.IMPORTANCE The soil bacterium Bacillus subtilis can form robust biofilms, which are important for its survival in the environment. B. subtilis also exhibits natural competence. By investigating competence development in B. subtilis in situ during biofilm formation, we reveal that robust biofilm formation often greatly reduces the frequency of competent cells within the biofilm. We then characterize a cross-pathway regulation that allows cells in these two developmental events to undergo mutually exclusive cell differentiation during biofilm formation. Finally, we discuss potential biological implications of limiting competence in a bacterial biofilm.

Keywords: Bacillus subtilis; biofilm; cell differentiation; competence; environmental strains.


Figures

FIG 1
FIG 1
Working model for cross-pathway regulation between competence and biofilm in B. subtilis. Competence development is initiated when the quorum-sensing (QS) peptide derived from ComX (ComX*) is sensed by a membrane histidine kinase ComP (36). The response regulator ComA then activates an srfAA-AD operon and an embedded small gene, comS. The latter encodes a positive regulator, ComS, for the competence activator, ComK (41). ComKON cells express late competence genes, which ultimately differentiate into competent cells ready for DNA uptake. Here, we propose that ComK simultaneously and negatively regulates the biofilm pathway by repressing the key biofilm regulatory gene sinI (shown as 1). SinI antagonizes the biofilm master repressor SinR to derepress genes for the biofilm matrix production (epsA-O, tapA, etc.). Negative regulation of sinI by ComK is expected to inhibit biofilm formation. SlrR is another antagonist of SinR that forms a double-negative loop with SinR. Under biofilm-inducing conditions, sinI is activated by the developmental master regulator Spo0A in response to sensory kinases (e.g., KinC) sensing various environmental signals. Here, we also propose that the biofilm regulator SlrR negatively regulates competence development through several distinct mechanisms. First, SlrR activates matrix production, which physically blocks sensing of the quorum-sensing peptide signal ComX* (shown as 4) (49); second, SlrR-induced cell chaining may block DNA uptake since DNA uptake machinery was shown to be pole-localized (57, 58) (shown as 3); and third, SlrR negatively regulates the srfAA-AD operon and comS (shown as 2). Red arrows and blue lines represent positive and negative regulation, respectively. ComX*, a secreted QS peptide derived from ComX. Surfactin induces matrix production by a paracrine signaling mechanism (49).
FIG 2
FIG 2
B. subtilis environmental strains are strong biofilm producers but have poor competence. (A) Colony and pellicle biofilm phenotypes of seven environmental strains of B. subtilis plus strains 168 and 3610. Scale bar in the picture of the colony, 2 mm; scale bar in the picture of the pellicle, 5 mm. The scale bar in the picture of colony applies to all pictures of colonies, as does the scale bar in the picture of the pellicle. (B) Transformation efficiency of the seven environment isolates of B. subtilis plus strains 168 and 3610. The results are shown as percentages of the number of transformants relative to the total numbers of cells. Assays were performed in triplicates. Each dot represents one technical replicate. Error bars represent the standard deviations.
FIG 3
FIG 3
A small proportion of cells from the environmental strains express the late competence gene comGA. (A) Environmental strains harboring the late competence gene reporter PcomGA-gfp were grown in the competence medium (MC) to the early stationary phase. Cells were harvested and observed under fluorescence microscopy. The 168 and 3610 strains are included for comparison. Representative images are shown here. Scale bars, 10 μm. (B) Percentages of PcomGA-gfp-expressing cells relative to the total number of cells in seven different environmental strains plus strains 168 and 3610. In each bar, the three dots represent three individual data points calculated from three different images consisting of about 600 to 800 cells in total per sample. Error bars represent the standard deviations.
FIG 4
FIG 4
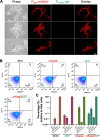
Matrix producers and competent cells are mutually exclusive in the strain 3610 biofilm. (A) Fluorescent microscopic analyses of cells collected from a B. subtilis 3610 pellicle biofilm bearing dual fluorescent reporters of PcomGA-gfp and PtapA-mKate2 (EH43). The activity of PtapA-mKate2 (cells in red) indicates expression of the key biofilm matrix operon tapA-sipW-tasA, while PcomGA-gfp reports a late competence gene comGA (cells in green). More images are available in Fig. S2 in the supplemental material. Scale bar, 10 μm. The scale bar is representative of all images in the figure. (B) Flow cytometry analyses of the above dual fluorescent reporter strain (EH43, indicated as mKate2/GFP), two single reporter strains (QS34 for PcomGA-gfp and EH41 for PtapA-mKate2, indicated as GFP and mKate2, respectively), and strain 3610 (as a gating control). The activities of PcomGA-gfp and PtapA-mKate2 were measured in GFP (y axis) and RFP (for mKate2, x axis) filters, respectively. Numbers represent the percentages of gated cells versus the total cells in the corresponding quadrant. (C) Quadrant analyses of the flow cytometry results. The percentage indicates gated cells/total cells in the corresponding quadrant. Each dot represents one biological replicate. Experiments were repeated three times. Error bars indicate the standard deviations (one dot representing the mKate2/GFP quadrant from the single reporter [EH41, shown as GFP] and one dot representing the mKate2/GFP quadrant from the double reporter [EH43, shown as mKate2/GFP] were omitted due to errors).
FIG 5
FIG 5
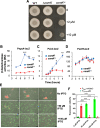
comK negatively regulates key biofilm genes. (A) Overexpression of comK impairs biofilm formation in B. subtilis. Phenotypes of the colony biofilms formed by the wild type (strain 3610), the ΔcomK mutant (YC100), and the wild-type strain harboring an IPTG-inducible copy of comK (YC142) on MSgg plates supplemented with 0, 2, or 10 μM IPTG. Scale bar, 2 mm. The scale bar is representative for all pictures in this panel. (B to D) Wild-type strains bearing both an IPTG-inducible copy of comK and one of the three biofilm gene reporters—PepsA-lacZ (B, YC160), PsinI-lacZ (C, YC159), and PsinR-lacZ (D, YC177)—were assayed for β-galactosidase activities. Cells were cultured in MSgg with shaking in the absence (comK0) or presence (comK++) of 10 μM IPTG to induce comK. Assays were done in triplicate. Error bars represent the standard deviations. The t test was applied for statistical analysis. *, P < 0.05; **, P < 0.005; ***, P < 0.0005. (E) Fluorescent microscopic analyses of the dual reporter strain (PcomGA-gfp and PtapA-mKate2) that also contains an IPTG-inducible copy of comK (EH44). Cells were grown with shaking MSgg to log phase (OD600 = 0.5), split into three fractions (one without IPTG and the other two with either 50 or 100 μM IPTG), and cultured for an additional hour before being harvested and analyzed by fluorescence microscopy. Scale bars, 10 μm. (F) Quantitative analyses of the dual reporter activities upon comK overexpression. For each IPTG concentration (0, 50, or 100 μM), the individual dots represent results from four separate images (in one biological replicate) consisting of about 600 to 800 cells in total. Error bars represent the standard deviations. A t test was used to perform statistical analysis. ***, P < 0.0005.
FIG 6
FIG 6
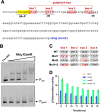
ComK directly binds to the promoter of sinI. (A) DNA sequence of the promoter region of sinI. The Spo0A∼P activation site (in yellow and underlined), the −10 and −35 motifs (underlined), and putative ComK boxes (from box 1 to 4) are highlighted (31). (B) EMSA of His6-ComK binding to the promoter of sinI. PsinI was end labeled with Cy3 dye and used as the DNA probe. Cy3-labeled PganS was used as a negative control. The far-left lanes are the control of free DNA without proteins. A decreasing gradient of 150, 60, 15, and 7.5 nM recombinant His6-ComK was applied in the lanes in the EMSA as indicated. A total of 200 pmol of fluorescent-labeled DNA probe was applied in each lane. (C) Site-directed mutagenesis of the ComK boxes in the sinI promoter is indicated. Nucleotide changes in box 1 (mut1) and box 3 (mut2) are highlighted in red. Changes in box 2 and box 4 are avoided due to their overlap with −10 and −35 promoter motifs. (D) β-Galactosidase activities of the cells with an inducible comK construct and bearing either wild-type PsinI-lacZ or the reporter fusions with indicated point mutations in the K-box (mut1, mut2, and mut1 + 2, as shown in panel C) were performed. IPTG was added at a 10 μM concentration in the media. Cells were grown with shaking in MSgg. Samples were periodically collected and assayed for β-galactosidase activities. Assays were performed at least in triplicate. Error bars represent the standard deviations.
FIG 7
FIG 7
SlrR negatively regulates competence through three distinct mechanisms. (A) Comparison of the transformation efficiency of the wild type (strain 3610) and the ΔepsH ΔtasA double mutant (YC775). The results are presented as percentages of the number of transformants relative to the total number of cells. The experiment was repeated three times. Each dot indicates one biological replicate. Error bars indicate the standard deviation. *, P < 0.05. (B) Comparison of the transformation efficiency between the seven environmental strains of B. subtilis and their respective ΔepsA-O mutants (4). Strains 168 and 3610 and the ΔepsA-O mutants of strains 168 and 3610 were also included. The results are shown as the fold changes of CFU counts during transformation comparing the ΔepsA-O mutants and the respective wild-type strains. Each dot indicates one biological replicate. Error bars indicate the standard deviations. *, P < 0.05; ***, P < 0.0005. (C) Microscopic images of an slrR-inducible strain (YC672). Cells were grown in shaking LB medium without or with the addition of 100 μM IPTG to induce slrR expression and the cell chaining phenotype. Red indicates cell membrane staining by the membrane dye FM 4-64. Scale bars, 10 μm. (D) Comparison of the transformation efficiency of the slrR-inducible strain (YC672) in the absence or presence of 100 μM IPTG. The transformation efficiency is shown as the percentages of the numbers of transformants versus the total numbers of cells. The experiment was repeated three times. Each dot represents one biological replicate. Error bars indicate the standard deviations. *, P < 0.05. (E) Fluorescence microscopic analyses of the slrR overexpression strain harboring a fluorescent reporter of PsrfAA-gfp (YC1270) in the absence or presence of IPTG to induce slrR expression. Cells were grown with shaking in MSgg to early log phase (OD600 = 0.3) and split into two fractions, one without IPTG (slrR0) and the other with 100 μM IPTG (slrR++) added to induce slrR expression for an hour before harvest and analysis of the cells. (F) Quantification of fluorescent pixel density of the cells in panel E by ImageJ (with the MicroJ plugin). More than 200 cells from each sample were randomly selected for analysis. The results are plotted indicating the difference in PsrfAA-gfp activity without or with slrR overexpression. The numbers 20.5 (slrR0) and 11.5 (slrR++) indicate the average pixel densities (AU) of the top 50% of the cells in each population. (G) qPCR analyses were performed to test the negative regulation of SlrR on srfAA-AD. Total RNA was prepared from the slrR-inducible strain (YC672) grown with (slrR++) or without (slrR0) 100 μM IPTG. Three primer pairs, two for detection of srfAA and one for detection of srfAB, were applied. Each experiment was repeated three times. Each dot indicates one biological replicate. The error bars indicate the standard deviations. *, P < 0.05; **, P < 0.005. (H) Schematic drawing showing how the biofilm regulator SlrR negatively impacts competence through three distinct mechanisms. In Fig. 7, a t test was applied for statistical analysis.

Similar articles

Cited by

References

    1. Emmert EAB, Handelsman J. 1999. Biocontrol of plant disease: a (Gram-)positive perspective. FEMS Microbiol Lett 171:1–9. doi:10.1111/j.1574-6968.1999.tb13405.x. - DOI - PubMed
    1. Vlamakis H, Chai Y, Beauregard P, Losick R, Kolter R. 2013. Sticking together: building a biofilm the Bacillus subtilis way. Nat Rev Microbiol 11:157–168. doi:10.1038/nrmicro2960. - DOI - PMC - PubMed
    1. Bais HP, Fall R, Vivanco JM. 2004. Biocontrol of Bacillus subtilis against infection of Arabidopsis roots by Pseudomonas syringae is facilitated by biofilm formation and surfactin production. Plant Physiol 134:307–319. doi:10.1104/pp.103.028712. - DOI - PMC - PubMed
    1. Chen Y, Yan F, Chai Y, Liu H, Kolter R, Losick R, Guo J-h. 2013. Biocontrol of tomato wilt disease by Bacillus subtilis isolates from natural environments depends on conserved genes mediating biofilm formation. Environ Microbiol 15:848–864. doi:10.1111/j.1462-2920.2012.02860.x. - DOI - PMC - PubMed
    1. Davey ME, O’toole GA. 2000. Microbial biofilms: from ecology to molecular genetics. Microbiol Mol Biol Rev 64:847–867. doi:10.1128/mmbr.64.4.847-867.2000. - DOI - PMC - PubMed

LinkOut - more resources