. 2020 Nov;32(11):3408-3424.
doi: 10.1105/tpc.20.00300. Epub 2020 Sep 1.

Evolutionary Variation in MADS Box Dimerization Affects Floral Development and Protein Abundance in Maize

Affiliations

Evolutionary Variation in MADS Box Dimerization Affects Floral Development and Protein Abundance in Maize

María Jazmín Abraham-Juárez et al. Plant Cell. 2020 Nov.

Abstract

Interactions between MADS box transcription factors are critical in the regulation of floral development, and shifting MADS box protein-protein interactions are predicted to have influenced floral evolution. However, precisely how evolutionary variation in protein-protein interactions affects MADS box protein function remains unknown. To assess the impact of changing MADS box protein-protein interactions on transcription factor function, we turned to the grasses, where interactions between B-class MADS box proteins vary. We tested the functional consequences of this evolutionary variability using maize (Zea mays) as an experimental system. We found that differential B-class dimerization was associated with subtle, quantitative differences in stamen shape. In contrast, differential dimerization resulted in large-scale changes to downstream gene expression. Differential dimerization also affected B-class complex composition and abundance, independent of transcript levels. This indicates that differential B-class dimerization affects protein degradation, revealing an important consequence for evolutionary variability in MADS box interactions. Our results highlight complexity in the evolution of developmental gene networks: changing protein-protein interactions could affect not only the composition of transcription factor complexes but also their degradation and persistence in developing flowers. Our results also show how coding change in a pleiotropic master regulator could have small, quantitative effects on development.


Figures

Figure 1.
Figure 1.
B-Class Dimerization Has Subtle Effects on Floral Development in Maize. (A) to (E) Stamen identity ([A]; marked with asterisks) is lost in both sts1 (B) and si1 (C) mutant flowers. At anthesis, sts1 mutant flowers complemented with either the STS1-HET (D) or STS1-HOM (E) transgene resemble wild-type flowers and each other. (F) The STS1-HOM transgene did not complement the si1 mutant phenotype. (G) to (J) Confocal microscopy showing localization of STS1-HET ([G] and [H]) and STS1-HOM ([I] and [J]) localization in developing flowers. Dotted lines in (H) and (J) indicate developing gynoecia, and numbers in top right corners indicate frequencies at which we observed the shown localization patterns. (K) to (N) Anther shape metrics during development ([K] and [L]) and at anthesis ([M] and [N]). (K) During development, anther aspect ratio (AR; anther width/anther length) was higher in STS1-HOM anthers than in STS1-HET anthers (P = 6.8e-10; left), while anther area (anther width × anther length) was not significantly different (P = 0.2592; right). We measured 39 (STS1-HET) or 28 (STS1-HOM) anthers total from three individuals of each genotype. ***Highly Significant (P < 0.01); NS, not significant. (L) Confocal images of developing anthers measured in (K). (M) At anthesis, anther aspect ratio is lower in STS1-HOM anthers than in STS1-HET anthers (P = 0.003; left), while anther area is not significantly different (P = 0.367; right). P values were calculated using Student’s t tes. *Significant (P < 0.01); NS, not significant. (N) Twenty-five randomly selected anthers from the first (bottom) and fourth (top) quartiles of anthers measured in (M), colored according to STS1 transgene genotype. We measured 10 anthers from 18 individuals of each genotype (180 anthers per genotype).
Figure 2.
Figure 2.
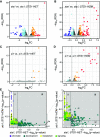
B-Class Dimerization Remodels Transcription in Developing Tassel Flowers. (A) to (D) Significantly more genes are differentially expressed in STS1-HOM versus STS1-HET inflorescences, as compared with mutant siblings. (A) and (B) Differential gene expression in sts1 mutants complemented with either the STS1-HET (A) or STS1-HOM (B) transgene, as compared with sts1 mutant siblings. (C) and (D) Differential gene expression in si1 mutants complemented with either the STS1-HET (C) or STS1-HOM (D) transgene, as compared with si1 mutant siblings. (E) GO term correlation plots comparing probabilities of GO term enrichments in STS1-HET versus STS1-HOM. GO categories related to chromatin assembly and remodeling are significantly enriched in the STS1-HOM DE gene set. The left panel shows all GO terms, and the right panel excludes highly enriched GO terms in STS1-HOM. Dot sizes are proportional to the number of genes in each enriched GO term category and colored according to which larger category they are associated with. P value cutoffs for sectors are as follows: (i) P value x > 0.25 and P value y < 0.01; (ii) 0.01 < P value x < 0.25 and P value y < 0.01; (iii) P value x < 0.01 and P value y < 0.01; (iv) P value x < 0.01 and 0.01 < P value y < 0.25; (v) P value x < 0.01 and P value x > 0.25.
Figure 3.
Figure 3.
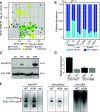
B-Class Dimerization Affects Protein Abundance and Protein Complex Assembly in Developing Tassels. (A)GO term correlation plot comparing probabilities of GO term enrichments in the STS1-HET versus STS1-HOM IP-MS data sets. GO categories related to protein modification and chromatin remodeling are enriched in both data sets. Dot sizes are proportional to the number of genes in each enriched GO term category and colored according to which larger category they are associated with. P value cutoffs for sectors are as follows: (i) P value x > 0.25 and P value y < 0.01; (ii) 0.01 < P value x < 0.25 and P value y < 0.01; (iii) P value x < 0.01 and P value y < 0.01; (iv) P value x < 0.01 and 0.01 < P value y < 0.25; (v) P value x < 0.01 and P value x > 0.25. (B) Relative abundances of MADS box proteins in the IP-MS data sets. STS1, as well as C- and E-class proteins, are higher in STS1-HOM than in STS1-HET IPs. (C) Immunoblots with anti-STS1 (top) and anti-Tubulin (bottom) also show that STS1-HET is less abundant than STS1-HOM. (D) RT-qPCR shows that STS1-HET RNA is more abundant than STS1-HOM RNA, relative to ActinSI1 RNA occurs at similar levels, relative to Actin, in both STS1-HET and STS1-HOM. (E) Immunoblots with anti-pSer and anti-ubiquitin show that STS1-HET and STS1-HOM are phosphorylated and likely in complex with ubiquitinated proteins. The same amount of immunoprecipitated STS1-HET and STS1-HOM protein was loaded for this experiment.
Figure 4.
Figure 4.
An Activation-Degradation Model for the Consequences of Differential B-Class Dimerization. (A) STS1-HET/SI1 heterodimers, in complex with other MADS box proteins, recruit chromatin remodelers like the SWI/SNF ATPase CHR126b, ultimately resulting in the upregulation of target genes. This transcription is likely halted by the proteasome-mediated degradation of MADS box complexes. (B) STS1-HOM homodimers and their MADS box partners also recruit chromatin remodelers and scaffolding proteins, resulting in upregulated transcription. However, STS1 homodimerization disrupts degradation, resulting in higher or more sustained transcription of target genes. BRM1, BRAHMA1; FRL4a, FRIGIDA-LIKE PROTEIN4a.
None

Comment in

References

    1. Abraham-Juárez M.J.(2019). Western blot in maize. Bio-101 e3257.
    1. Adhvaryu K.K., Gessaman J.D., Honda S., Lewis Z.A., Grisafi P.L., Selker E.U.(2015). The cullin-4 complex DCDC does not require E3 ubiquitin ligase elements to control heterochromatin in Neurospora crassa. Eukaryot. Cell 14: 25–28. - PMC - PubMed
    1. Alhindi T., Zhang Z., Ruelens P., Coenen H., Degroote H., Iraci N., Geuten K.(2017). Protein interaction evolution from promiscuity to specificity with reduced flexibility in an increasingly complex network. Sci. Rep. 7: 44948. - PMC - PubMed
    1. Ambrose B.A., Lerner D.R., Ciceri P., Padilla C.M., Yanofsky M.F., Schmidt R.J.(2000). Molecular and genetic analyses of the silky1 gene reveal conservation in floral organ specification between eudicots and monocots. Mol. Cell 5: 569–579. - PubMed
    1. Angenent G.C., Immink R.G.H.(2009). Combinatorial action of petunia MADS box genes and their protein products In Petunia: Evolutionary, Developmental and Physiological Genetics, Gerats T., and Strommer J., eds (New York: Springer; ), pp. 225–245.

Publication types

LinkOut - more resources