. 2020 Nov;32(11):3500-3518.
doi: 10.1105/tpc.20.00424. Epub 2020 Sep 1.

Sterile Spikelets Contribute to Yield in Sorghum and Related Grasses

Affiliations

Sterile Spikelets Contribute to Yield in Sorghum and Related Grasses

Taylor AuBuchon-Elder et al. Plant Cell. 2020 Nov.

Abstract

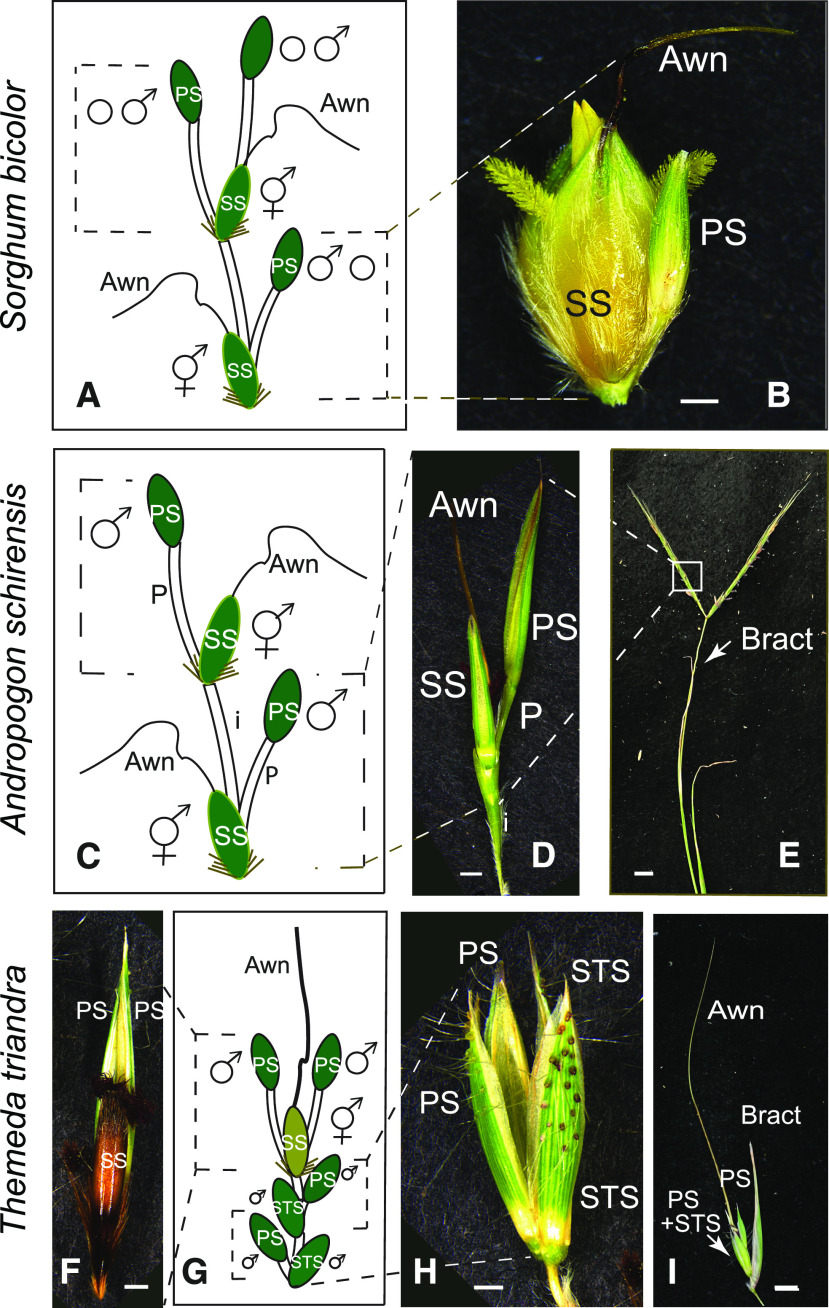
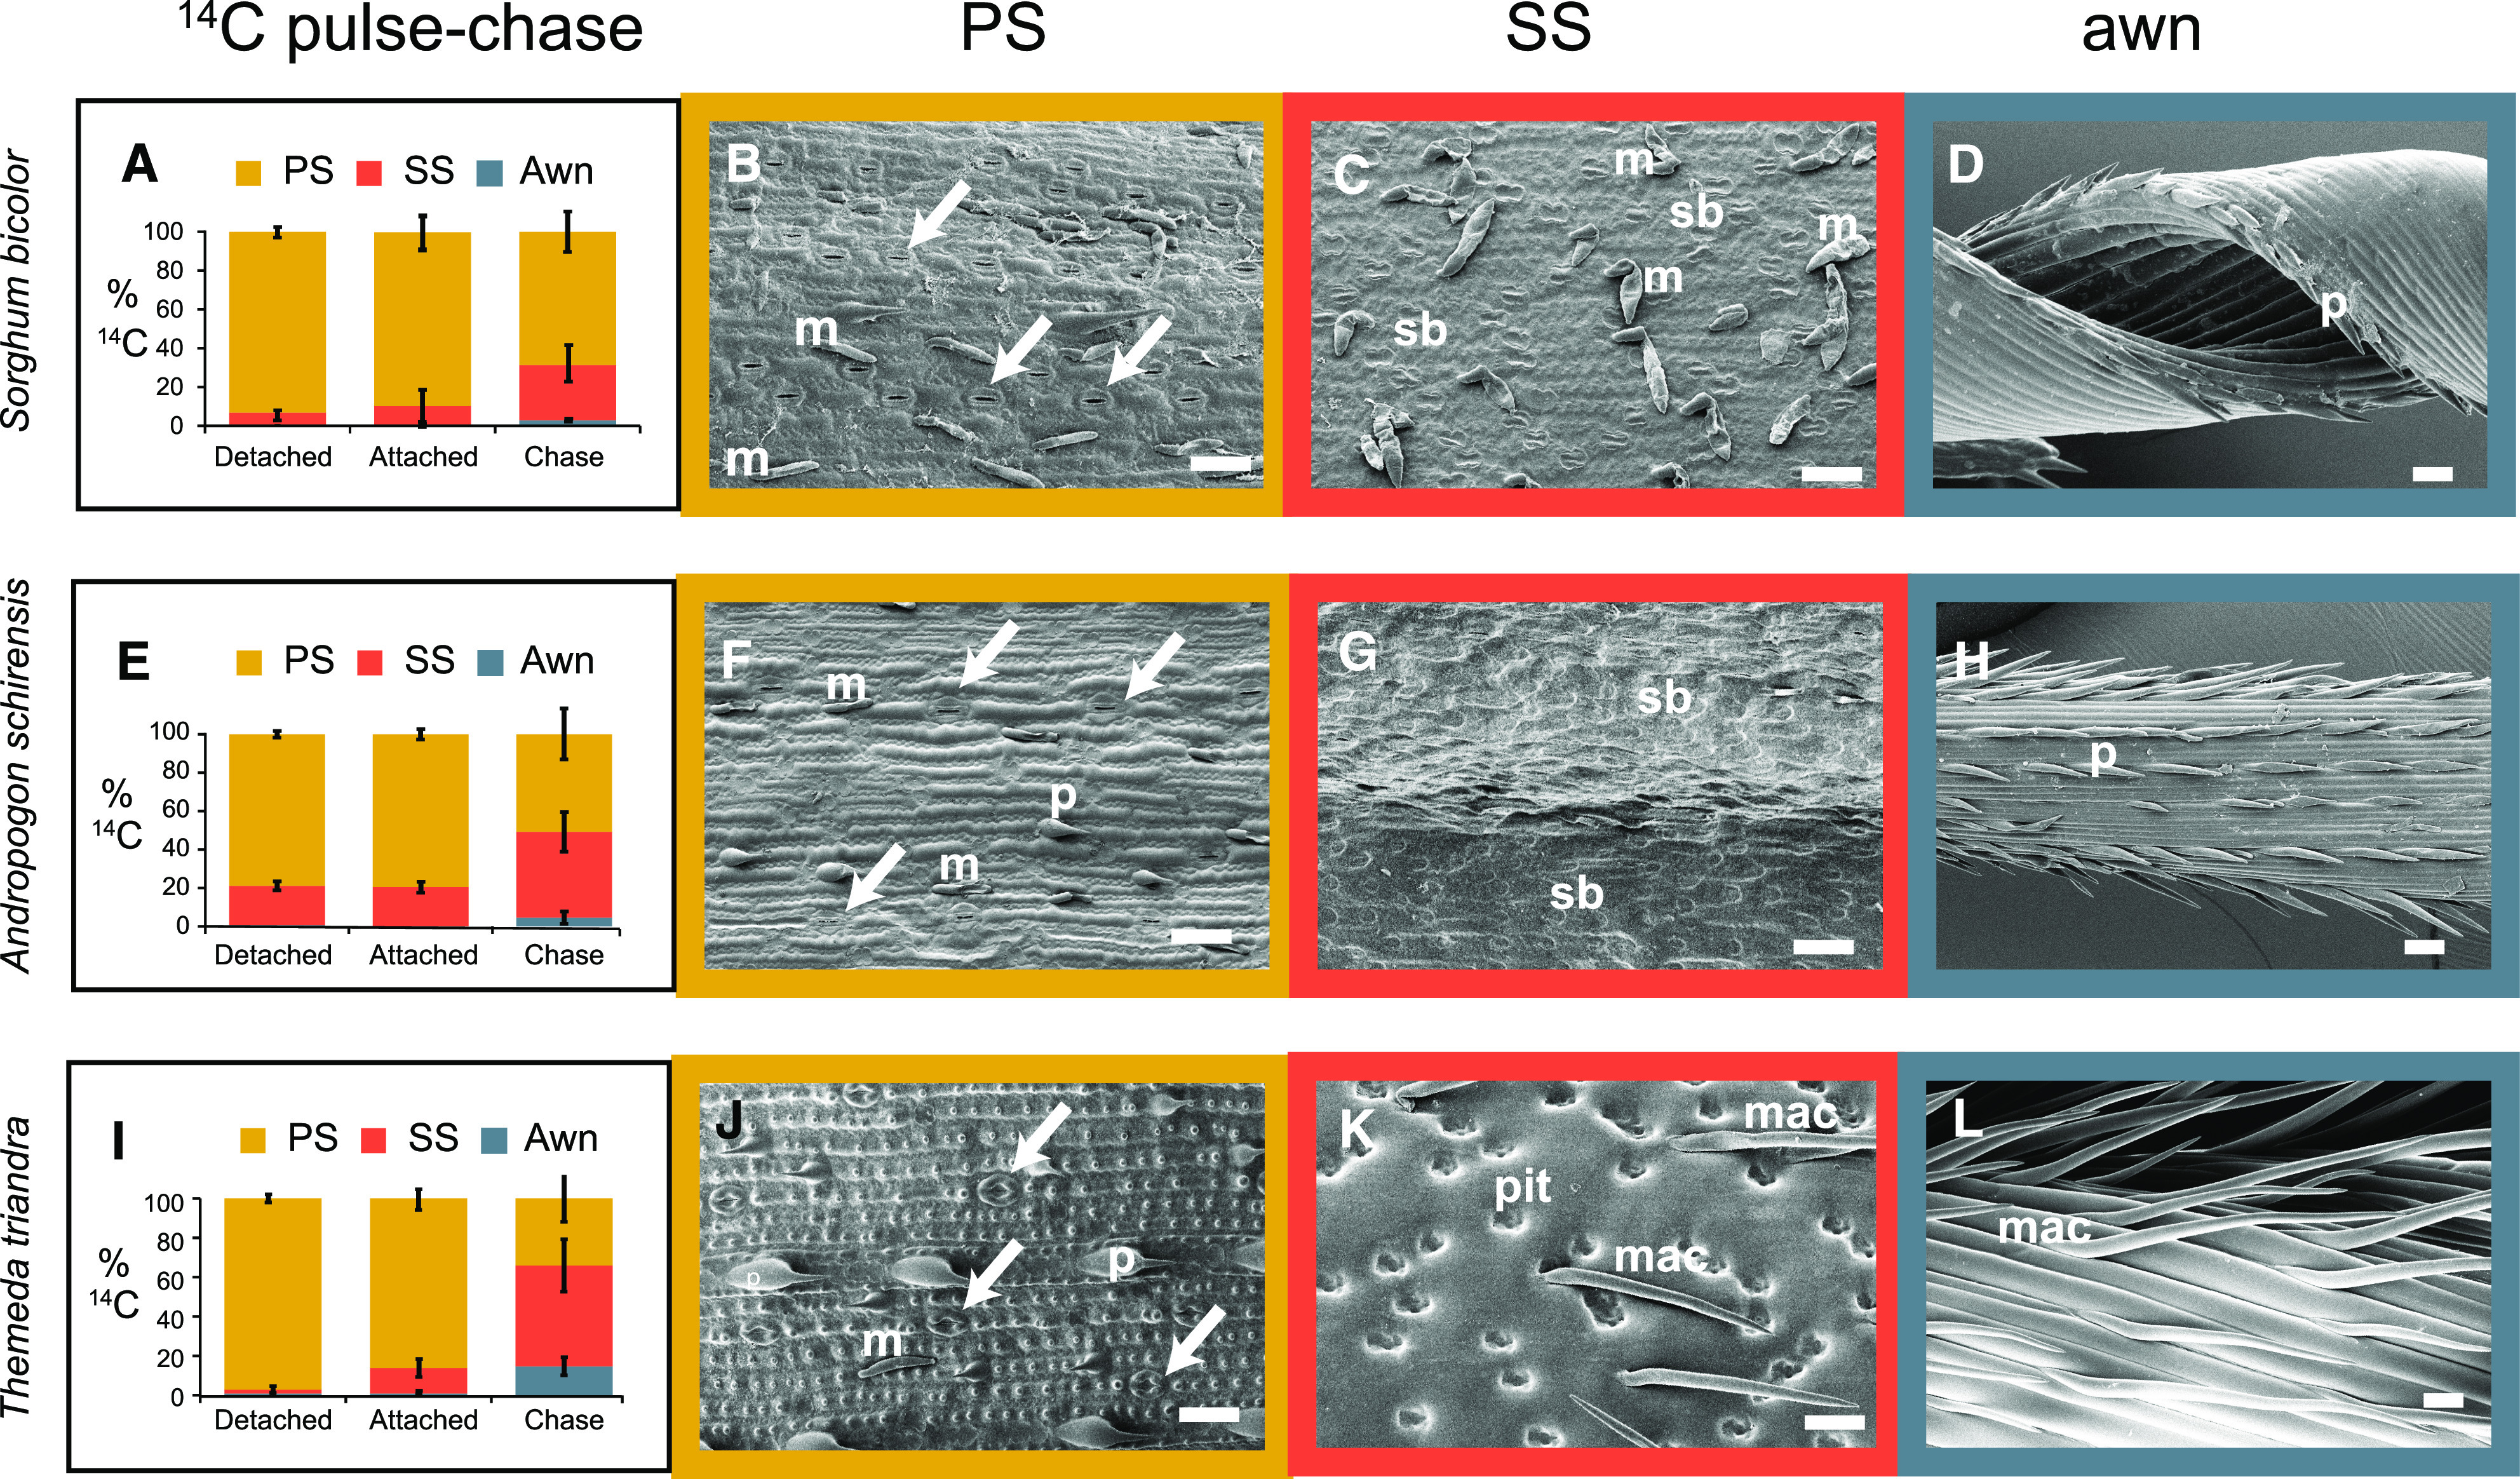
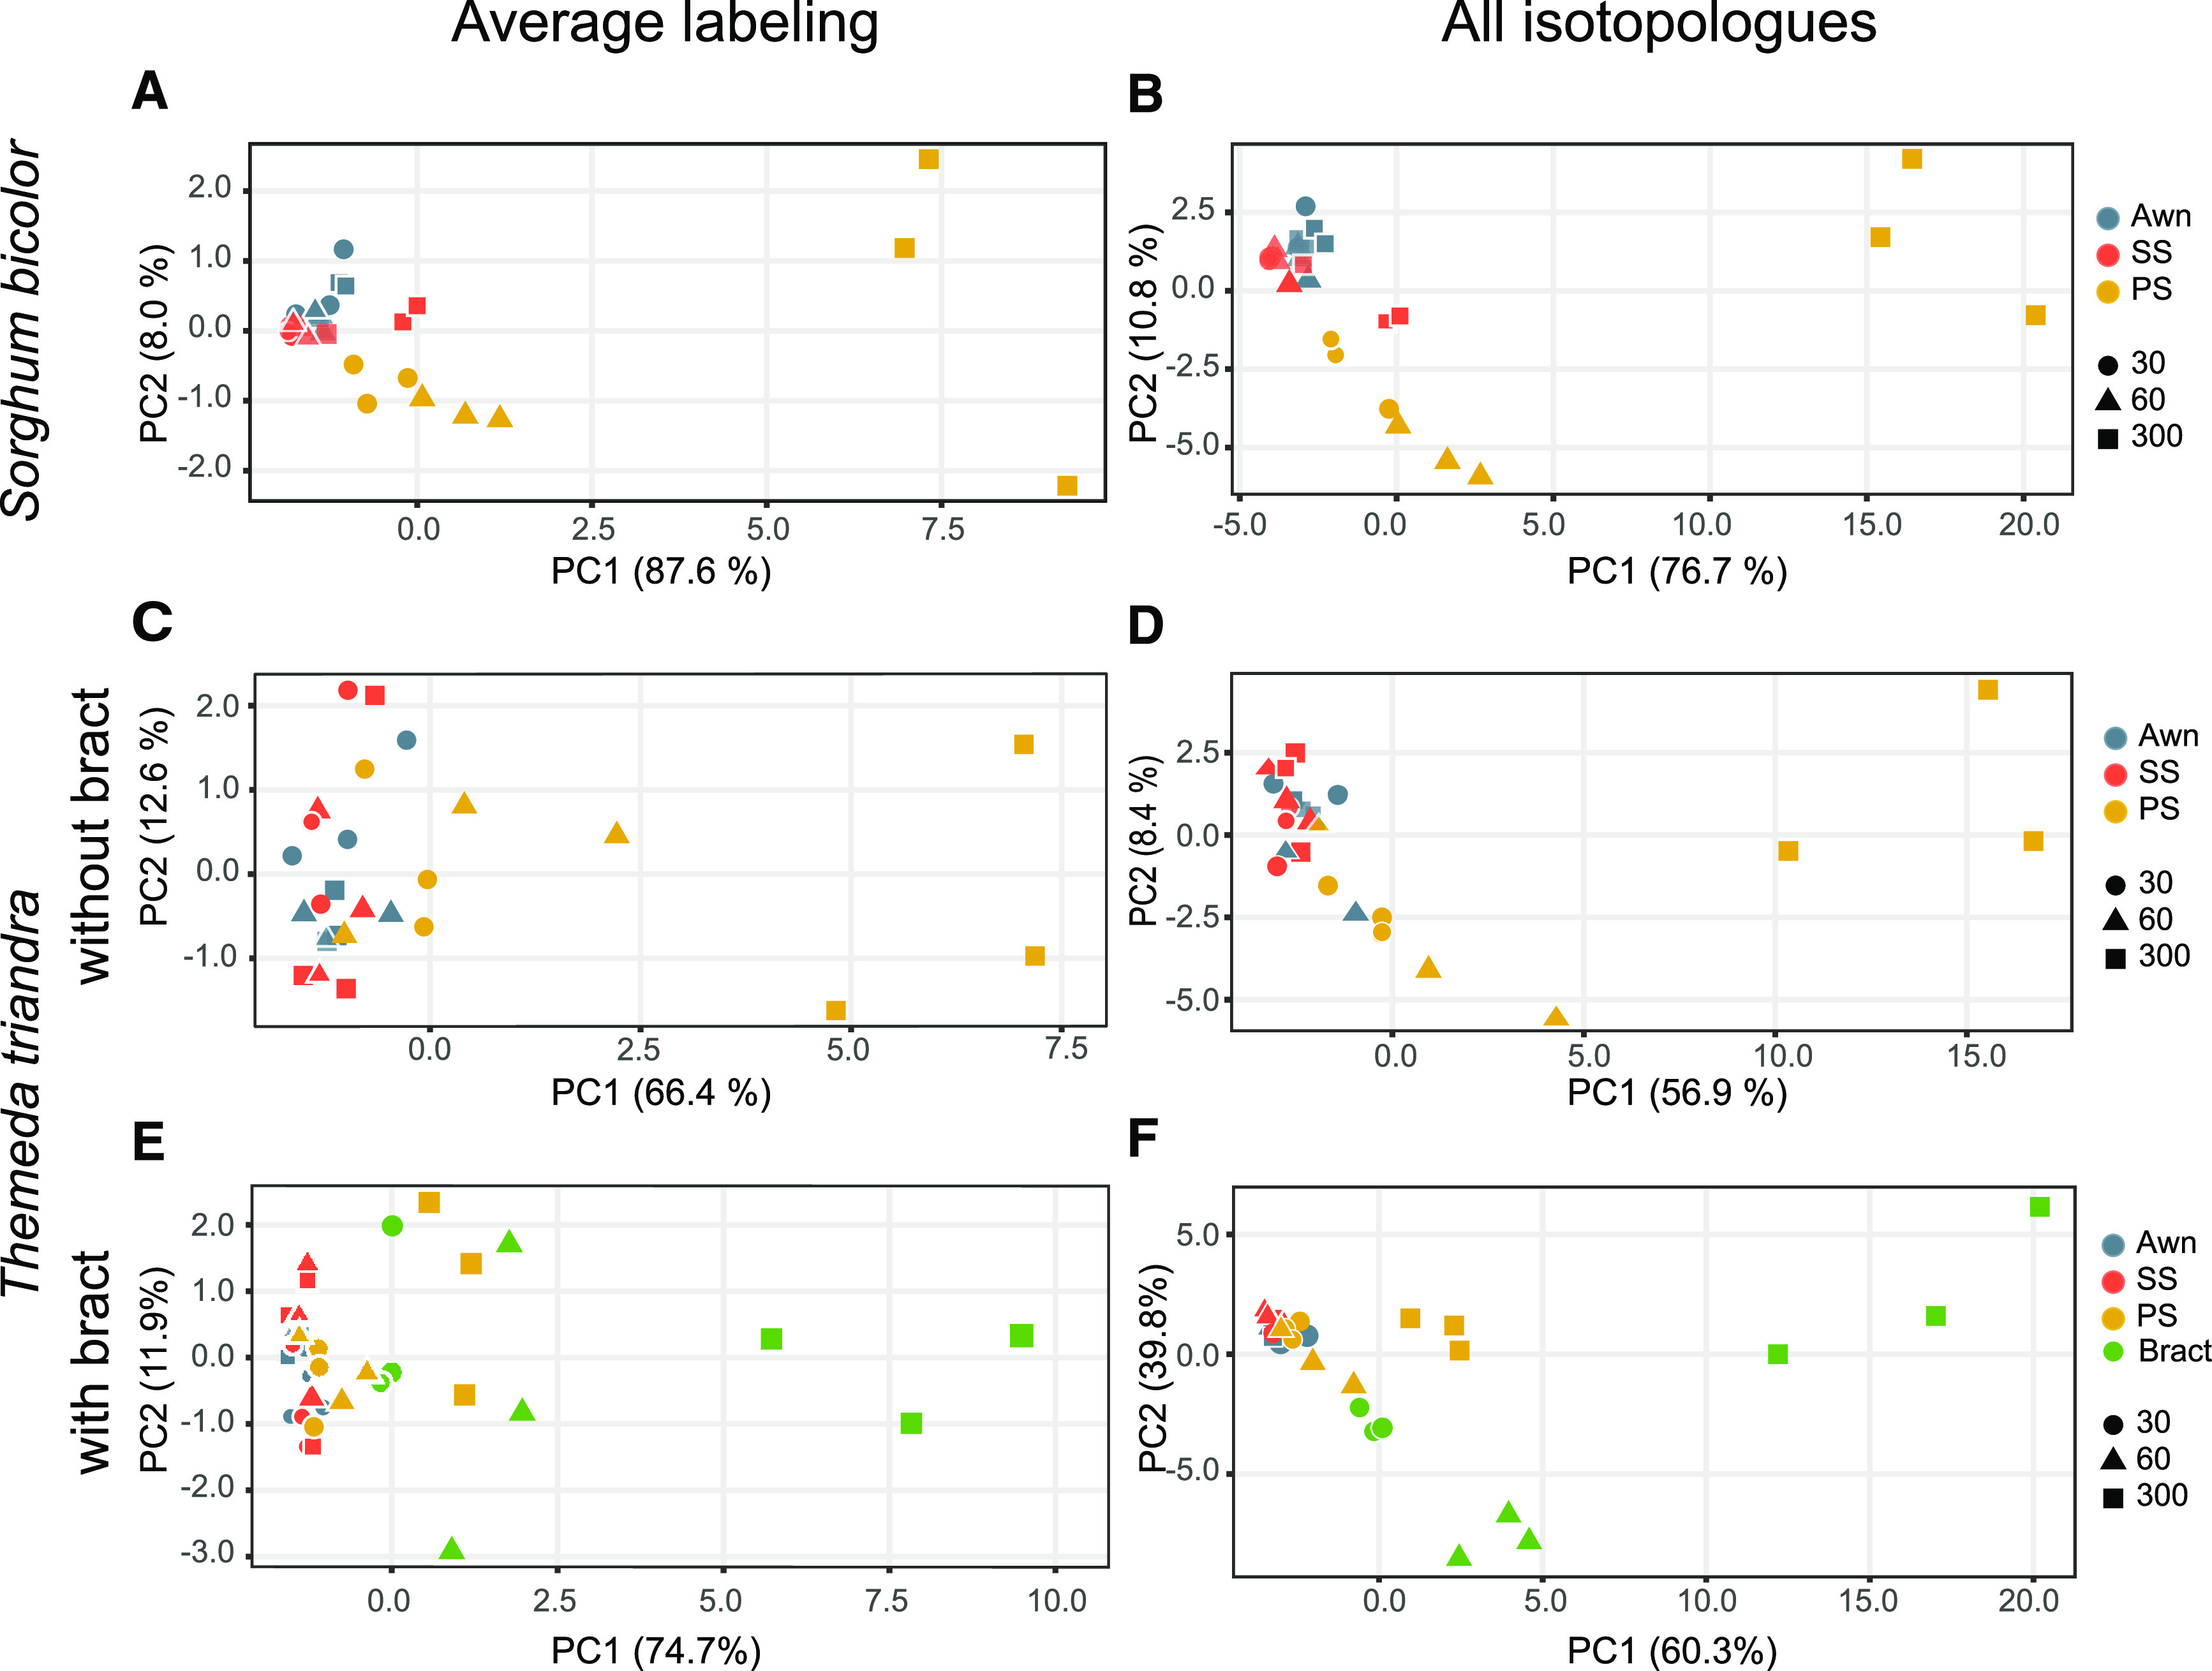
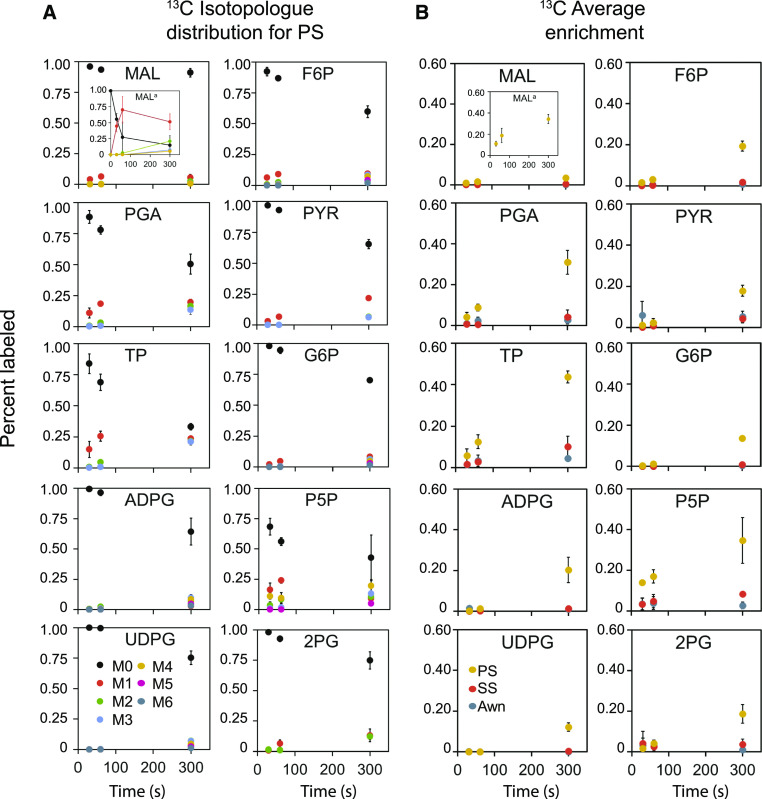
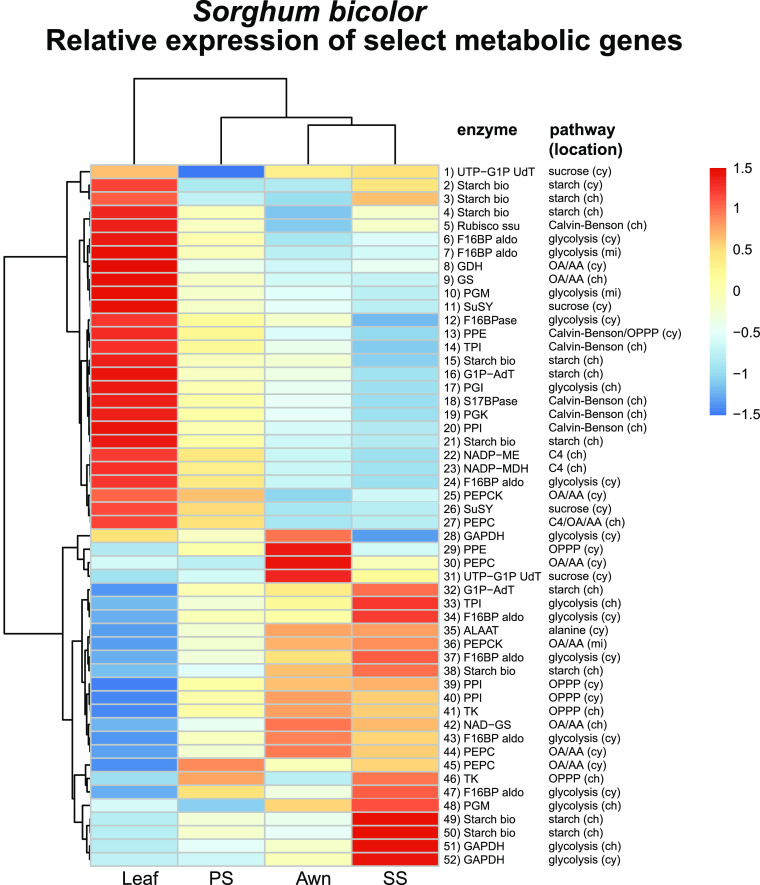
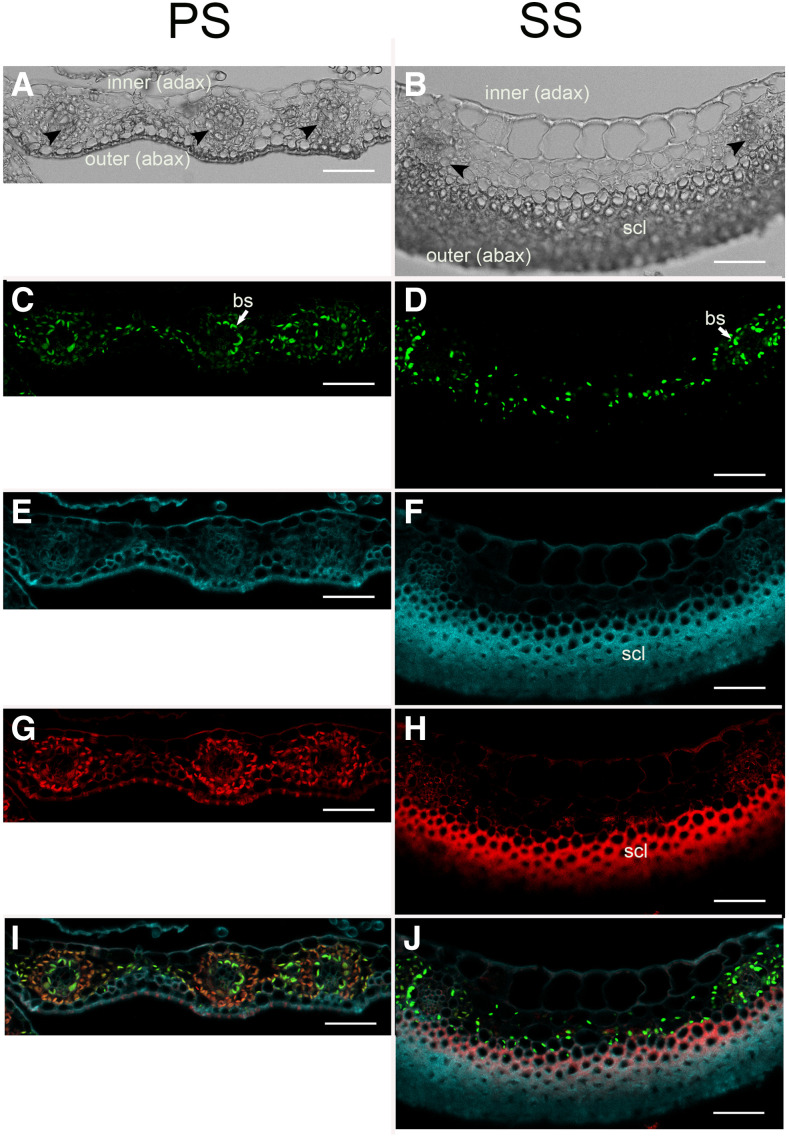
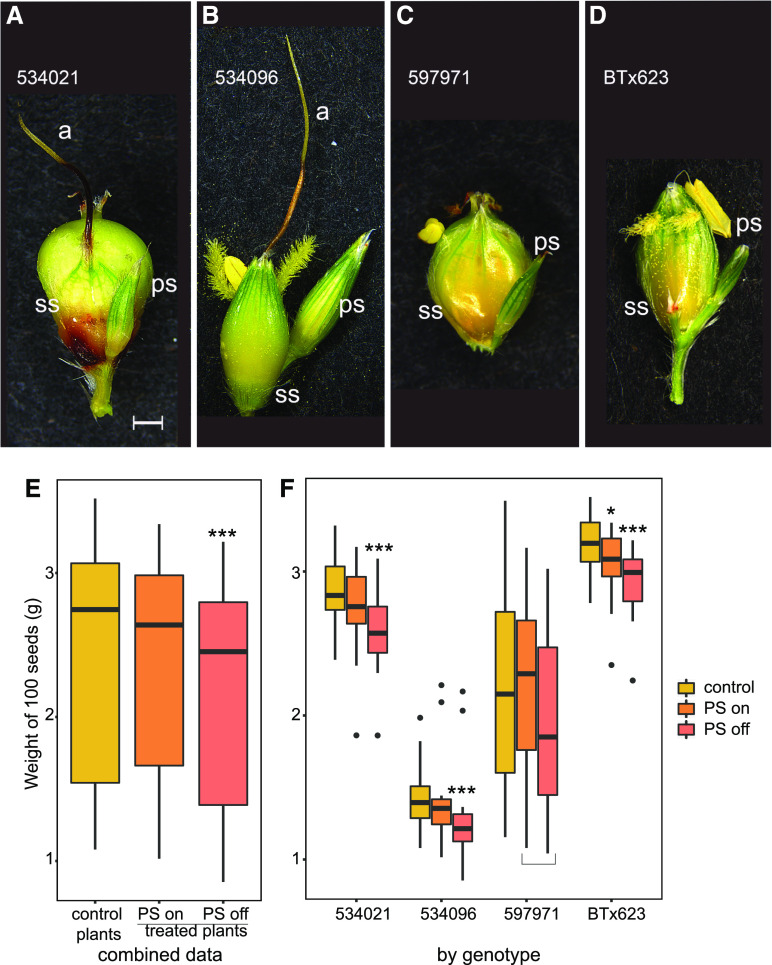
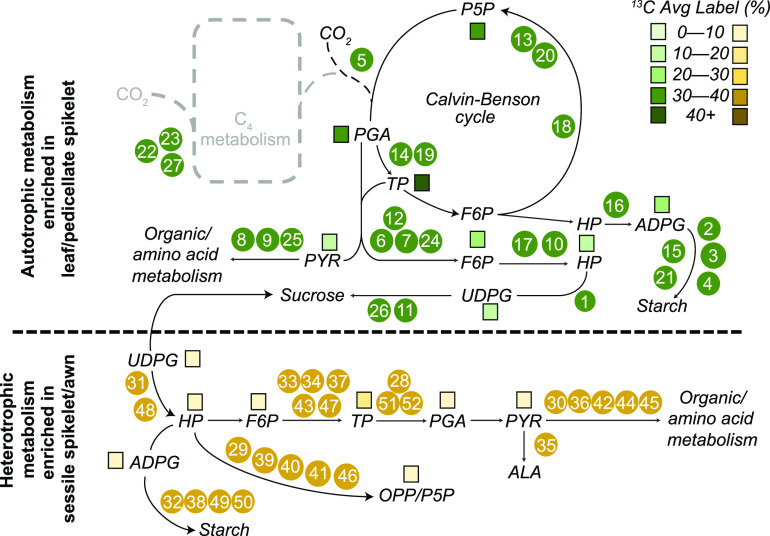
Sorghum (Sorghum bicolor) and its relatives in the grass tribe Andropogoneae bear their flowers in pairs of spikelets in which one spikelet (seed-bearing or sessile spikelet [SS]) of the pair produces a seed and the other is sterile or male (staminate). This division of function does not occur in other major cereals such as wheat (Triticum aestivum) or rice (Oryza sativa). Additionally, one bract of the SS spikelet often produces a long extension, the awn, that is in the same position as, but independently derived from, that of wheat and rice. The function of the sterile spikelet is unknown and that of the awn has not been tested in Andropogoneae. We used radioactive and stable isotopes of carbon, RNA sequencing of metabolically important enzymes, and immunolocalization of ribulose-1,5-bisphosphate carboxylase/oxygenase (Rubisco) to show that the sterile spikelet assimilates carbon, which is translocated to the largely heterotrophic SS. The awn shows no evidence of photosynthesis. These results apply to distantly related species of Andropogoneae. Removal of sterile spikelets in sorghum significantly decreases seed weight (yield) by ∼9%. Thus, the sterile spikelet, but not the awn, affects yield in the cultivated species and fitness in the wild species.


Figures

Figure 1.
Figure 1.
Spikelet Pair Structures. (A) to (I) S. bicolor (see [A] and [B]), A. schirensis (see [C] to [E]), and T. triandra (see [F] to [I]). (A), (C), and (G) Spikelet pairs, marked by dashed lines. Sex expression of each spikelet is indicated. The SS includes a bisexual flower and bears the seed and also bears a twisted awn from the lemma (floral bract). (A) Terminal spikelet (S. bicolor) is morphologically identical to a PS. PS may be either sterile (most commonly) or staminate. (B) Spikelet pair of S. bicolor accession SAP-15 (PI 656014). Bar = 1 mm. (C) PS is staminate. (D) Spikelet pair of A. schirensis. Bar = 1 mm. (E) Inflorescence of A. schirensis, showing two branches, each bearing 9 to 10 spikelet pairs. The uppermost leaf bears a reduced blade (arrow). Bar = 1 cm. (F) Spikelet pair of T. triandra, showing the dark indurate SS, with two greenish PSs behind. Bar = 1 mm. (G) Inflorescence structure in T. triandra, with three spikelet pairs and a terminal spikelet that is morphologically identical to the PS. Spikelets in the proximal two pairs (both pedicellate and sessile) are all staminate. STS, staminate sessile spikelet. (H) Proximal spikelet pairs of T. triandra, here called PS and STS since all four are staminate. Bar = 1 mm. STS, staminate sessile spikelet. (I) Inflorescence branch of T. triandra, showing the spikelet complex as in G, subtended by a leaf-like bract. Bar = 5 mm. STS, staminate sessile spikelet.
Figure 2.
Figure 2.
Results of 14C Pulse-Chase Experiments and Distribution of Stomata. (A) to (L) S. bicolor (see [A] to [D]), A. schirensis (see [E] to [H]), and T. triandra (see [I] to [L]). (A), (E), and (I) Percent dpm/mg for each organ after 1-h exposure to 14C with organs removed from the axis (detached), inflorescence intact (attached), or after 24-h chase (chase). Plot includes mean percentages and sds (n = 3). (B), (F), and (J) Abaxial epidermis of PSs showing rows of stomata (arrows) and bicellular microhairs (M) and prickles (P). (C), (G), and (K) Abaxial epidermis of SS showing no stomata, but bicellular microhairs (M) and silica bodies (sb) as well as large pits (pit) and macrohairs (mac) in T. triandra. (D), (H), and (L) Awn showing no stomata or other epidermal structures, except for prickles in sorghum (D) and A. schirensis (H) and long microhairs in T. triandra (L). Bar = 50 µm; note that (B) and (C) are more highly magnified than (D).
Figure 3.
Figure 3.
PCA of 13C-Labeled Metabolites. (A) to (F) S. bicolor (see [A] and [B]) and T. triandra (see [C] to [F]). Values for awn and SS are not significantly different in either species for any time point nor for most individual metabolites. (A), (C), and (E) Average labeling. Each point is the weighted average of all labeled isotopologues for a given metabolite, organ, and time point. (B), (D), and (F) All isotopologues. (A) Values for PS are significantly different from the other organs. See Supplemental Table 4. (B) Awn and SS are significantly different for P5P and UDPG, but not otherwise; PS is significantly different from the other two organs except for PYR. Values at 30 and 60 s not significantly different for most metabolites, but the 300-s time point is distinct. See Supplemental Table 5. (C) Values for PS are significantly different for six of nine metabolites, with the greatest difference in labeling at 300 s. See Supplemental Table 6. (D) Awn and SS are significantly different for P5P, but not otherwise; PS is significantly different from the other two organs except for P5P, PGA, and PYR. Values at 30 and 60 s are similar for most metabolites, but the 300-s time point is distinct. See Supplemental Table 7. (E) and (F) Values including bract; data for awn, SS and PS are the same as those in (C). (E) Bract is significantly different from all other organs for six out of eight metabolites. Values for PS are significantly different from awn and SS for only aspartate and PYR. The 300-s time point is significantly different from others. See Supplemental Table 11. (F) Results are similar to those for average labeling, with bract being significantly different from all other organs for six out of eight metabolites and isotoplogues, and the greatest difference in labeling occurring at 300 s. See Supplemental Table 12. Organs are distinguished by color, and time points are distinguished by shape. 30, values at 30 s of labeling; 60, values at 60 s of labeling; 300, values at 300 s of labeling.
Figure 4.
Figure 4.
13C Labeling for Individual Metabolites at Three Time Points. (A) 13C isotopologue distribution. (B) Average labeling. (A) and (B) Points are mean fractions for isotopologue distributions and average labeling; bars are sds, n = 3. Colors distinguish the three organs. Most label accumulation occurs in the PS and can be seen at 300 s. Insets represent the calculation of the active pool for malate. 2PG, 2-phosphoglycolate; F6P, fructose-6-phosphate; G6P, glucose-6-phosphate; MAL, malate; P5P, pentose 5 phosphates; PYR, pyruvate; TP, triose phosphates.
Figure 5.
Figure 5.
S. bicolor. Relative expression of genes encoding biosynthetic enzymes immediately responsible for producing the metabolites labeled with 13C, a subset extracted from full set of 922 DE metabolic genes in Supplemental Figure 3. Colors reflect scaled z-scores of log2-normalized expression values. Labels of genes indicate enzyme name, biochemical process, and subcellular localization: 1) UTP-G1P UdT, UTP-glucose-1-phosphate-uridyltransferase, Sobic.002G291200.1; 2) starch synthase, Sobic.001G239500.2; 3) starch synthase, Sobic.010G047700.1; 4) starch synthase, Sobic.002G116000.1; 5) ribulose-1,5-bisphosphate carboxylase/oxygenase, small subunit, Sobic.005G042000.1; 6) F16BP aldo, fructose-1,6-bis-phosphate aldolase, Sobic.005G056400.1; 7) F16BP aldo, fructose-1,6-bis-phosphate aldolase, Sobic.008G053200.1; 8) GDH, glutamate dehydrogenase, Sobic.003G188400.1; 9) GS, glutamine synthetase, Sobic.006G249400.1; 10) PGM, phosphoglucomutase, Sobic.003G222500.1; 11) SuSY, sucrose phosphate synthase, Sobic.004G068400.1; 12) F16BPase, fructose-1,6-bisphosphatase, Sobic.003G367500.1; 13) PPE, phosphopentose epimerase, Sobic.001G491000.1; 14) TPI, triose phosphate isomerase, Sobic.002G277100.1; 15) starch synthase, Sobic.006G221000.1; 16) G1P-AdT, glucose-1-phosphate adenyltransferase, Sobic.007G101500.1; 17) PGI, phosphoglucoisomerase, Sobic.002G230600.1; 18) S17BPase, sedoheptulose 1,7-bisphosphatase, Sobic.003G359100.1; 19) PGK, phosphoglycerate kinase, Sobic.009G183700.1; 20) PPI, phosphopentose isomerase, Sobic.001G069000.1; 21) starch synthase, Sobic.004G238600.1; 22) NADP-ME, NADP-malic enzyme, Sobic.003G036200.1; 23) NADP-MDH, NADP-malate dehydrogenase, Sobic.007G166300.1; 24) F16BPase, fructose-1,6-bisphosphatase, Sobic.010G188300.1; 25) PEPCK, phosphoenol pyruvate carboxykinase, Sobic.004G338000.1; 26) SuSY, sucrose phosphate synthase, Sobic.003G403300.1; 27) PEPC, phosophoenol pyruvate carboxylase, Sobic.010G160700.1; 28) GAPDH, glyceraldehyde-3-phosphate dehydrogenase, Sobic.005G159000.1; 29) PPE, phosphopentose epimerase, Sobic.002G257300.1; 30) PEPC, phosphoenol pyruvate carboxylase, Sobic.004G106900.1; 31) UTP-G1P UdT, Sobic.006G213100.1; 32) G1P-AdT, glucose-1-phosphate adenyltransferase, Sobic.002G160400.1; 33) TPI, triose phosphate isomerase, Sobic.003G072300.2; 34) F16BP aldo, fructose-1,6-bisphosphate aldolase, Sobic.004G146000.1; 35) ALAAT, alanine amino transferase, Sobic.001G260701.1; 36) PEPCK, phosphoenol pyruvate carboxykinase, Sobic.006G198400.2; 37) F16BP aldo, fructose-1,6-bisphosphate aldolase, Sobic.003G393900.1; 38) starch synthase, Sobic.007G068200.1; 39) PPI, phosphopentose isomerase, Sobic.003G182400.1; 40) PPI, phosphopentose isomerase, Sobic.008G135701.1; 41) TK, transketolase, Sobic.010G024000.2; 42) NAD-GS, Sobic.003G258800.1; 43) F16BP aldo, fructose-1,6-bisphosphate aldolase, Sobic.003G096000.2; 44) PEPC, phosphoenol pyruvate carboxylase, Sobic.003G301800.1; 45) PEPC, phosphoenol pyruvate carboxylase, Sobic.002G167000.1; 46) TK, transketolase_Sobic.009G062800.1; 47) F16BP aldo, fructose-1,6-bisphosphate aldolase, Sobic.009G242700.1; 48) PGM, phosphoglucomutase, Sobic.001G116500.1; 49) starch synthase, Sobic.010G022600.1; 50) starch synthase, Sobic.010G093400.1; 51) GAPDH, glyceraldehyde-3-phosphate dehydrogenase, Sobic.004G056400.1; 52) GAPDH, glyceraldehyde-3-phosphate dehydrogenase, Sobic.004G205100.1. cy, cytosolic localized; ch, chloroplast localized; mi, mitochondrial localized; OA/AA, organic acid/amino acid metabolism.
Figure 6.
Figure 6.
Immunofluorescence of Rubisco Large Subunit in Sorghum Spikelets. (A), (C), (E), (G), and (I) Cross section of glume of PS. (B), (D), (F), (H), and (J) Cross section of glume of SS. (A) and (B) Bright field. (C) and (D) Anti-Rubisco large subunit with Alexa 488 as the secondary antibody; emission window 509 to 585 nm. (E) and (F) Lignin autofluorescence; emission window 415 to 485 nm. (G) and (H) Chlorophyll autofluorescence; emission window 661 to 779 nm. Autofluorescence in sclerenchyma in (H) is nonspecific. (I) and (J) Merge of Rubisco, chlorophyll, and lignin channels. Black arrowheads, vascular bundles; inner (adax), facing the inside of the spikelet; outer (abax), facing the outside of the spikelet; bs and white arrows, bundle sheath; scl, sclerenchyma. Bars = 50 µm.
Figure 7.
Figure 7.
Spikelet Removal Experiments. (A) to (D) Representative spikelet pair for each accession. (A) Jola Nandyal (534021). (B) SO85 (PI 534096). (C) SAP-170 (PI 597971). (D) BT×623 (PI 564163). Bar = 1 mm. All spikelets to the same scale. (E) and (F) Results of removal experiments. 100-seed weight (g) from control (unmanipulated) plants and manipulated plants. In the latter plants, PSs from some branches were untouched (on) and those from other branches were removed (off). (E) Results from all genotypes combined, showing an 8.82% reduction in average weight with spikelet removal. (F) Average seed weight for each genotype analyzed separately. (A) to (F) Effect sizes for 534021, 534096, and BT×623 were 8.08, 13.61, and 9.72%, respectively. Effect size for 597971, 7.80%, was nonsignificant because of high variance in the control plants; however, a comparison of seeds from only the manipulated plants (bracketed) was highly significant. ***P < 0.001; *P < 0.05. Box plot center line, median; upper and lower limits of boxes, first and third quartiles; whiskers, up to (down to) 1.5× the interquartile range; points, outliers. See also Supplemental Table 8. a, awn; ps, pedicellate spikelet; ss, seed-bearing spikelet.
Figure 8.
Figure 8.
Results of 14C Pulse-Chase Experiments and Distribution of Stomata in Bracts. (A) to (D) A. schirensis (see [A] and [B]) and T. triandra (see [C] and [D]). (A) and (C) 14C results including bract. Percent dpm for each organ after 1-h exposure to 14C with organs removed from the axis (detached), inflorescence intact (attached), or after 24-h chase. Plot includes mean percentages and sds; n = 3. (A) Values for bracts and PS are significantly lower and higher, respectively, when attached to the axis rather than detached, whereas values for SS did not differ significantly. Percent counts in the bract were not significantly different after the 24-h chase as compared with attached, but were significant relative to detached. Percentages in the PS significantly decreased relative to attached, but not relative to detached. See also Supplemental Table 9. After 1 h, most counts are in the bract when organs are detached from the stem but in the PS when they are attached. (B) and (D) Abaxial epidermis of bract showing rows of stomata (arrows) and prickles (P). Bar = 50 µm. (C) Values for detached and attached organs after 1 h are not significantly different. Values for bract and SS significantly decrease and increase, respectively, after the 24-h chase. Values for PS are not significantly different. See also Supplemental Table 10.
Figure 9.
Figure 9.
Summary of Biochemical Pathways Assessed by 13C and RNA-Seq Data. Numbered dots correspond to enzymes whose expression is shown in Figure 5. Colored squares reflect percent average label in 13C assays of metabolites. Top part of figure shows autotrophic metabolism and is enriched in the leaf and PS; bottom part of figure shows heterotrophic metabolism, enriched in the SS.
None

Comment in

References

    1. Abramoff M.D., Magalhaes P.J., Ram S.J.(2004). Image processing with ImageJ. Biophoton. Int. 11: 36–42.
    1. Allen D.K., Ohlrogge J.B., Shachar-Hill Y.(2009). The role of light in soybean seed filling metabolism. Plant J. 58: 220–234. - PubMed
    1. Allen D.K., Young J.D.(2020). Tracing metabolic flux through time and space with isotope labeling experiments. Curr. Opin. Biotechnol. 64: 92–100. - PMC - PubMed
    1. Anders S., Pyl P.T., Huber W.(2015). HTSeq--A Python framework to work with high-throughput sequencing data. Bioinformatics 31: 166–169. - PMC - PubMed
    1. Antlfinger A., Wendel L.(1997). Reproductive effort and floral photosynthesis in Spiranthes cernua (Orchidaceae). Am. J. Bot. 84: 769–780. - PubMed

Publication types

LinkOut - more resources