. 2020 Sep 30;40(40):7651-7667.
doi: 10.1523/JNEUROSCI.1464-20.2020. Epub 2020 Sep 1.

A Window of Vascular Plasticity Coupled to Behavioral Recovery after Stroke

Affiliations

A Window of Vascular Plasticity Coupled to Behavioral Recovery after Stroke

Michael R Williamson et al. J Neurosci. .

Abstract

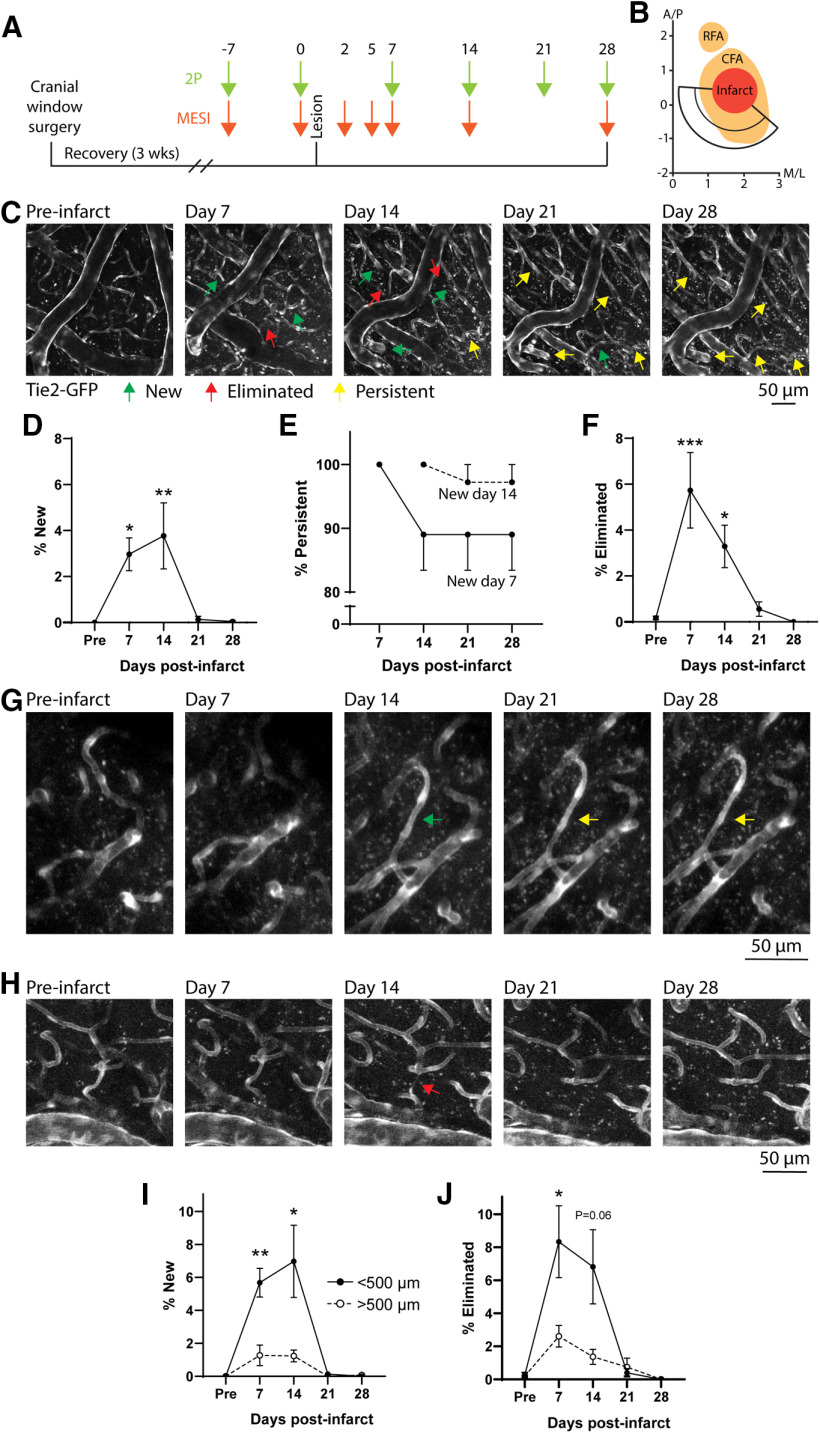
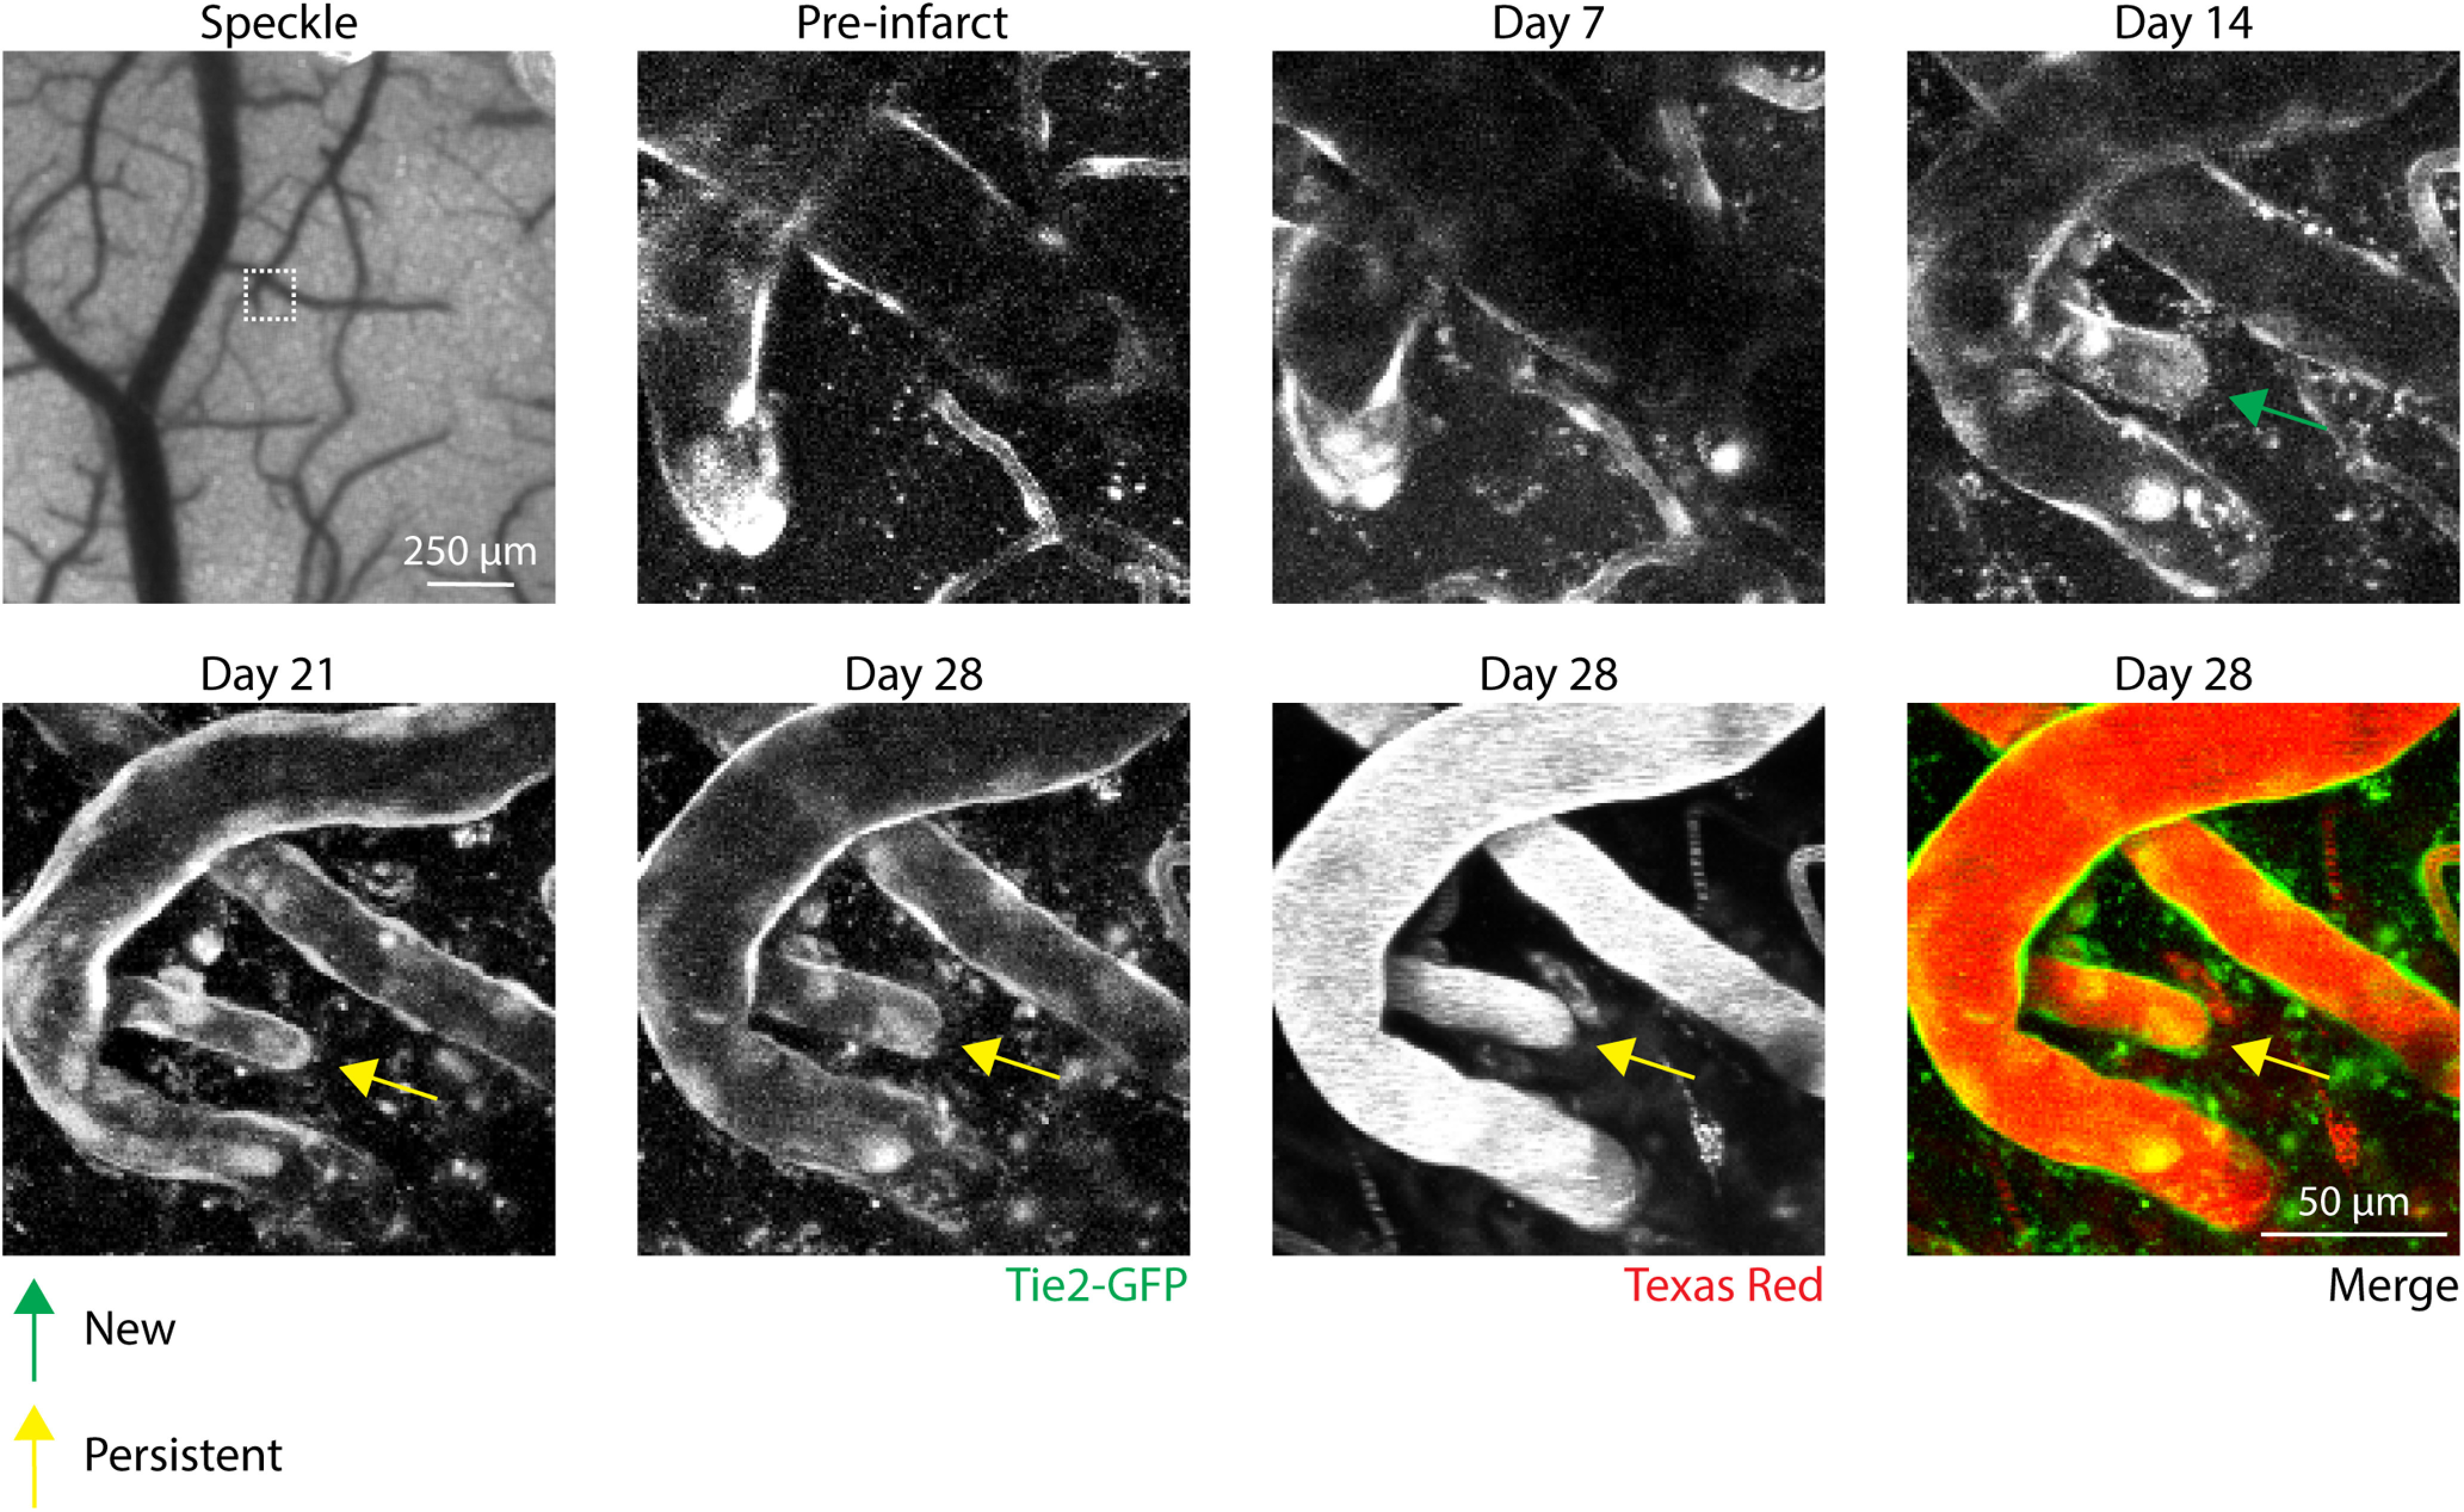
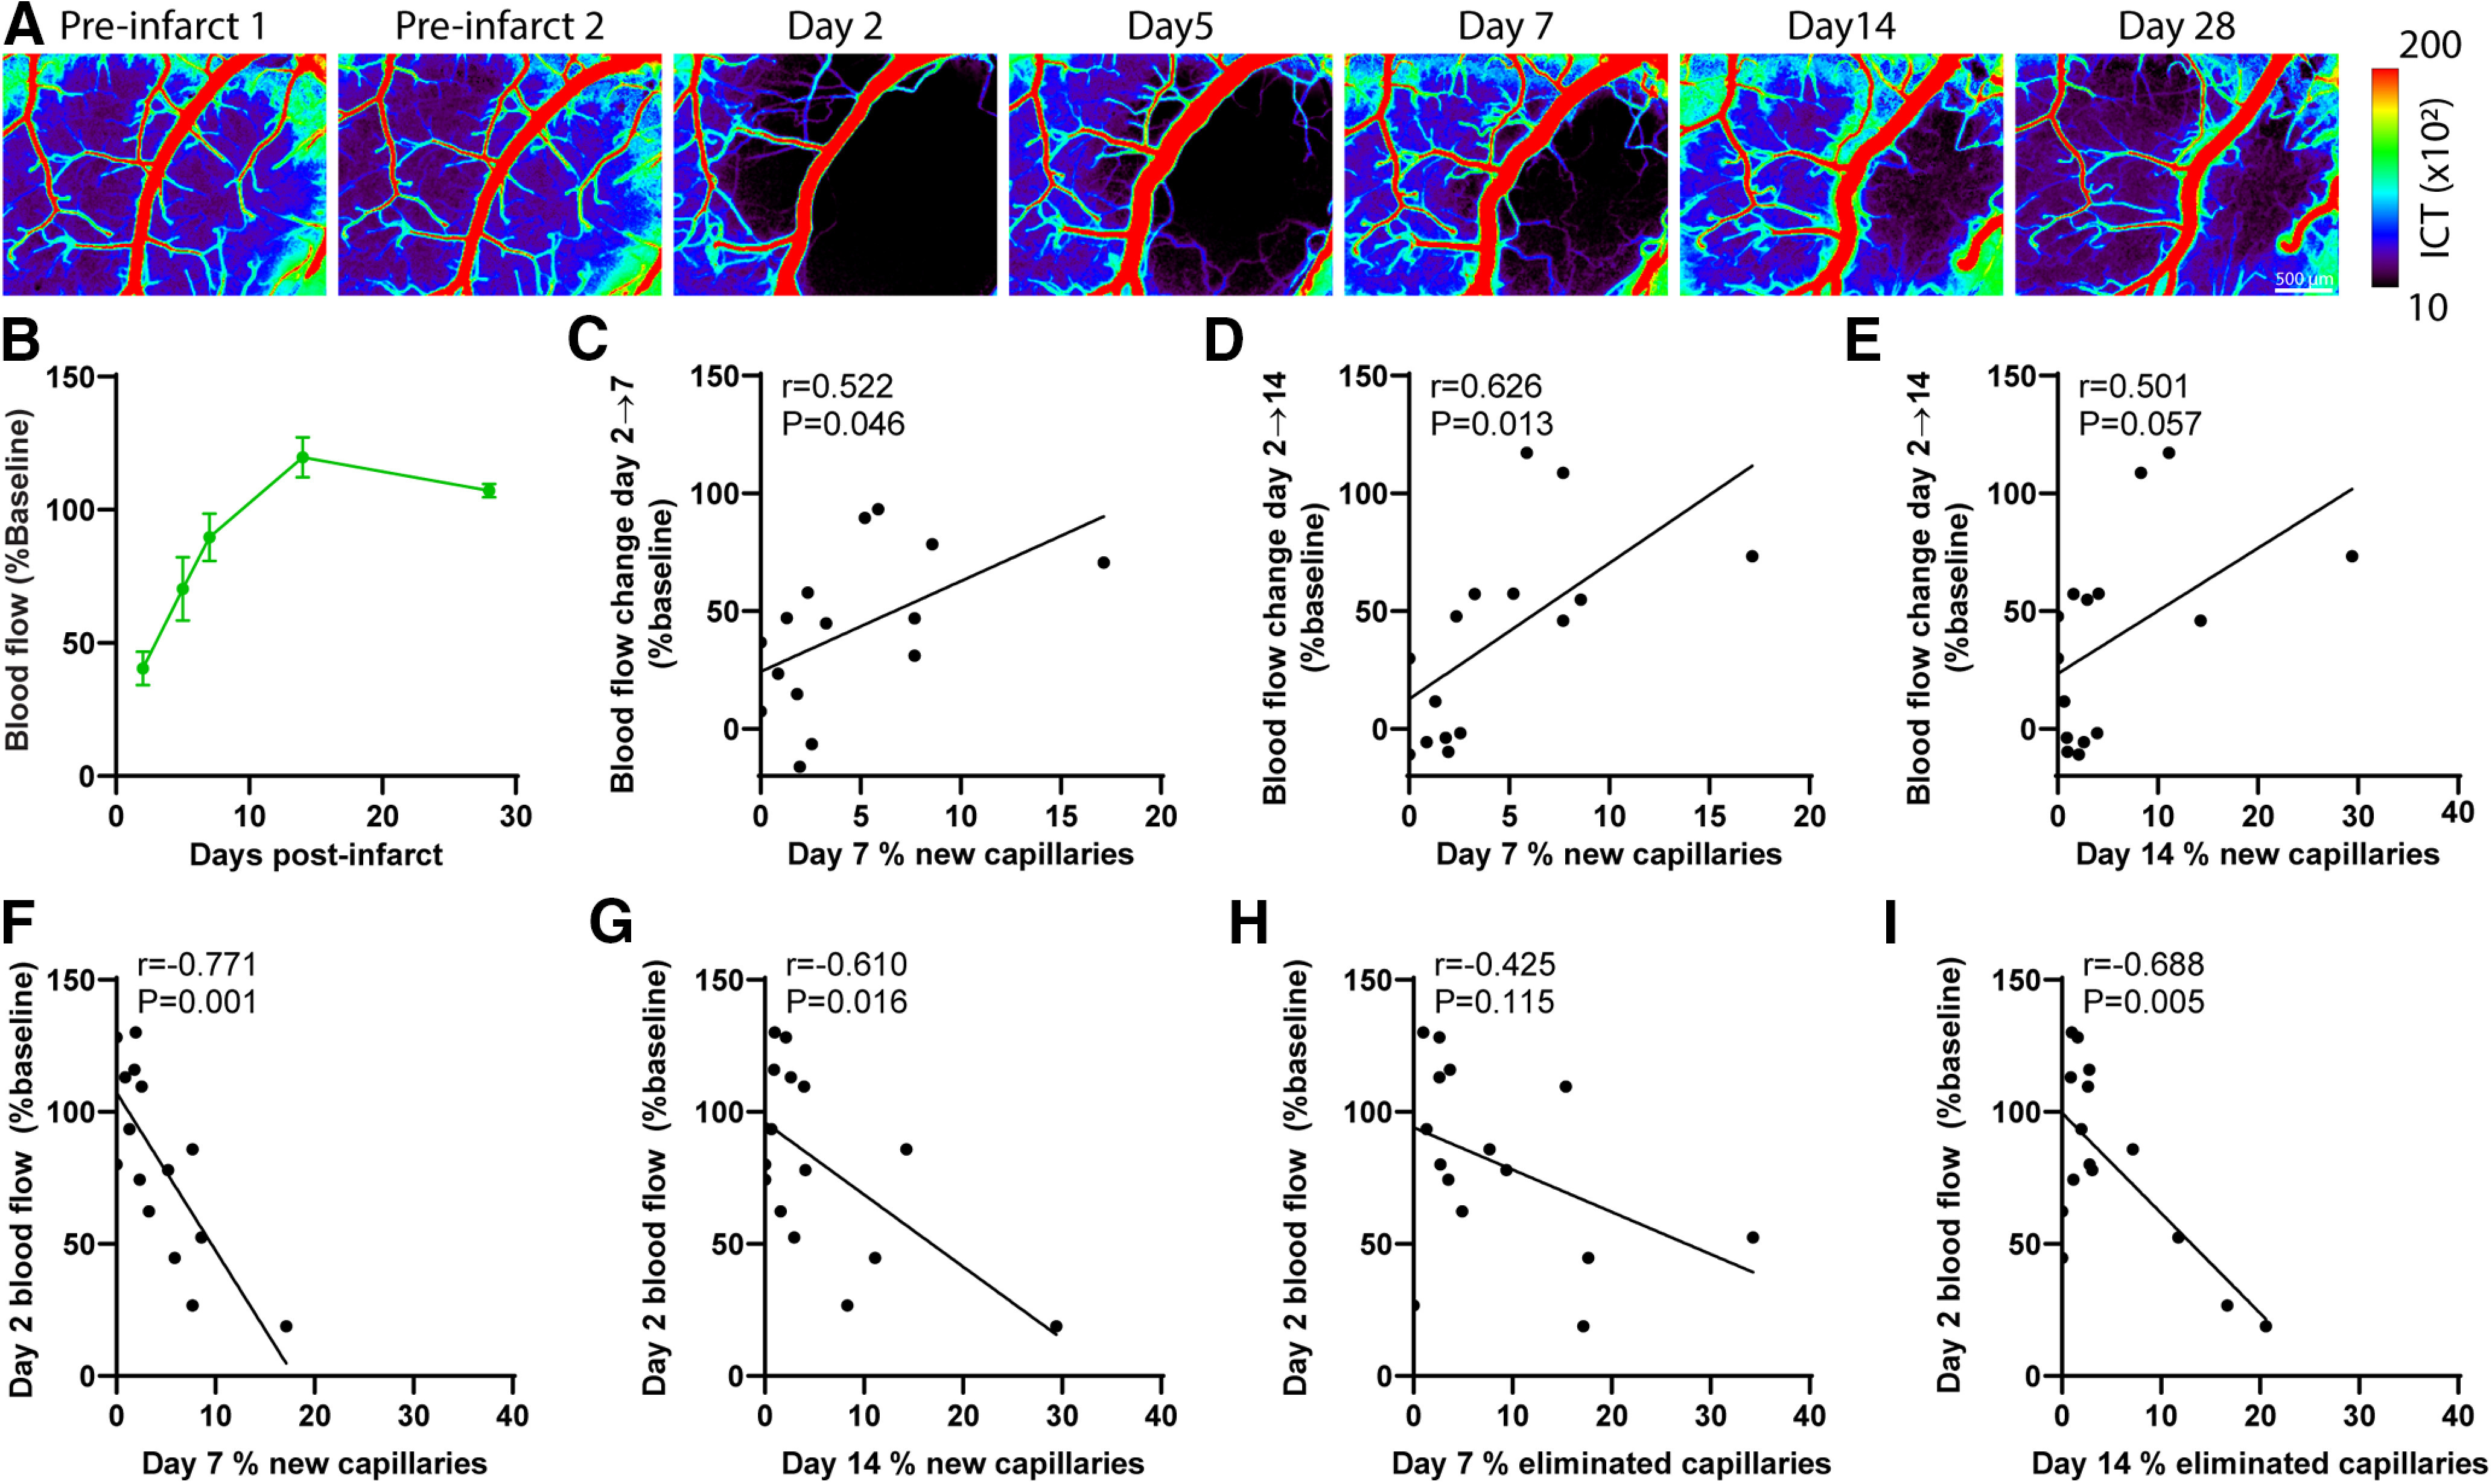
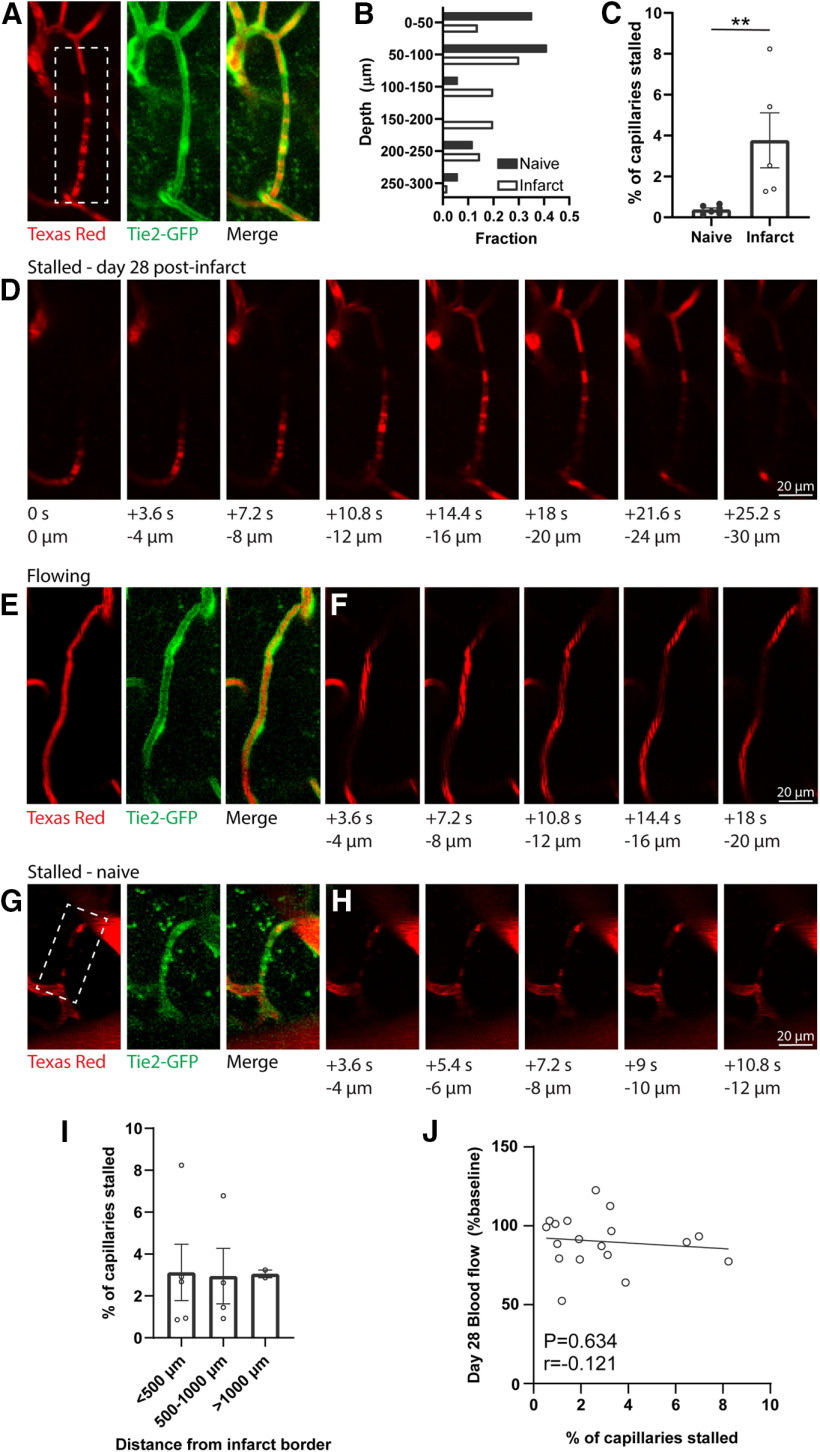
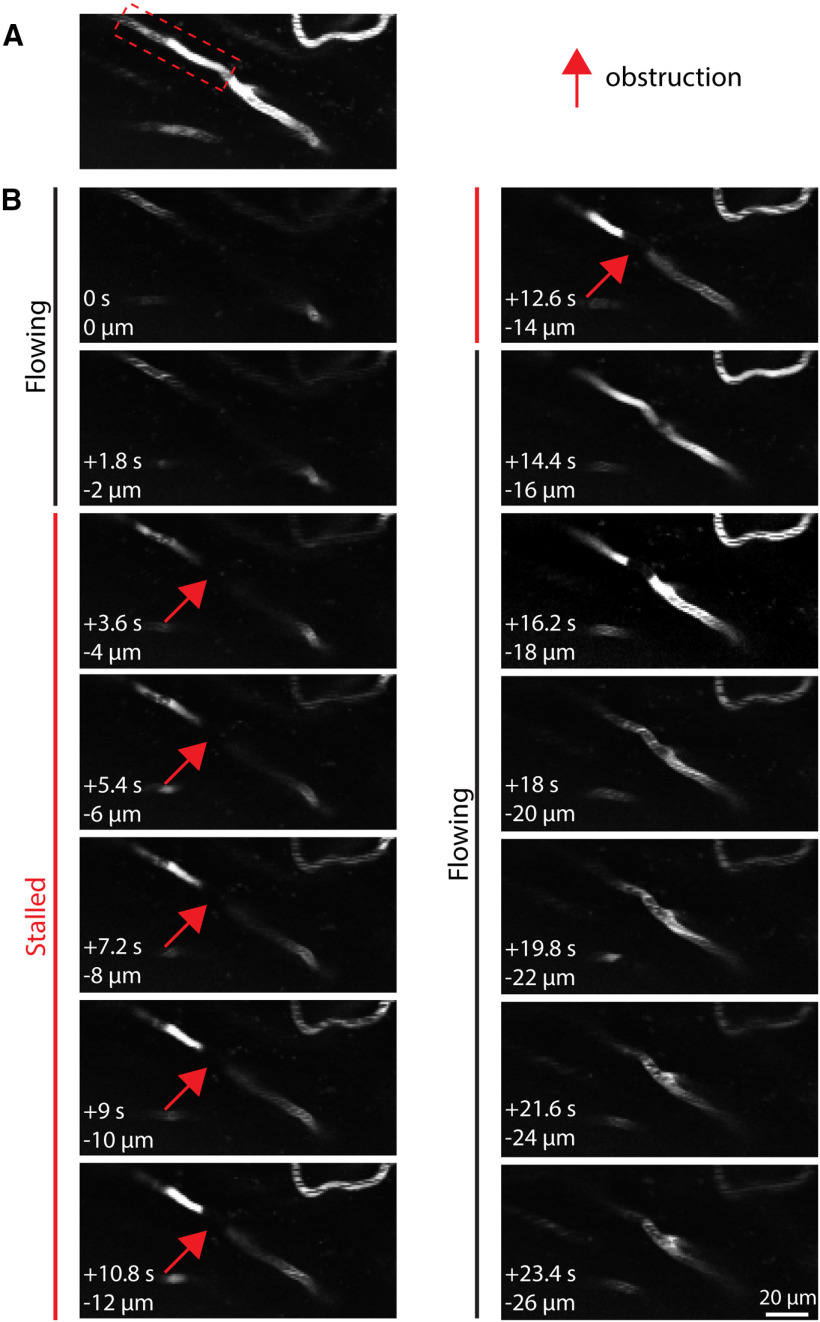
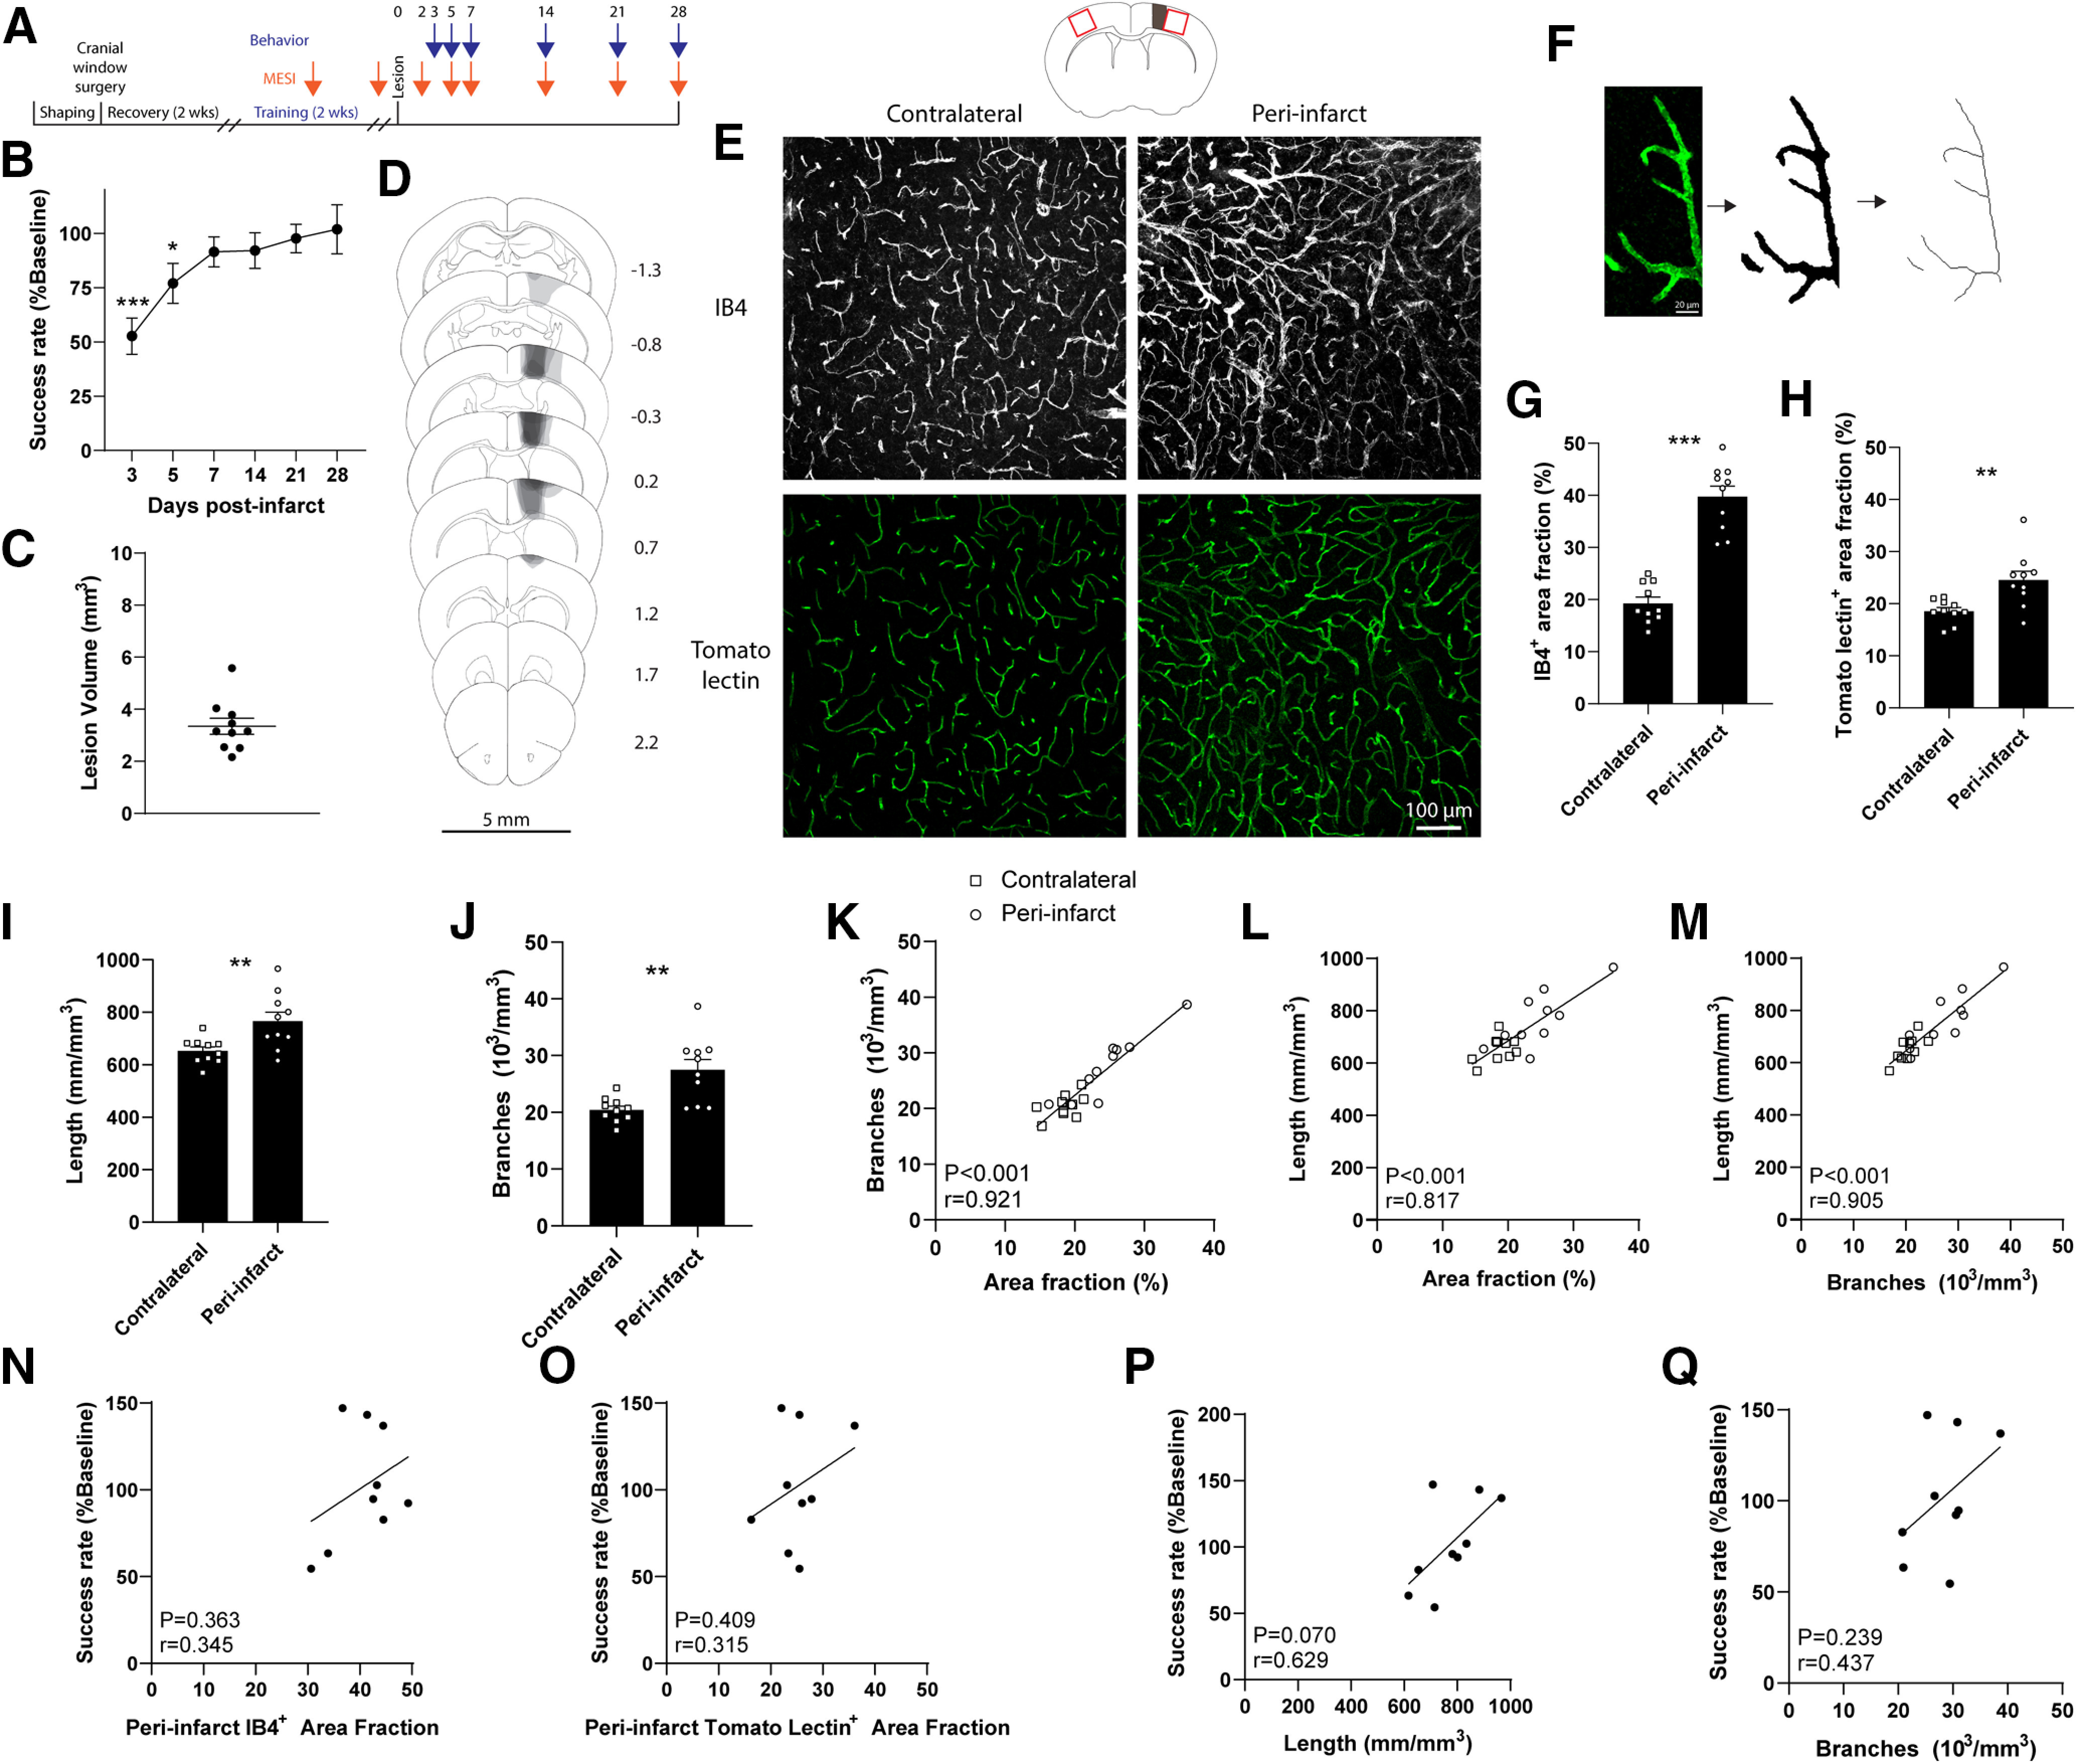
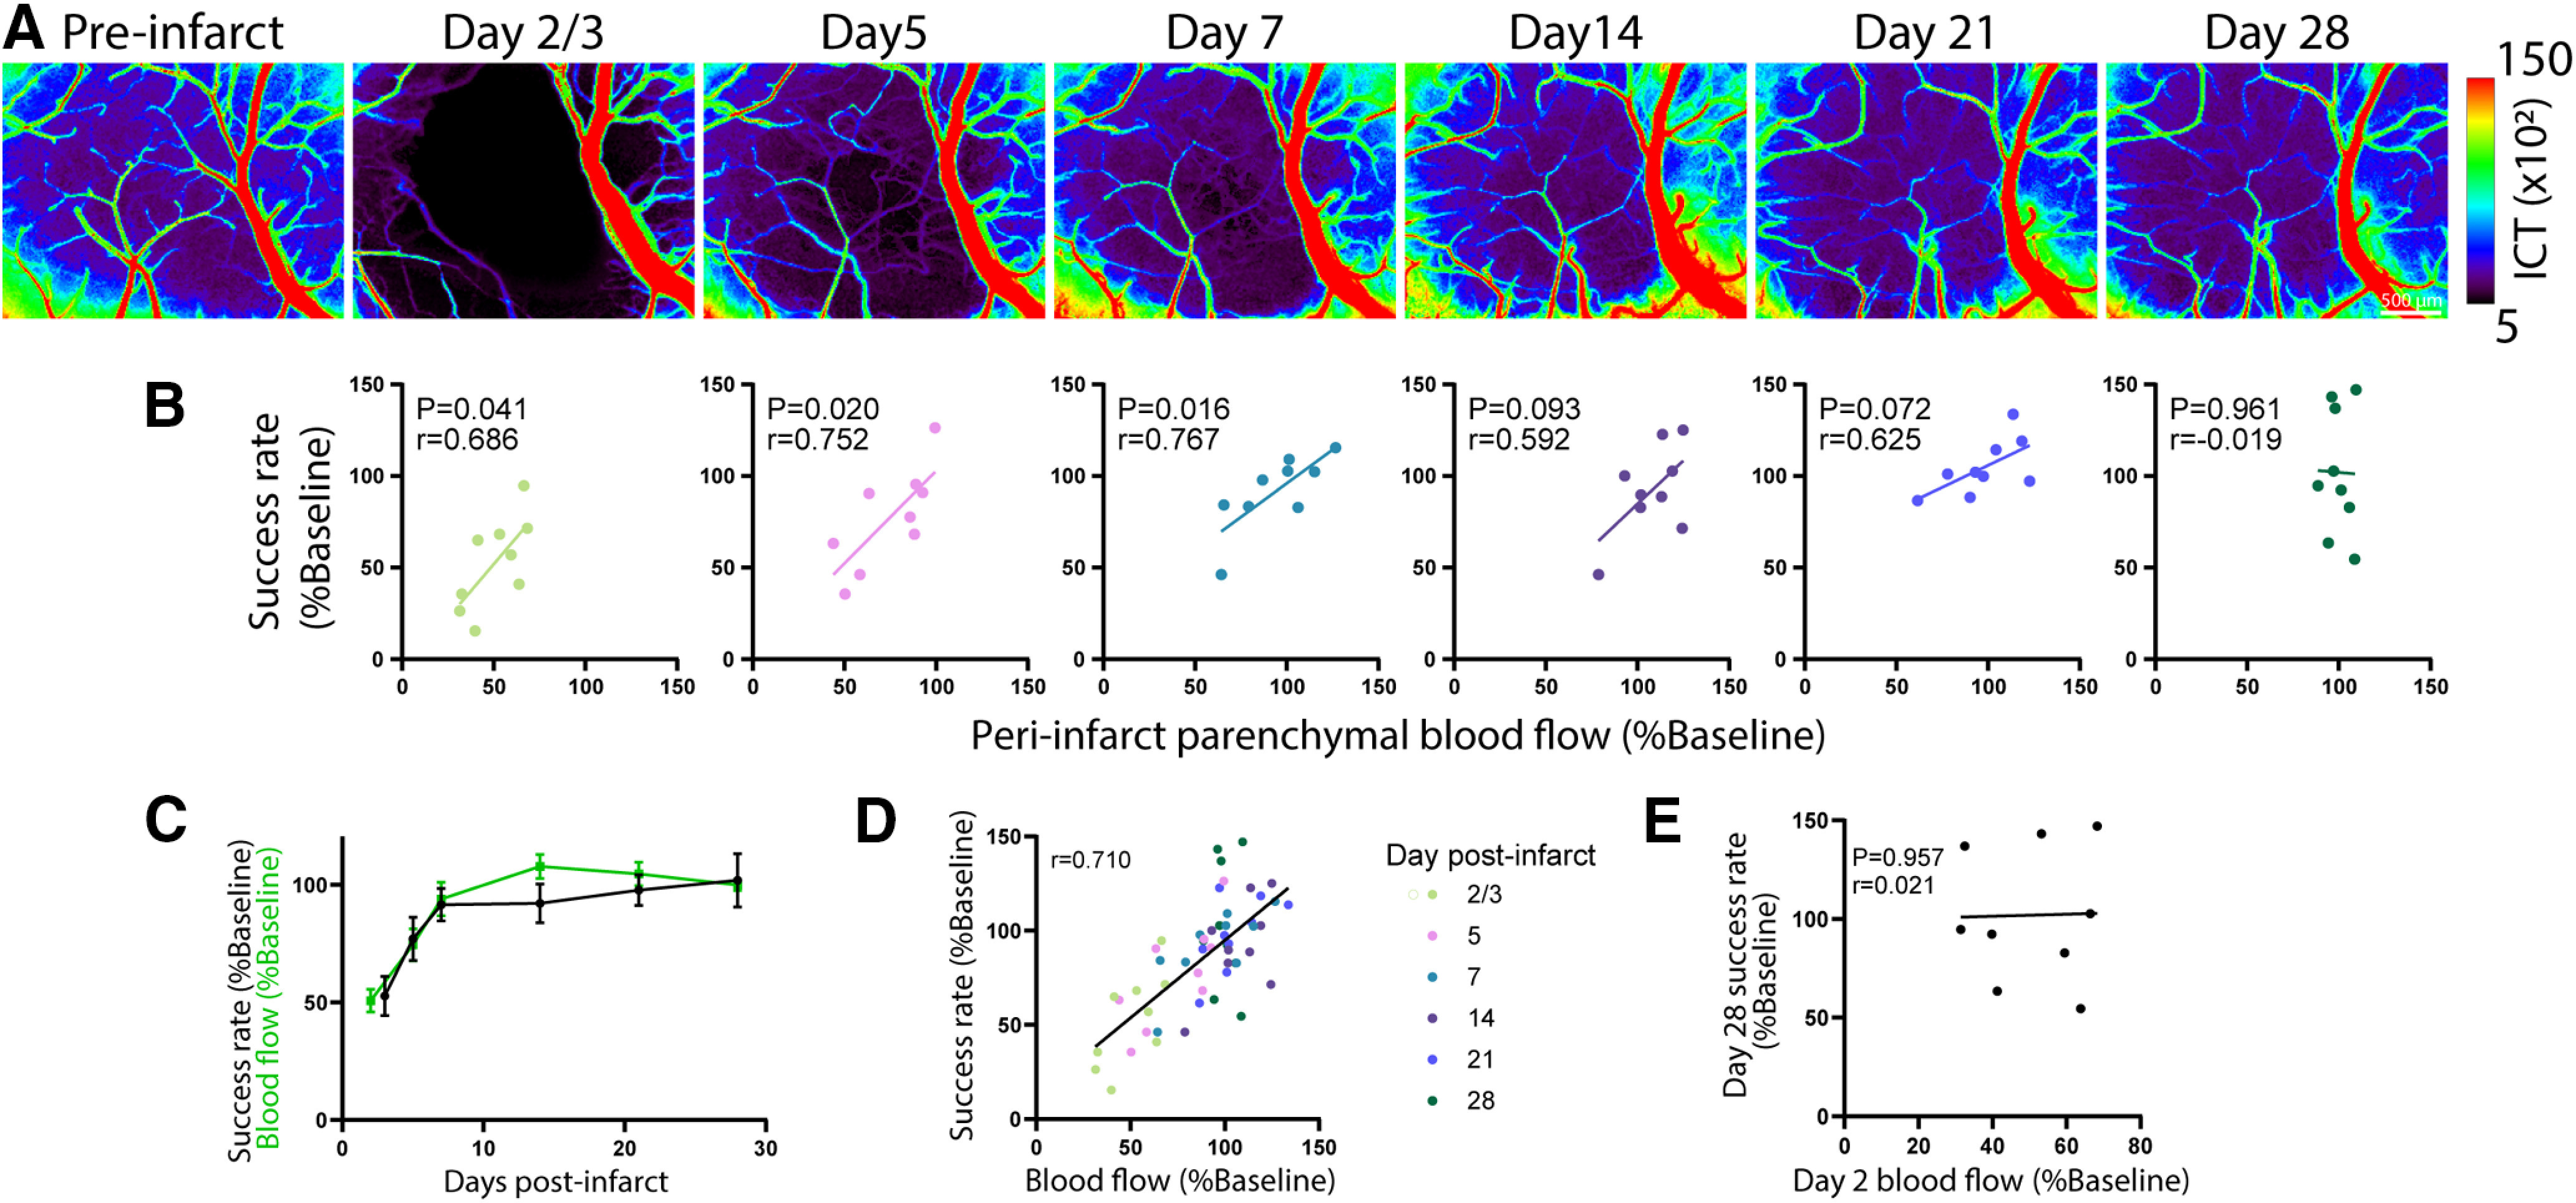
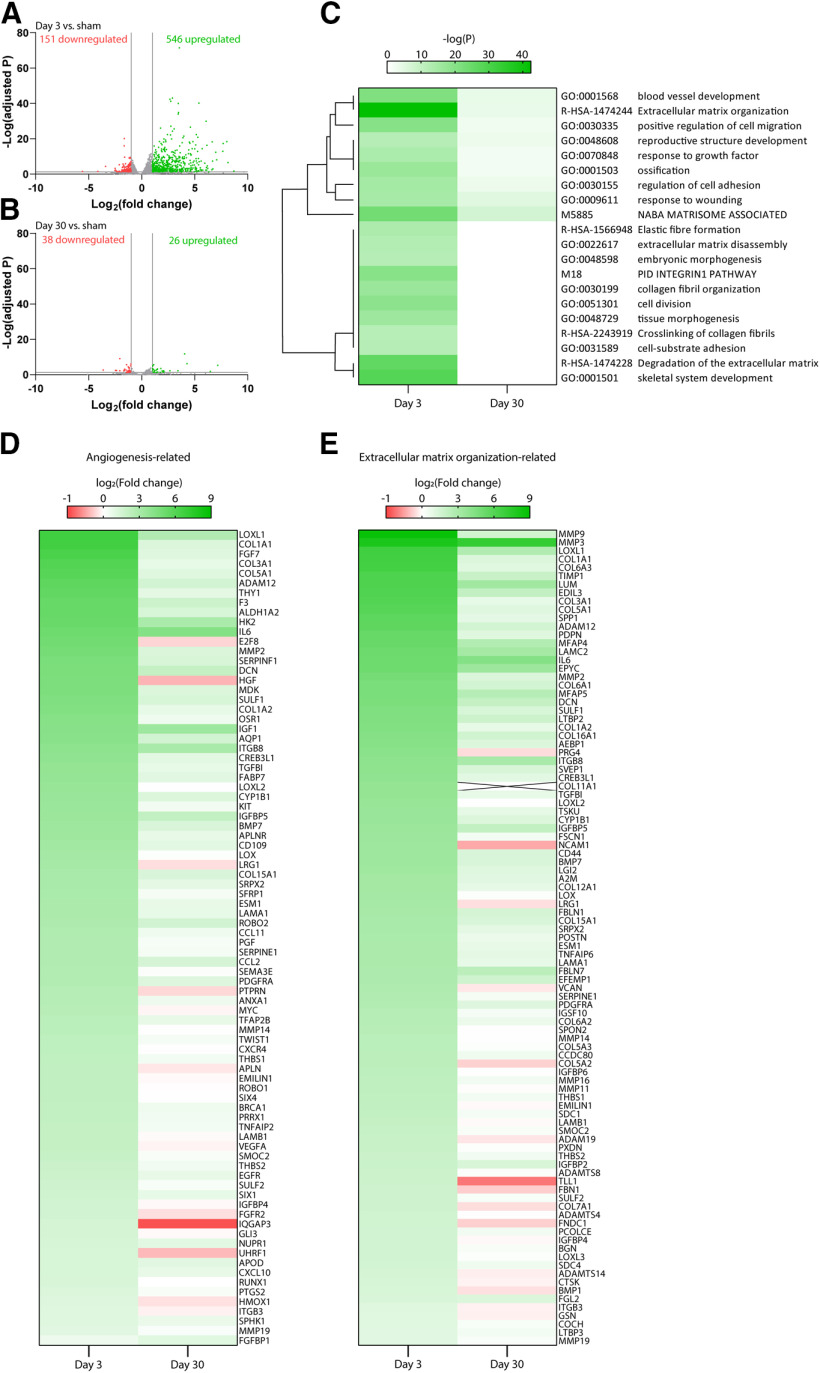
Stroke causes remodeling of vasculature surrounding the infarct, but whether and how vascular remodeling contributes to recovery are unclear. We established an approach to monitor and compare changes in vascular structure and blood flow with high spatiotemporal precision after photothrombotic infarcts in motor cortex using longitudinal 2-photon and multiexposure speckle imaging in mice of both sexes. A spatially graded pattern of vascular structural remodeling in peri-infarct cortex unfolded over the first 2 weeks after stroke, characterized by vessel loss and formation, and selective stabilization of a subset of new vessels. This vascular structural plasticity was coincident with transient activation of transcriptional programs relevant for vascular remodeling, reestablishment of peri-infarct blood flow, and large improvements in motor performance. Local vascular plasticity was strongly predictive of restoration of blood flow, which was in turn predictive of behavioral recovery. These findings reveal the spatiotemporal evolution of vascular remodeling after stroke and demonstrate that a window of heightened vascular plasticity is coupled to the reestablishment of blood flow and behavioral recovery. Our findings support that neovascularization contributes to behavioral recovery after stroke by restoring blood flow to peri-infarct regions. These findings may inform strategies for enhancing recovery from stroke and other types of brain injury.SIGNIFICANCE STATEMENT An improved understanding of neural repair could inform strategies for enhancing recovery from stroke and other types of brain injury. Stroke causes remodeling of vasculature surrounding the lesion, but whether and how the process of vascular remodeling contributes to recovery of behavioral function have been unclear. Here we used longitudinal in vivo imaging to track vascular structure and blood flow in residual peri-infarct cortex after ischemic stroke in mice. We found that stroke created a restricted period of heightened vascular plasticity that was associated with restoration of blood flow, which was in turn predictive of recovery of motor function. Therefore, our findings support that vascular remodeling facilitates behavioral recovery after stroke by restoring blood flow to peri-infarct cortex.

Keywords: angiogenesis; blood flow; in vivo imaging; neural repair; recovery; vascular remodeling.


Figures

Figure 1.
Figure 1.
Optical methods. A, A laser speckle contrast image of the surface of motor cortex through a cranial window. Darker pixels represent higher blood flow. B, In vivo 2P image of the superficial cerebral vasculature from the region indicated in A (50 µm depth). Vessels are labeled with genetically encoded GFP (Tie2-GFP) and intravenous Texas Red-conjugated dextran. C, 3D projection of cortical vasculature from the region indicated in A to a depth of 300 µm. D, Schematic diagram of the instrument used for inducing photothrombotic infarcts with live laser speckle contrast imaging. E, Example laser speckle contrast images before, during, and after photothrombosis. Green circle represents the photothrombotic (green laser) target, which is centered on a penetrating arteriole. F, Schematic diagram of the instrument used for MESI. AOM, Acousto-optic modulator. G, Example of MESI before (top) and 2 d after (bottom) photothrombosis.
Figure 2.
Figure 2.
Comparison of in vivo 2P imaging of vasculature with intravascular Texas Red-conjugated dextran and genetically encoded endothelial cell GFP expression (Tie2-GFP). A, Maximum intensity projection images (50 µm) of cortical vasculature spanning from the pial surface to 300 µm deep. B, Line profiles of fluorescence intensity across representative capillaries by depth. Measured regions are indicated with red (Texas Red) and green (Tie2-GFP) lines in A.
Figure 3.
Figure 3.
Incomplete labeling of vasculature with intravascular dye. Three examples of capillary segments visible by GFP expression but not intravascular dye. Some segments completely lacked intravascular dye, whereas others were partially filled. Images are 30-50 µm projections.
Figure 4.
Figure 4.
Stability of vascular structure and blood flow in intact cortex. A, Timeline for repeated imaging of vascular structure (2P) and blood flow (MESI). B, 50 µm projection images of stable vessels taken 3 months apart. C, Example of an eliminated capillary (arrows). D, Example of a newly formed capillary (arrows). E, Quantification of capillary segment changes over the 3 month interval. Percentages are relative to the total number of capillaries at the first imaging time point. F, Representative MESI images of cortical blood flow. Example ROIs for each region type are indicated: P, Parenchymal (G); A, artery/arteriole (H); V, vein/venule (I). G–I, Correlations of regional blood flow between defined ROIs over the 3 month interval (N = 6 mice, N = 8 ROIs per region type per mouse). Diagonal dashed lines indicate the line of equality. Cortical blood flow was highly consistent within defined regions across the interval.
Figure 5.
Figure 5.
In vivo 2P time-lapse imaging reveals a spatially graded, temporally restricted window of vascular plasticity after stroke. A, Timeline for multimodal imaging of vascular structure and blood flow in Tie2-GFP mice (N = 6). B, Diagram indicating approximate 2P imaged regions relative to the infarct and rostral (RFA) and caudal (CFA) forelimb areas of motor cortex. Numbers indicate millimeters relative to bregma. C, 2P time-lapse images showing examples of vessel elimination, formation, and new vessel persistence. There was a period of heightened structural vascular plasticity in peri-infarct cortex during the first 2 weeks after infarct characterized by increases in capillary formation (D) and elimination (F). *p < 0.05; **p < 0.01; ***p < 0.001; versus pre-infarct (Holm-Sidak tests). E, Persistence of new segments. More than 90% of new capillaries formed after infarct persisted to 28 d after infarct. All new capillaries that survived to the next imaging time point survived to day 28. G, High-magnification example of formation and persistence of a new capillary segment. H, High-magnification example of elimination of a single capillary segment. The magnitude of structural vascular plasticity was spatially graded. The rates of capillary formation (I) and elimination (J) were significantly greater in regions within 500 µm of the infarct border compared with those further. *p < 0.05; **p < 0.01; between distance bins (t tests).
Figure 6.
Figure 6.
Formation of a new penetrating arteriole after stroke. White box on the speckle contrast image represents the region of 2P images. The new arteriole segment was visible on day 14 (green arrow) and subsequent imaging time points (yellow arrows).
Figure 7.
Figure 7.
Microvascular plasticity is associated with recovery of peri-infarct blood flow. A, Time-lapse MESI of cortical blood flow before and after photothrombosis. B, Longitudinal measurements of peri-infarct blood flow after stroke. Sampled regions were within ∼500 µm of the infarct border. Restoration of blood flow was coincident with the period of heightened structural vascular plasticity. C-E, Local capillary formation during the peak of plasticity was correlated with increases in blood flow within the same region over several time scales. F-I, Acute blood flow deficits (day 2 after infarct) predicted the magnitude of later regional capillary plasticity. Changes in blood flow are presented as the difference in blood flow, expressed as a percentage of baseline blood flow, between the indicated time points.
Figure 8.
Figure 8.
Stroke increases the frequency of capillary stalls in peri-infarct cortex. Stalled capillaries were identified by an absence of blood cell movement in 2P images. A, Example of a stalled capillary in peri-infarct cortex 28 d after stroke (dashed box). Images are maximum projection images. B, Depth distribution of stalled capillaries summed across mice. In naive mice, stalled capillaries tended to be located within the superficial 100 µm of cortex. At 28 d after stroke, stalled capillaries were observed more evenly throughout the imaged depth of cortex. C, Proportion of stalled capillaries in naive mice compared with 28 d after infarct. Stalled capillaries were ∼3-20 times more frequent after stroke relative to naive mice. **p < 0.01 (Mann–Whitney U test). D, Time-lapse imaging of the stalled capillary in A through z steps. Note the immobile bright (labeled plasma) and dark (plasma excluded) regions. E, Example of a flowing capillary (maximum projection images). F, Time-lapse imaging of the capillary in E through z steps. Narrow dark streaks represent blood cell movement. G, Example of a stalled capillary in cortex of a naive, uninjured mouse (dashed box). Images are maximum projection images. H, Time-lapse imaging of the stalled capillary in G through z steps. I, Percent of capillaries that were stalled in peri-infarct cortex 28 d after infarct by distance from the infarct border. Each point represents a single animal for the indicated distance bin. Distances >500 µm could only be analyzed in a subset of animals. There was no effect of distance on the incidence of capillary stalls (one-way ANOVA, F(2,8) = 0.005, p = 0.995). J, Scatter plot of the incidence of capillary stalls in each 2P imaged region and day 28 parenchymal blood flow measured in the same region (N = 18 regions; each point represents a single region) from N = 5 mice. The incidence of capillary stalls did not predict regional blood flow, indicating that any effect of stalls on blood flow was highly localized.
Figure 9.
Figure 9.
Example of a transiently stalled capillary. A, Maximum intensity projection of a capillary that was transiently stalled. Red box represents the segment that was stalled. B, Time-lapse images of the transiently stalled capillary in A, through 2 µm z steps. For comparison, streaks of moving blood cells are visible in all images in the capillary at the top right. Red arrow indicates an obstruction.
Figure 10.
Figure 10.
Behavioral deficits and histologic evidence of vascular remodeling after stroke. A, Timeline for behavioral training and testing and repeated imaging of blood flow in C57BL/6J mice. B, Infarcts caused transient deficits on the single-seed reaching task. *p < 0.05; ***p < 0.001; versus day 28 (Holm-Sidak test). N = 9. C, Lesion volume measurements. D, Schematic reconstructions of lesions. Darker regions represent more overlap between animals. N = 10. E, Representative confocal images (maximum intensity projections) of IB4 and tomato lectin labeling of vasculature in peri-infarct and homotopic contralateral cortex. Top, Schematic represents sampled regions (red boxes). F, Example of binarization and skeletonization of vessels labeled with tomato lectin. Infarcts increased the area fraction of IB4+ (G) and tomato lectin+ (H) vessels in peri-infarct cortex relative to the intact contralateral cortex. **p < 0.01; ***p < 0.001; contralateral versus peri-infarct (t tests). Vascular length (I) and branch density (J), measured from tomato lectin-labeled vessels, were also significantly increased in peri-infarct cortex relative to contralateral cortex. **p ≤ 0.007, t(18) ≥ 3.04 (t tests). K–M, Area fraction, vascular length, and branch density were all strongly correlated with one another. Measurements are from tomato lectin-labeled vessels. N–Q, Area fraction, vascular length, and branch density in peri-infarct cortex were positively, but not significantly, correlated with behavioral performance on day 28 after infarct. O–Q, Measurements from tomato lectin-labeled vessels.
Figure 11.
Figure 11.
Reestablishment of peri-infarct blood flow is associated with recovery of motor function. A, Time-lapse MESI of cortical blood flow before and after photothrombosis. B, Correlations between peri-infarct parenchymal blood flow and motor performance on the single-seed reaching task by day. Data from each plot are from the time point indicated above in A. Blood flow was significantly correlated with motor performance during the first week after infarct. Positive associations on days 14 and 21 did not reach significance. C, The time courses of recovery of peri-infarct blood flow and motor function showed a strong temporal association. D, Peri-infarct blood flow and behavioral performance were highly correlated across all days. E, Acute (day 2) peri-infarct blood flow was not predictive of day 28 motor performance.
Figure 12.
Figure 12.
Transient activation of transcriptional programs related to vascular remodeling in peri-infarct endothelial cells in a mouse stroke model. Volcano plot showing upregulated (green) and downregulated (red) genes in peri-infarct endothelial cells 3 d (A) and 30 d (B) after middle cerebral artery occlusion relative to sham animals. C, Heatmap comparison of enriched gene ontology terms among upregulated genes between 3 and 30 d after ischemia. Clustering is based on overlap of gene sets. Heatmap comparisons of expression of angiogenesis-related (D) and extracellular matrix organization-related genes (E) at 3 and 30 d after ischemia relative to sham. Genes are sorted by fold change relative to sham at 3 d. Fold change was not calculated for one gene (COL11A1, black bars) at 30 d after ischemia because of very low read counts.

Similar articles

Cited by

References

    1. Blinder P, Shih AY, Rafie C, Kleinfeld D (2010) Topological basis for the robust distribution of blood to rodent neocortex. Proc Natl Acad Sci USA 107:12670–12675. 10.1073/pnas.1007239107 - DOI - PMC - PubMed
    1. Brown CE, Aminoltejari K, Erb H, Winship IR, Murphy TH (2009) In vivo voltage-sensitive dye imaging in adult mice reveals that somatosensory maps lost to stroke are replaced over weeks by new structural and functional circuits with prolonged modes of activation within both the peri-infarct zone and distant sites. J Neurosci 29:1719–1734. 10.1523/JNEUROSCI.4249-08.2009 - DOI - PMC - PubMed
    1. Brown CE, Li P, Boyd JD, Delaney KR, Murphy TH (2007) Extensive turnover of dendritic spines and vascular remodeling in cortical tissues recovering from stroke. J Neurosci 27:4101–4109. 10.1523/JNEUROSCI.4295-06.2007 - DOI - PMC - PubMed
    1. Buga AM, Margaritescu C, Scholz CJ, Radu E, Zelenak C, Popa-Wagner A (2014) Transcriptomics of post-stroke angiogenesis in the aged brain. Front Aging Neurosci 6:44–20. 10.3389/fnagi.2014.00044 - DOI - PMC - PubMed
    1. Carmeliet P, Tessier-Lavigne M (2005) Common mechanisms of nerve and blood vessel wiring. Nature 436:193–200. 10.1038/nature03875 - DOI - PubMed

Publication types