Observational Study
. 2020 Sep 1;11(1):4376.
doi: 10.1038/s41467-020-18314-x.

Tracking the COVID-19 pandemic in Australia using genomics

Affiliations
Observational Study

Tracking the COVID-19 pandemic in Australia using genomics

Torsten Seemann et al. Nat Commun. .

Abstract

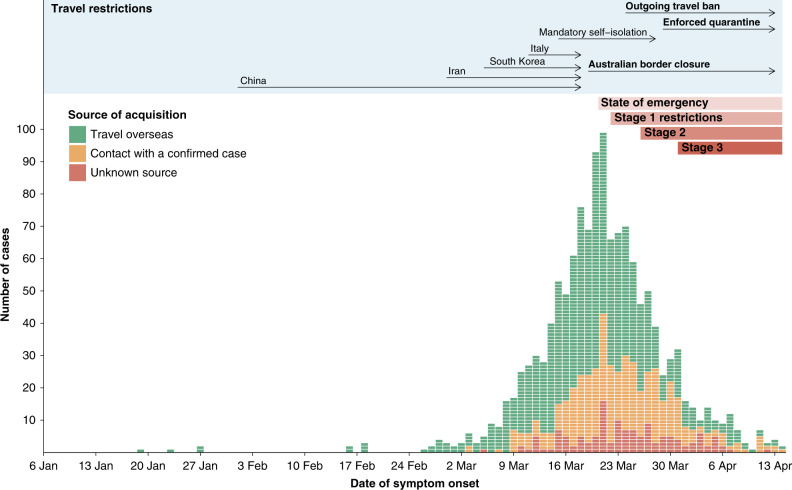
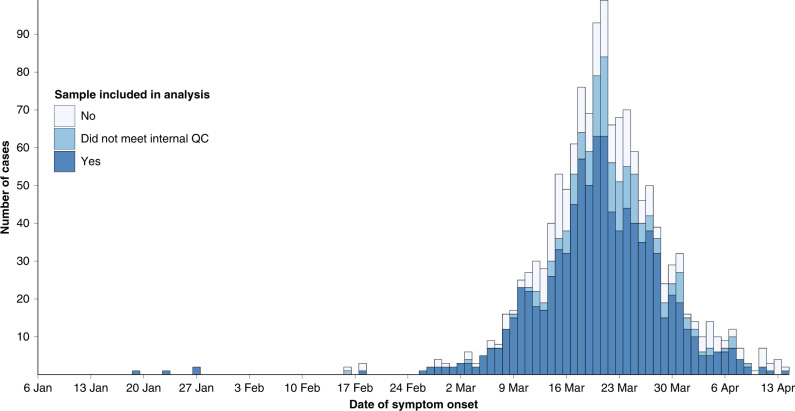
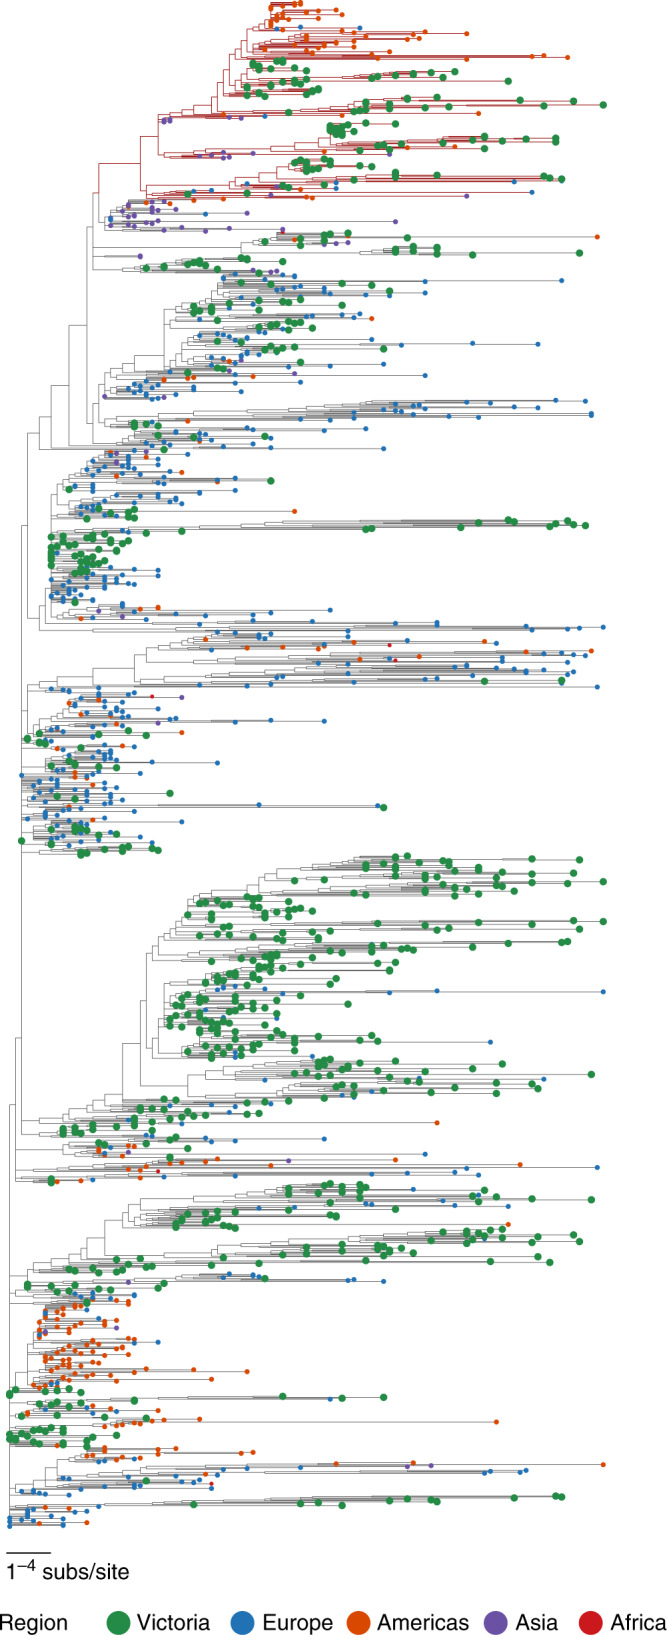
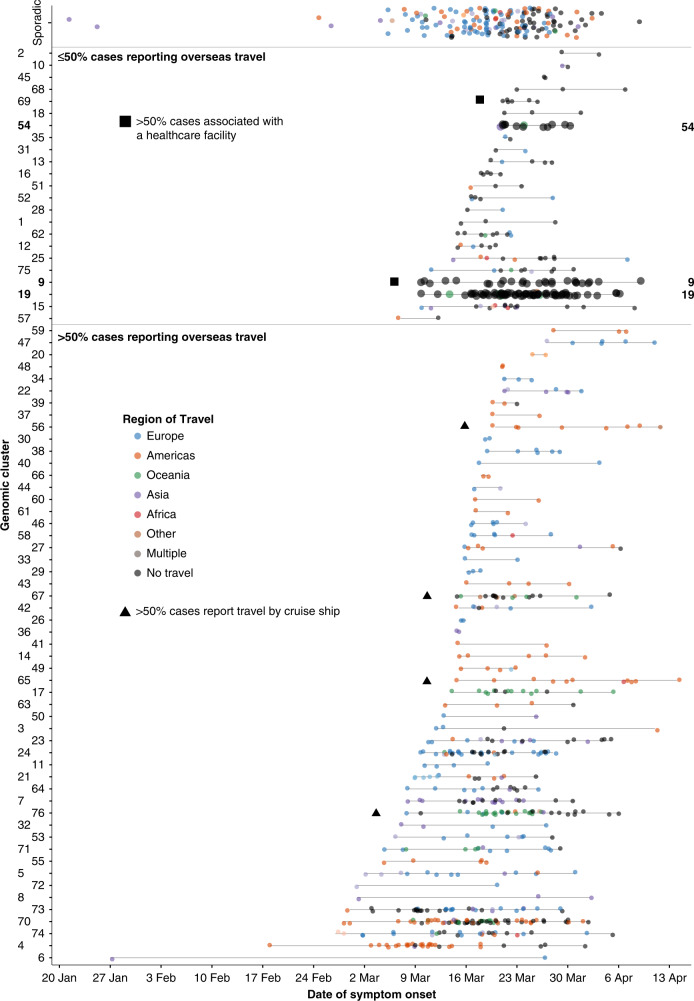
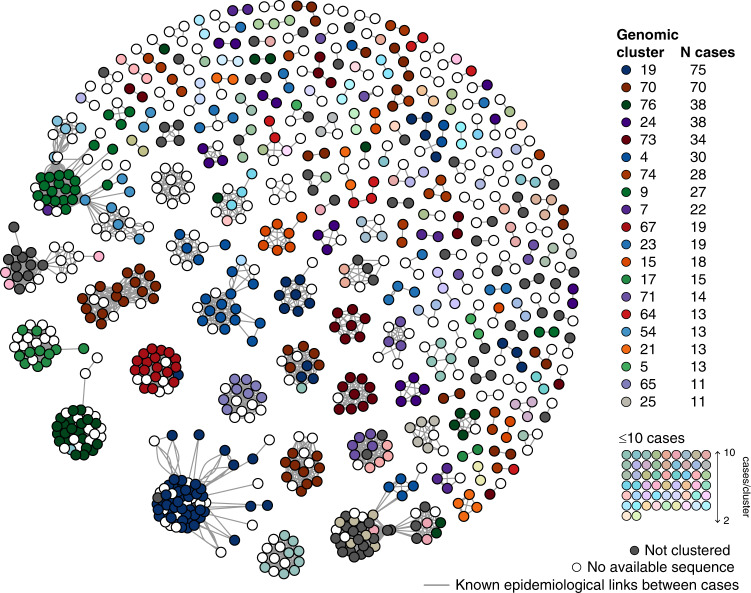
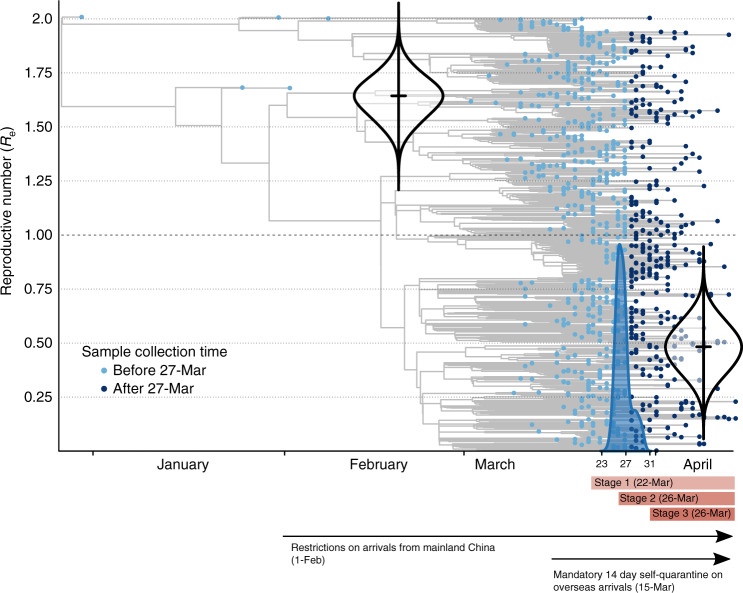
Genomic sequencing has significant potential to inform public health management for SARS-CoV-2. Here we report high-throughput genomics for SARS-CoV-2, sequencing 80% of cases in Victoria, Australia (population 6.24 million) between 6 January and 14 April 2020 (total 1,333 COVID-19 cases). We integrate epidemiological, genomic and phylodynamic data to identify clusters and impact of interventions. The global diversity of SARS-CoV-2 is represented, consistent with multiple importations. Seventy-six distinct genomic clusters were identified, including large clusters associated with social venues, healthcare and cruise ships. Sequencing sequential samples from 98 patients reveals minimal intra-patient SARS-CoV-2 genomic diversity. Phylodynamic modelling indicates a significant reduction in the effective viral reproductive number (Re) from 1.63 to 0.48 after implementing travel restrictions and physical distancing. Our data provide a concrete framework for the use of SARS-CoV-2 genomics in public health responses, including its use to rapidly identify SARS-CoV-2 transmission chains, increasingly important as social restrictions ease globally.


Conflict of interest statement

The authors declare no competing interests.

Figures

Fig. 1
Fig. 1. Epidemic curve of the coronavirus disease (COVID-19) cases and implementation of public health interventions.
Cases were categorized as (i) travel overseas if reporting travel in the 14 days prior to symptom onset or (ii) contact with a confirmed case if no overseas travel reported and case contact occurred within the same time period. Cases are plotted by reported date of symptom onset, or if unknown, date of initial specimen collection. The state of emergency declaration introduced a ban on large gatherings and mandatory social distancing of 4 m2 per person. Stage 1 restrictions introduced a shutdown of nonessential services, followed shortly after by early commencement of school holidays. Stage 2 restrictions expanded shutdown of nonessential services, and Stage 3 introduced an enforceable stay-at-home order and limited non-household gatherings to two people.
Fig. 2
Fig. 2. Samples included in genomic analysis.
Epidemic curve of sequenced patient samples by date of symptom onset, colored by the outcome of sequencing after quality control (QC) procedures applied. Dark blue represents successful sequencing meeting QC parameters; white represents failed sequencing; light blue represents sequences with severe acute respiratory syndrome coronavirus 2 (SARS-CoV-2) reads that did not meet internal QC parameters, but may still yield useful phylogenetic data for analysis.
Fig. 3
Fig. 3. Phylogenetic tree of Victorian severe acute respiratory syndrome coronavirus 2 (SARS-CoV-2) sequences with international context.
Maximum likelihood tree of Victorian SARS-CoV-2 sequences and a subset random selection of international sequences representing global genomic diversity, colored by region of origin. Victorian isolates, in green, have been emphasized through increased size, and represent the global diversity of the sampled SARS-CoV-2 population. Branch color represents Pangolin lineage A (red) or B (black).
Fig. 4
Fig. 4. Timeline and key epidemiological features of Victorian severe acute respiratory syndrome coronavirus 2 (SARS-CoV-2) genomic clusters.
Each case in a genomic cluster is represented by a dot, colored by location of travel. Cases are plotted by onset date on the X axis, and genomic cluster on the Y axis. Genomic clusters discussed in the text are enlarged and marked with their cluster number to the right.
Fig. 5
Fig. 5. Network analysis demonstrating concordance between genomic and epidemiological clusters.
Each filled dot (node) represents a Victorian coronavirus disease (COVID-19) case with a documented epidemiological link to another Victorian case. Edges (links) between nodes (cases) represent each epidemiological link. Cases are placed closer to each other within the network as the density (number) of linkages between them increases, with cases in the same epidemiological cluster forming a spatially distinct group. Cases are colored by genomic cluster; cases without a sequence included in primary analysis are colored white.
Fig. 6
Fig. 6. Phylodynamic estimates of the reproductive number (Re).
A birth–death skyline model was fit, where Re is allowed to change at a single time point determined by the data. The X axis represents time, from the molecular estimate of the origin of the sampled diversity, around late December 2019 (95% credible interval, CI: 18th December to 30th December) to the date of the most recently collected genome in 13 April. The blue shows the posterior distribution of the timing of the most significant change in Re, around 27 March (CI: 23–31 March). The Y axis represents Re, and the violin plots show the posterior distribution of this parameter before and after the change in Re, with a mean of 1.63 (CI: 1.45–1.80) and 0.48 (CI:0.27–0.69), respectively. The phylogenetic tree in the background is a maximum clade credibility tree with the tips colored according to whether they were sampled before or after March 27th.

References

    1. Zhou P, et al. A pneumonia outbreak associated with a new coronavirus of probable bat origin. Nature. 2020;579:270–273. doi: 10.1038/s41586-020-2012-7. - DOI - PMC - PubMed
    1. Zhu N, et al. A novel coronavirus from patients with pneumonia in China, 2019. N. Engl. J. Med. 2020;382:727–733. doi: 10.1056/NEJMoa2001017. - DOI - PMC - PubMed
    1. Corman VM, et al. Detection of 2019 novel coronavirus (2019-nCoV) by real-time RT-PCR. Eurosurveillance. 2020;25:2000045. - PMC - PubMed
    1. Patel R, et al. Report from the American Society for Microbiology COVID-19 International Summit, 23 March 2020: value of diagnostic testing for SARS–CoV-2/COVID-19. mBio. 2020;11:e00722–20. doi: 10.1128/mBio.00722-20. - DOI - PMC - PubMed
    1. Forster P, Forster L, Renfrew C, Forster M. Phylogenetic network analysis of SARS-CoV-2 genomes. Proc. Natl Acad. Sci. USA. 2020;117:9241–9243. doi: 10.1073/pnas.2004999117. - DOI - PMC - PubMed

Publication types

MeSH terms