

The European Union Summary Report on Antimicrobial Resistance in zoonotic and indicator bacteria from humans, animals and food in 2017/2018
- PMID: 32874244
- PMCID: PMC7448042
- DOI: 10.2903/j.efsa.2020.6007
The European Union Summary Report on Antimicrobial Resistance in zoonotic and indicator bacteria from humans, animals and food in 2017/2018
Abstract
Data on antimicrobial resistance (AMR) in zoonotic and indicator bacteria from humans, animals and food are collected annually by the EU Member States (MSs), jointly analysed by EFSA and ECDC and reported in a yearly EU Summary Report. The annual monitoring of AMR in animals and food within the EU is targeted at selected animal species corresponding to the reporting year. The 2017 monitoring specifically focussed on pigs and calves under 1 year of age, as well as their derived carcases/meat, while the monitoring performed in 2018 specifically focussed on poultry and their derived carcases/meat. Monitoring and reporting of AMR in 2017/2018 included data regarding Salmonella, Campylobacter and indicator Escherichia coli isolates, as well as data obtained from the specific monitoring of ESBL-/AmpC-/carbapenemase-producing E. coli isolates. Additionally, some MSs reported voluntary data on the occurrence of meticillin-resistant Staphylococcus aureus in animals and food, with some countries also providing data on antimicrobial susceptibility. This report provides, for the first time, an overview of the main findings of the 2017/2018 harmonised AMR monitoring in the main food-producing animal populations monitored, in related carcase/meat samples and in humans. Where available, data monitoring obtained from pigs, calves/cattle, broilers, laying hens and turkeys, as well as from carcase/meat samples and humans were combined and compared at the EU level, with particular emphasis on multiple drug resistance, complete susceptibility and combined resistance patterns to critically important antimicrobials, as well as Salmonella and E. coli isolates exhibiting presumptive ESBL-/AmpC-/carbapenemase-producing phenotypes. The outcome indicators for AMR in food-producing animals, such as complete susceptibility to the harmonised panel of antimicrobials in E. coli and the prevalence of ESBL-/AmpC-producing E. coli have been also specifically analysed over the period 2014-2018.
Keywords: ESBL; MRSA; antimicrobial resistance; indicator bacteria; zoonotic bacteria.
© European Food Safety Authority and European Centre for Disease Prevention and Control, 2020. EFSA Journal published by John Wiley and Sons Ltd on behalf of European Food Safety Authority.
Figures
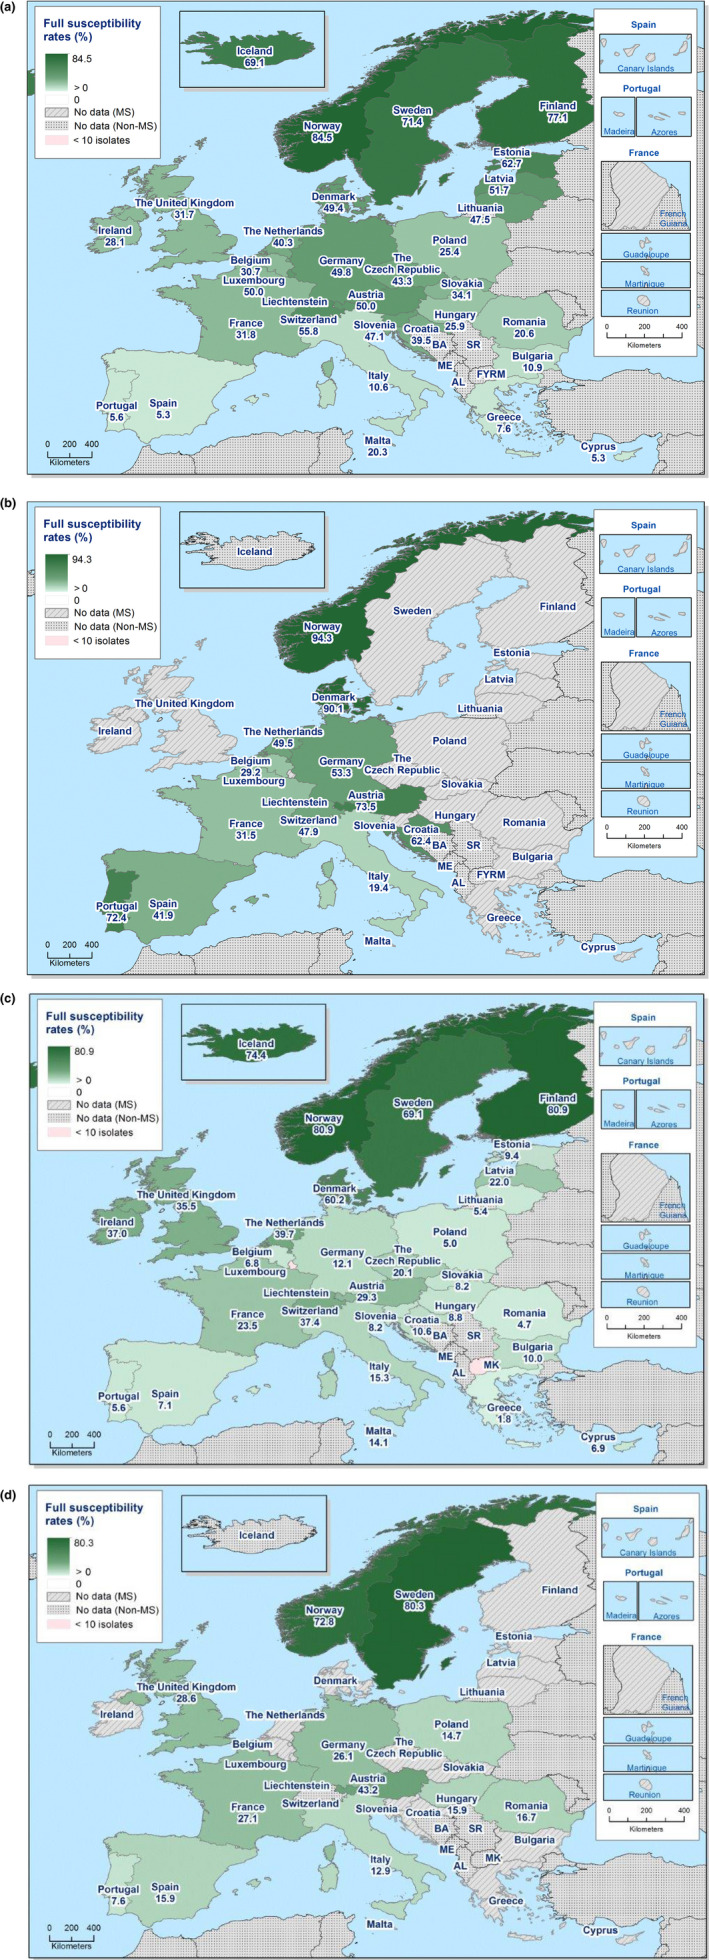
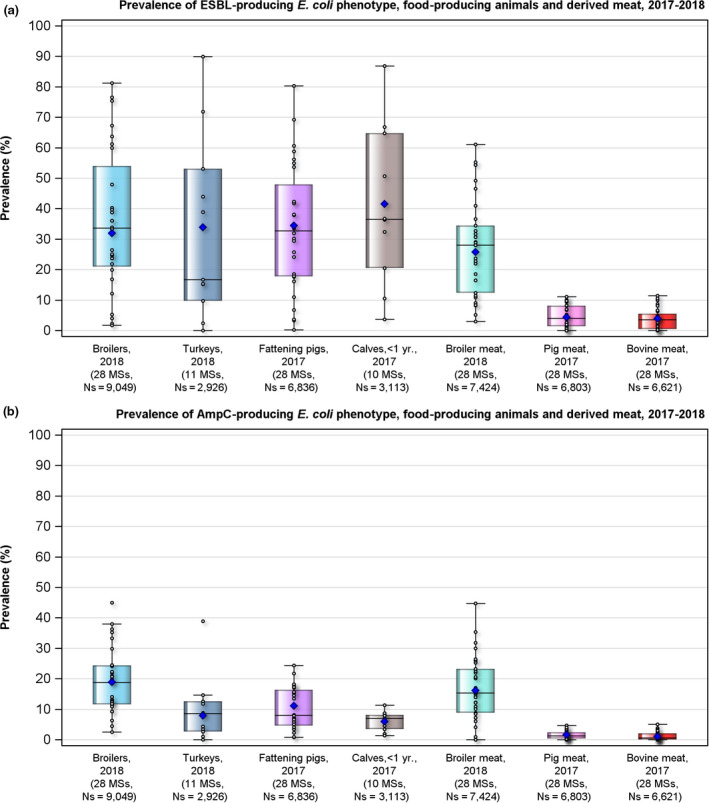
Horizontal line represents median, and blue diamond represents the resistance at the reporting‐MS level.
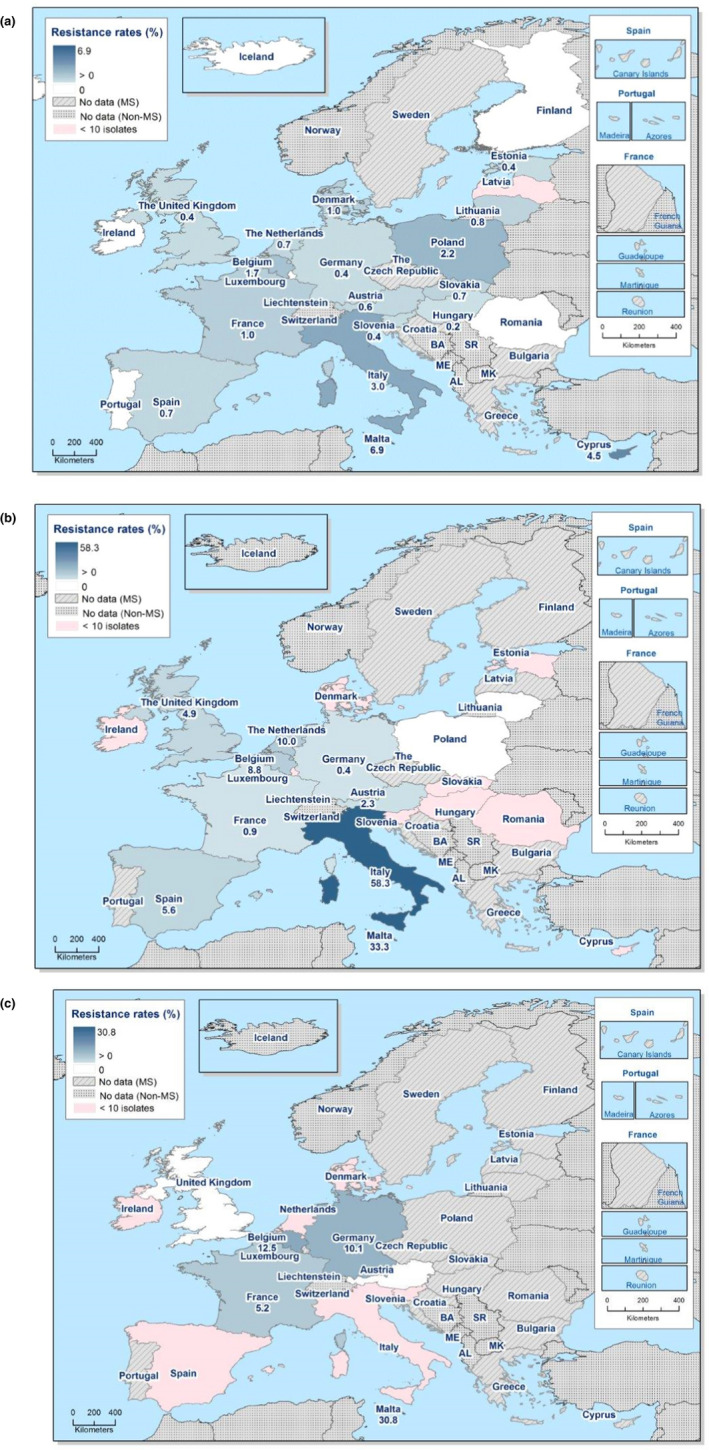
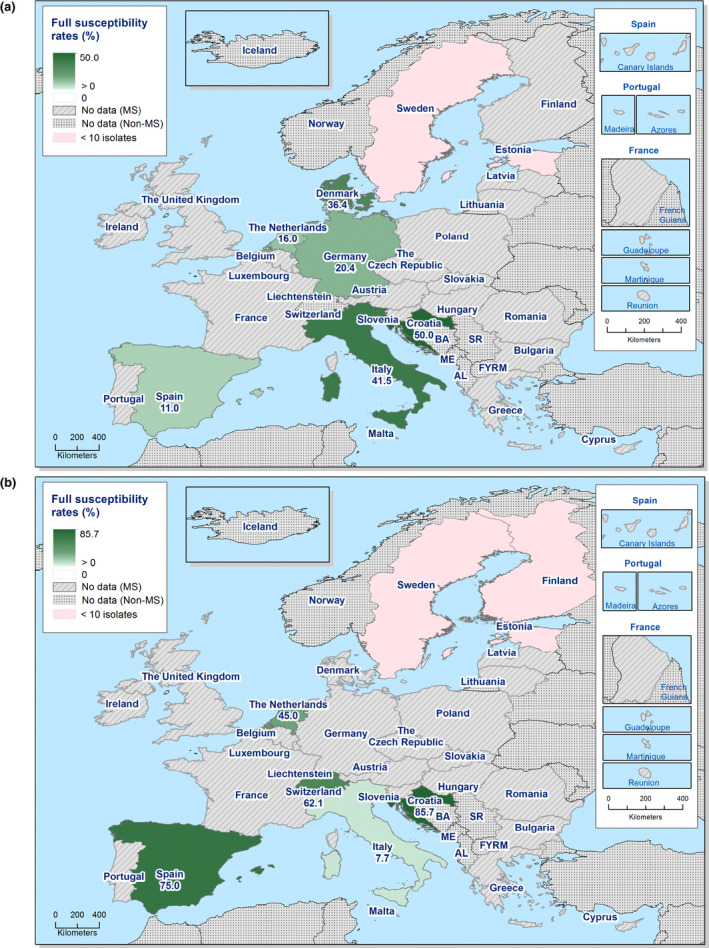
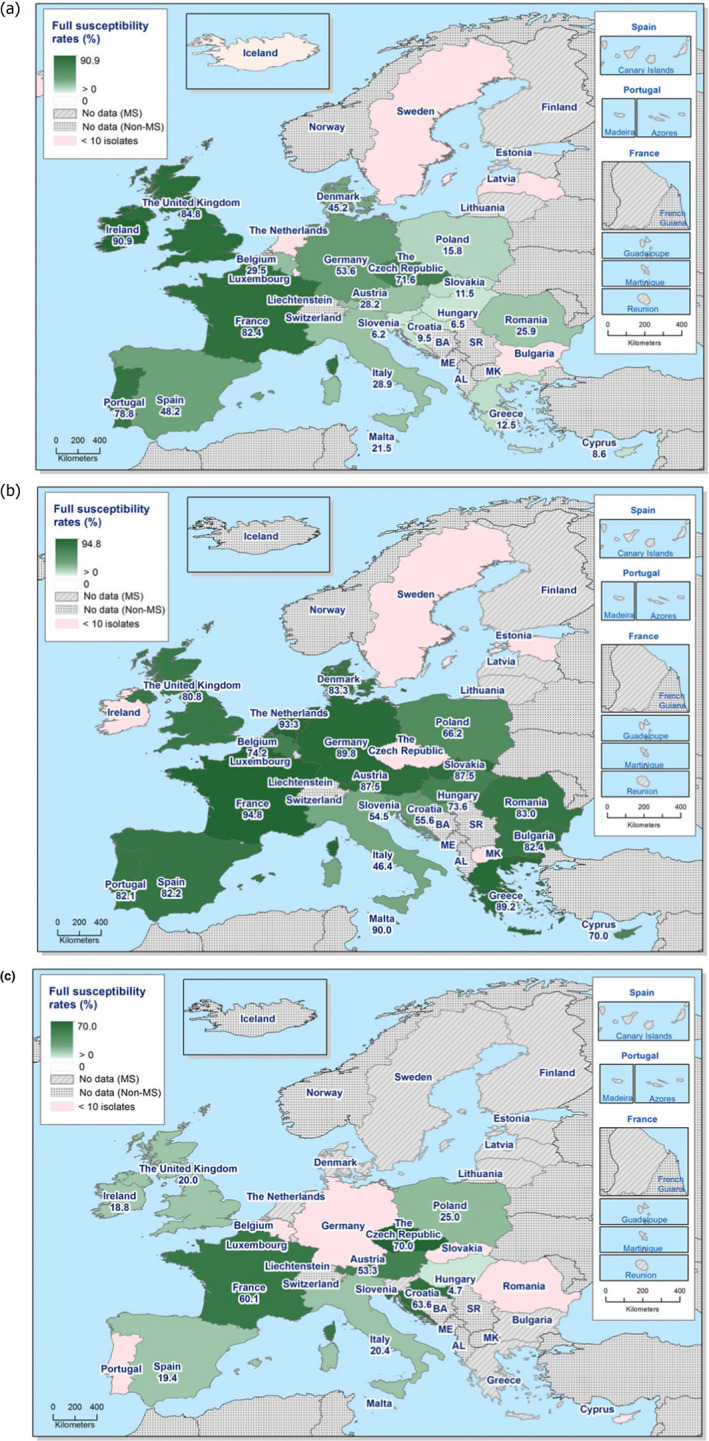
Pink indicates less than 10 isolates tested.
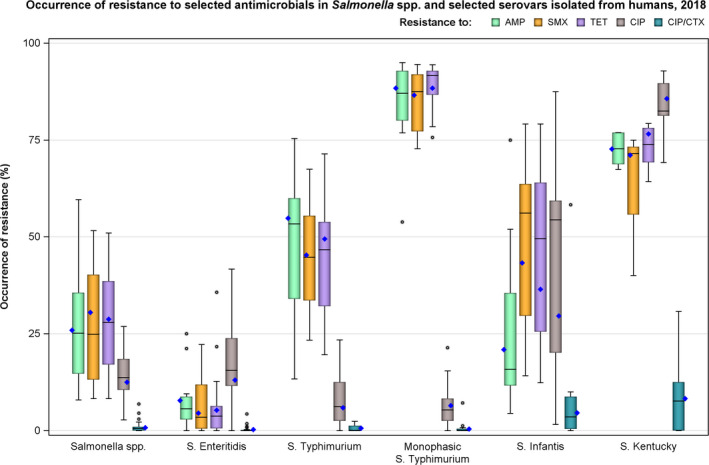
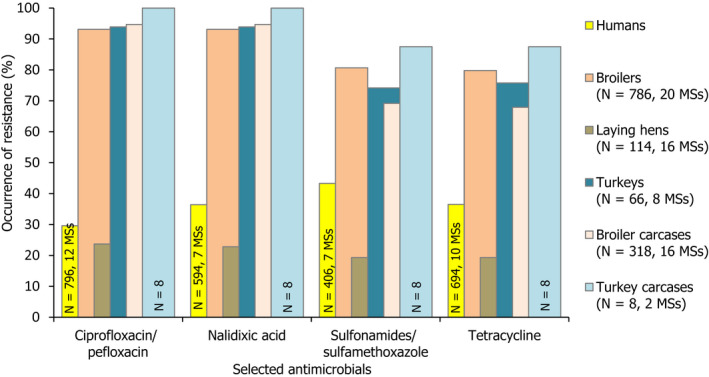
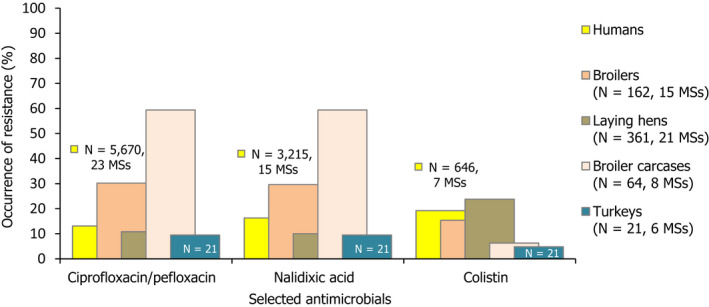
AMP : ampicillin,SMX : sulfamethoxazole,TET : tetracycline,CIP : ciprofloxacin,CTX : cefotaxime,CIP /CTX : combined ‘microbiological’ resistance to ciprofloxacin and cefotaxime, N: total number of Salmonella spp. reported byMS s. Blue diamond shows resistance at the reporting‐MS group level.
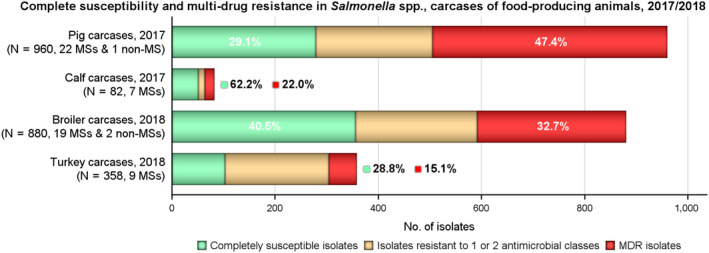
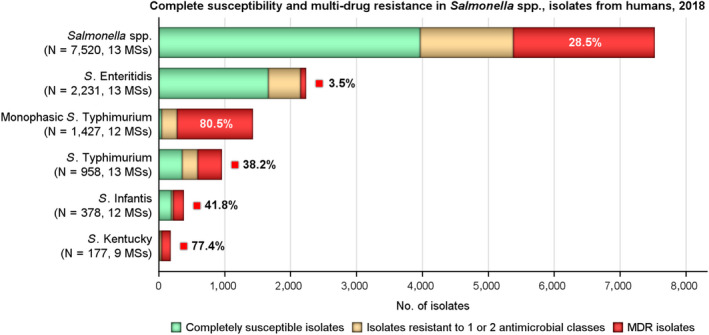
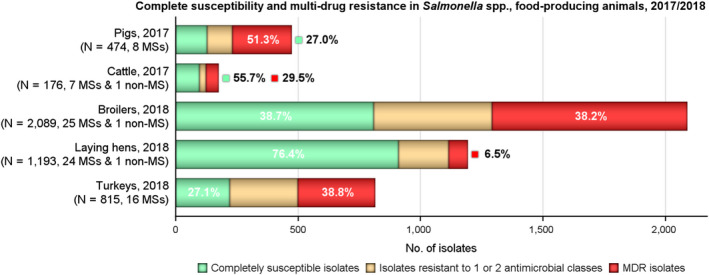
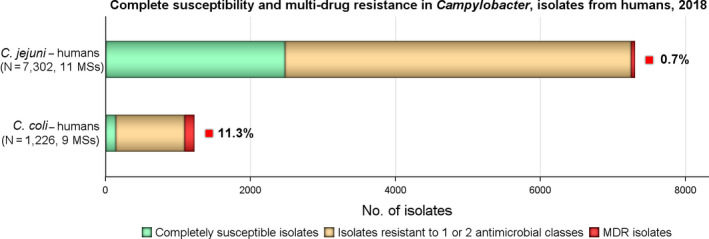
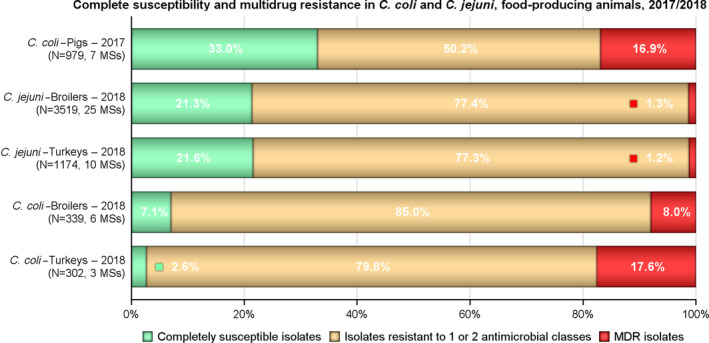
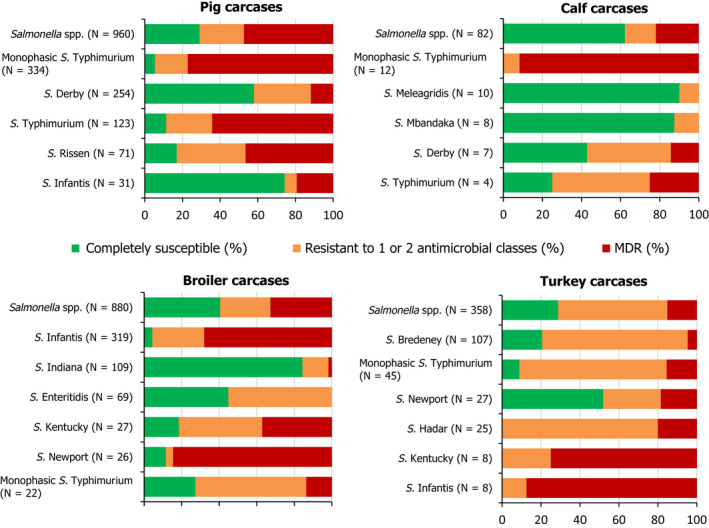
MDR and complete susceptibility levels are also expressed as a percentage; N: total number of Salmonella spp. reported byMS s and non‐MS s.
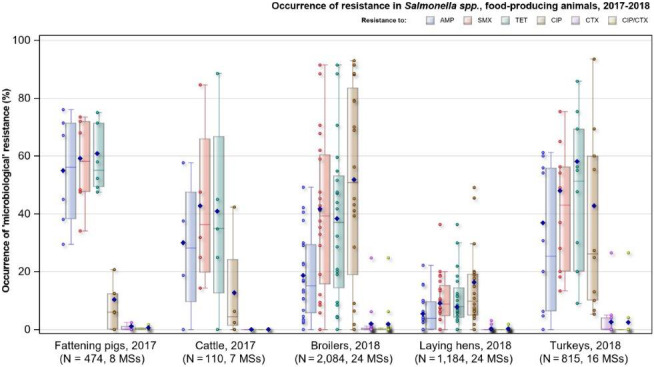
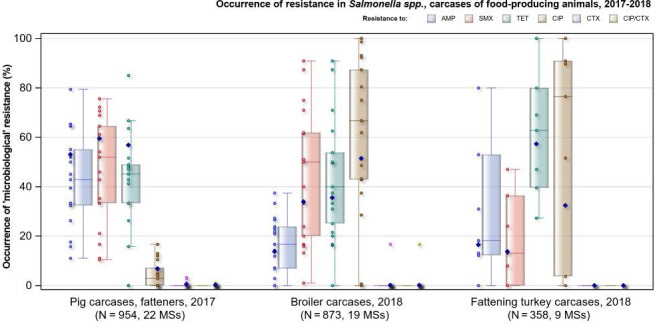
AMP : ampicillin,SMX : sulfamethoxazole,TET : tetracycline,CIP : ciprofloxacin,CTX : cefotaxime,CIP /CTX : combined ‘microbiological’ resistance to ciprofloxacin and cefotaxime, N: total number of Salmonella spp. reported byMS s. Blue diamond shows resistance at the reporting‐MS group level.Note: Member States reporting at least 10 isolates are shown in the graph; all isolates are included in the calculation of resistance at the reporting‐MS group level.
MDR and complete susceptibility are expressed as percentages; N: total number of Salmonella spp. reported byMS s and non‐MS s.
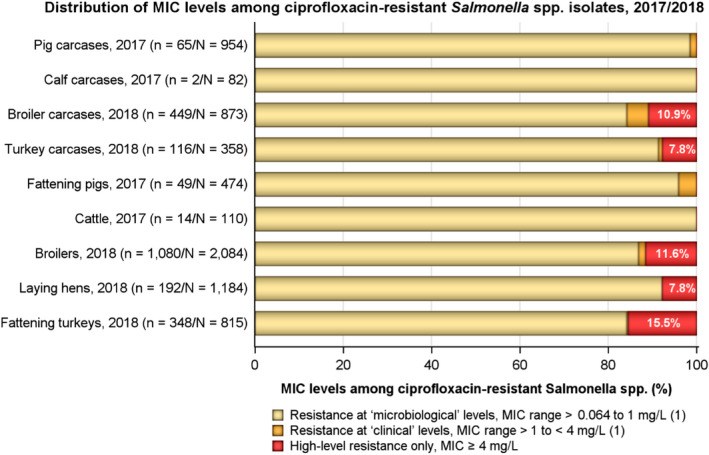
n: Total number of Salmonella spp. exhibiting
CIP resistance (MS s only); N: total number of Salmonella spp. reported byMS s.1In accordance with breakpoints stated in Decision 2013/652/
EU .The proportion of isolates showing high‐level resistance is not included with those exhibiting ‘clinical’ or ‘microbiological’ resistance; similarly, the proportion of isolates showing ‘clinical’ resistance is not included with those displaying ‘microbiological’ resistance. The Figure above excludes one isolate reported from laying hens (by the Republic of North Macedonia), which was ‘microbiologically’ resistant to ciprofloxacin.
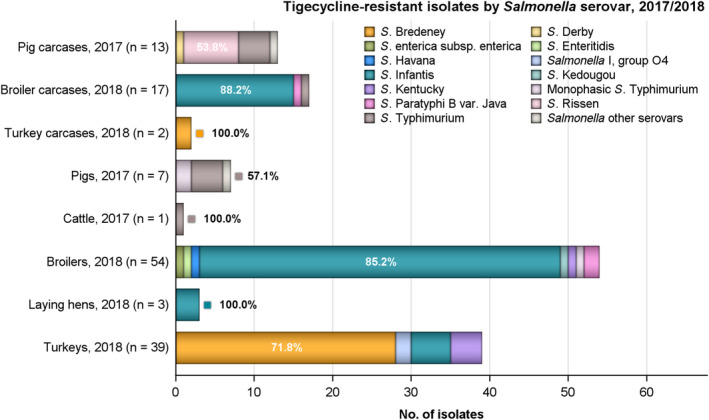
n: Total number of tigecycline‐resistant isolates reported by the
MS s; predominant serovars are also expressed as a percentage.Note: No tigecycline‐resistant isolates were reported among Salmonella spp. from calf carcases (N = 82, 7
MS s).
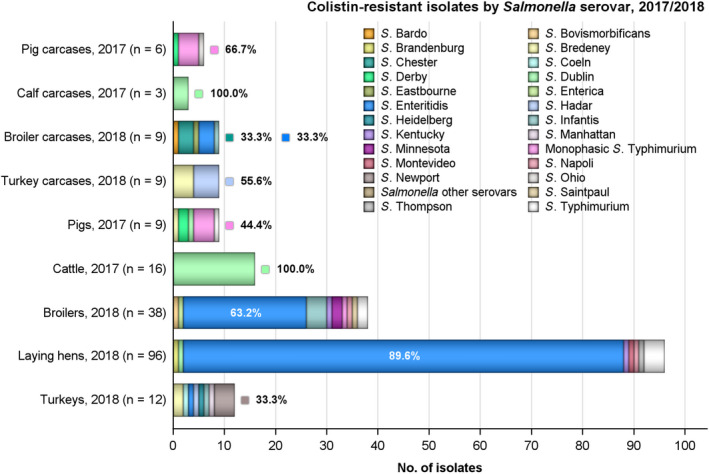
n: Total number of colistin‐resistant isolates reported by the
MS s; predominant serovars are expressed as a percentage.
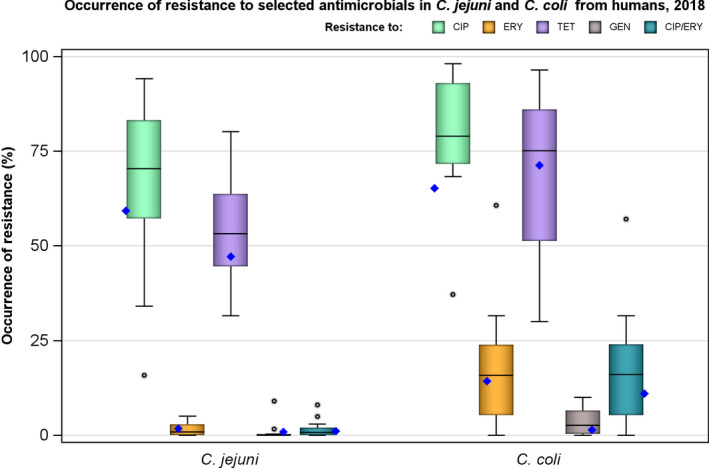
Horizontal line represents median, and blue diamond represents the resistance at the reporting‐MS level.
Note: For Finland, travel information was missing from the
AMR data while from other sources, travel‐associated cases were known to account for 80% of Finnish Campylobacter infections in 2018.
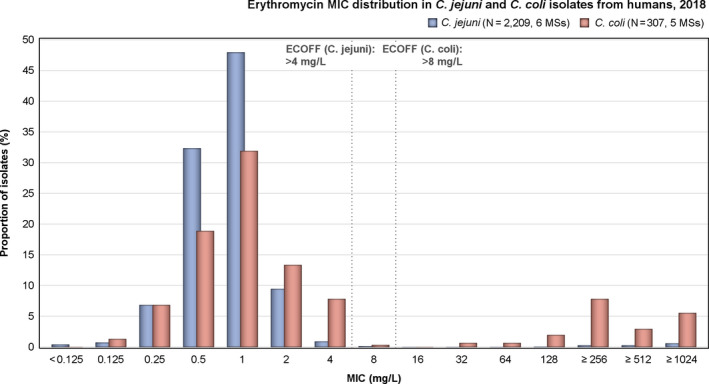
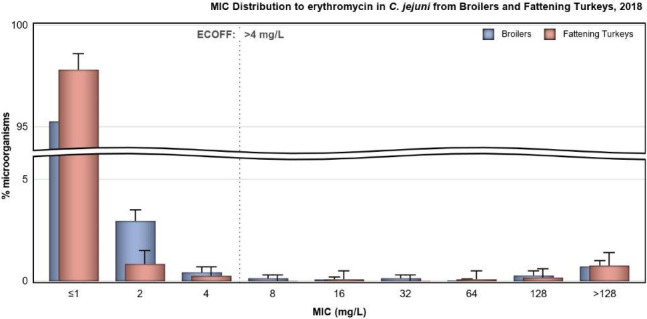
MIC : minimum inhibitory concentration.
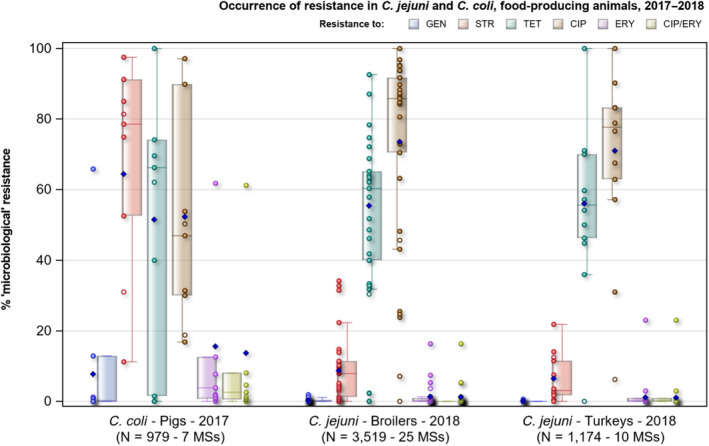
GEN : gentamicin,STR : streptomycin,TET : tetracyclineCIP : ciprofloxacin,ERY : erythromycin,CIP /ERY : combined ‘microbiological’ resistance to ciprofloxacin and erythromycin. N: Total number of isolates reported by all Member States (MS s). Blue diamond: occurrence of resistance at the reporting‐MS group level.
N: Total number of isolates reported by the
EU MS s.
N: Total number of C. jejuni or C. coli isolates exhibiting erythromycin resistance.
*: Includes data on erythromycin‐resistant isolates reported by non‐
EU MS s.
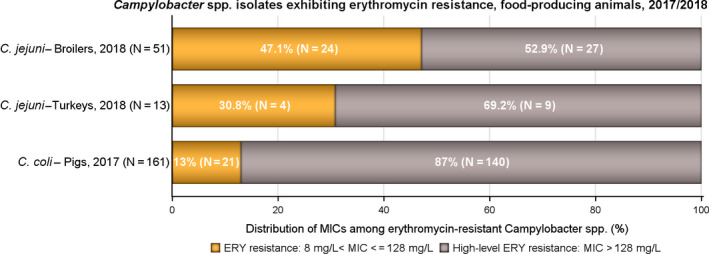
N: Total number of C. jejuni or C. coli isolates exhibiting erythromycin resistance; ERY: erythromycin.
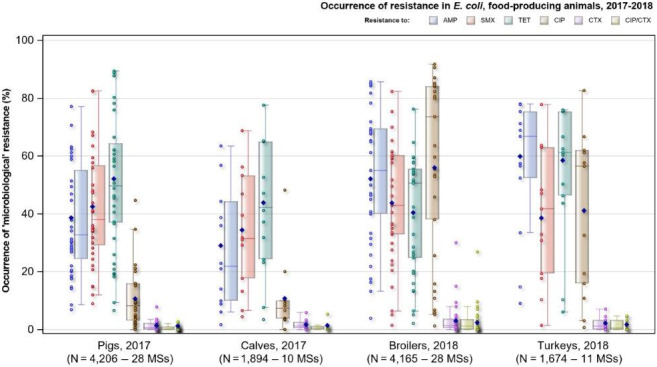
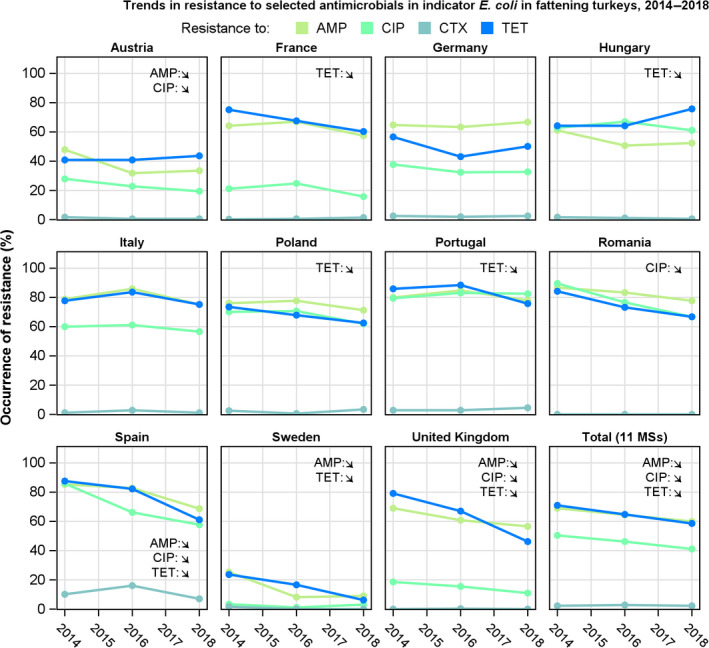
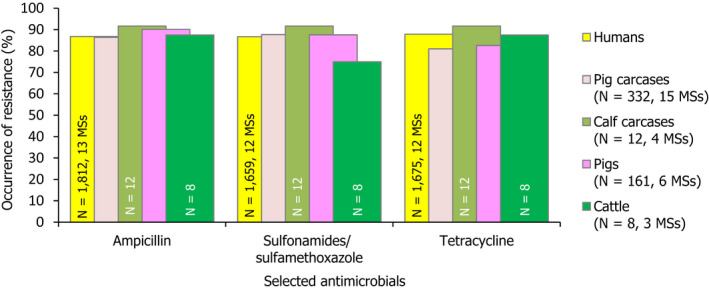
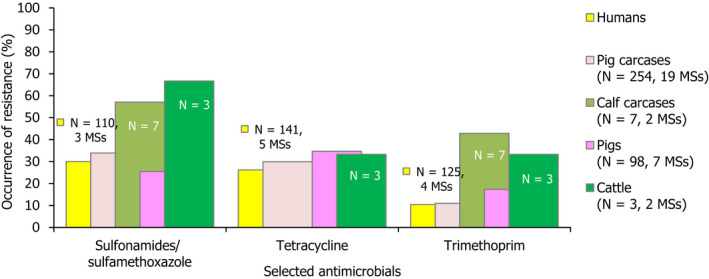
AMP: ampicillin, SMX: sulfamethoxazole, TET: tetracycline, CIP: ciprofloxacin, CTX: cefotaxime, CIP/CTX: combined ‘microbiological’ resistance to ciprofloxacin and cefotaxime, N: total number of E. coli reported by MSs. Blue diamond shows resistance at the reporting‐MS group level.
Note: Member States reporting at least 10 isolates are shown in the graph; all isolates are included in the calculation of resistance at the reporting‐MS group level.
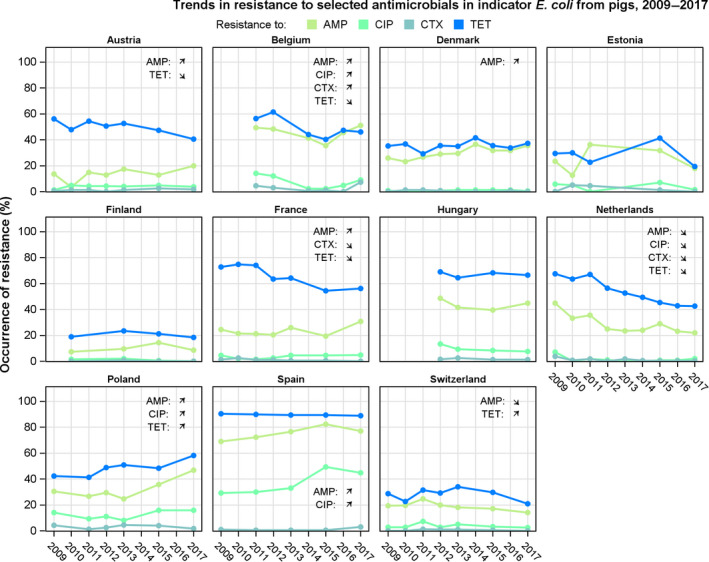
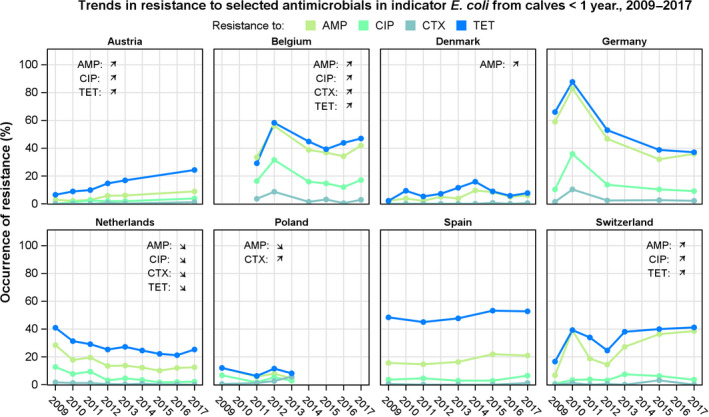
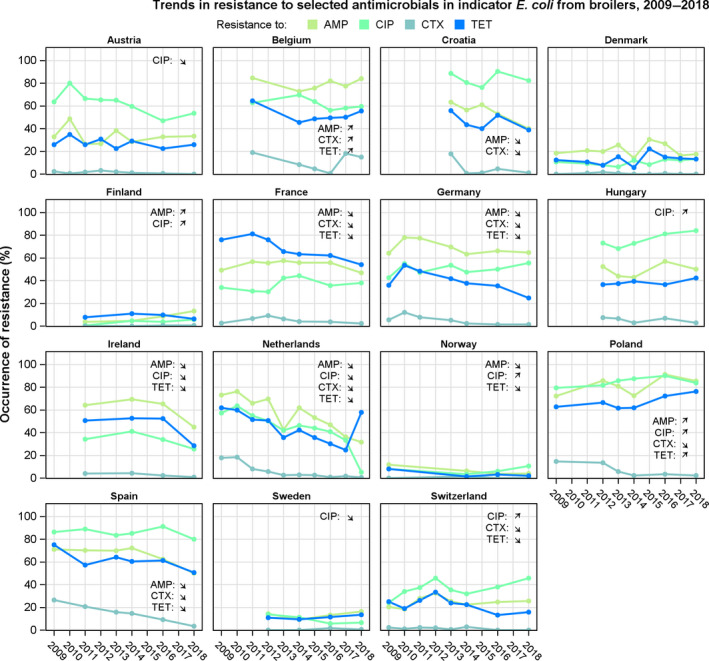
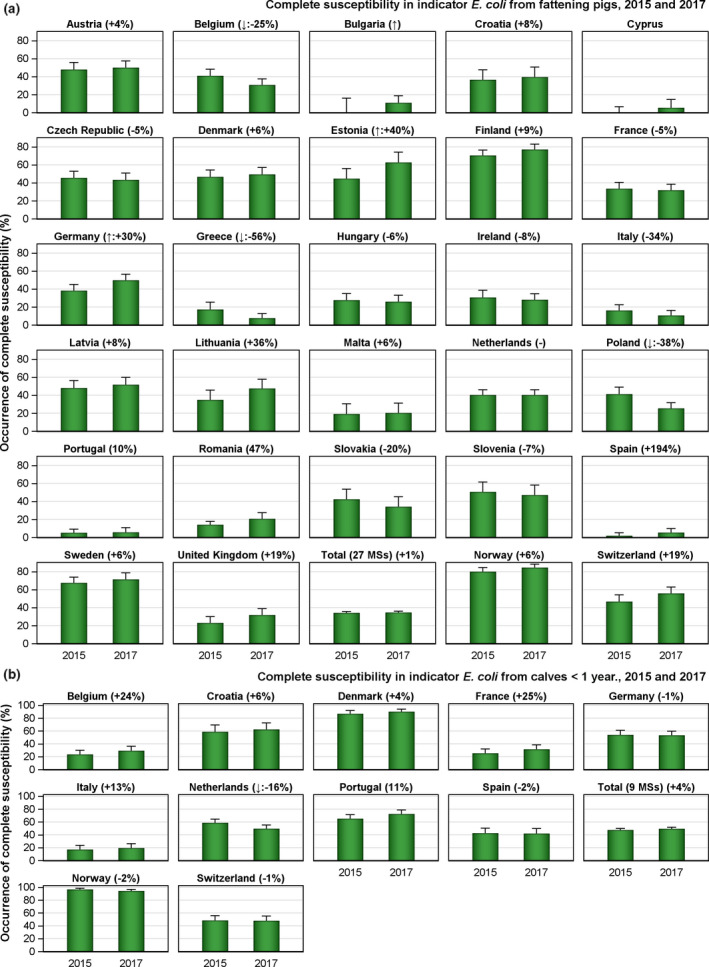
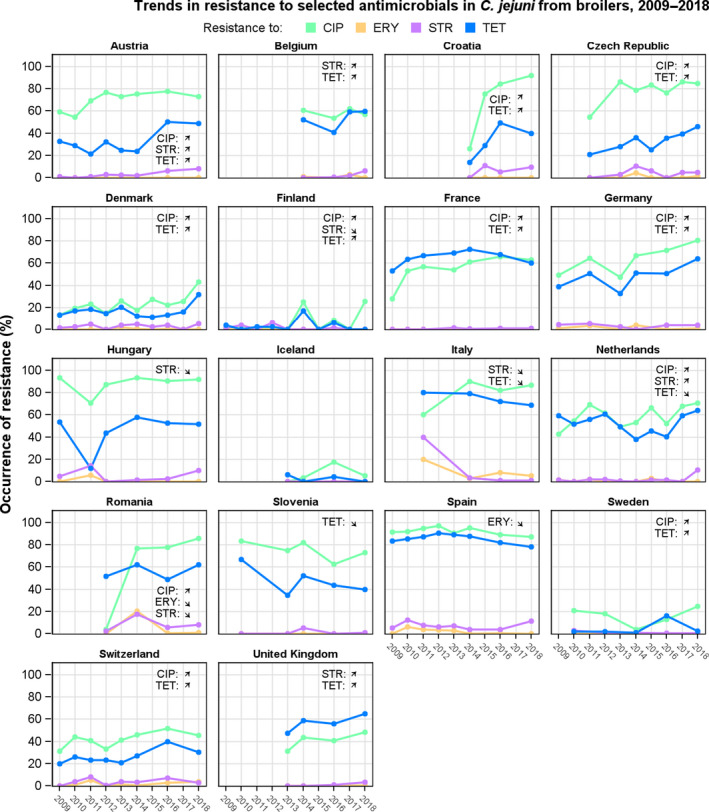
(↓)/(↑): indicates statistically significant trends between 2015 and 2017.
The upper bounds of the 95% confidence interval of the occurrence of complete susceptibility and the rate of change (in %) are also indicated.
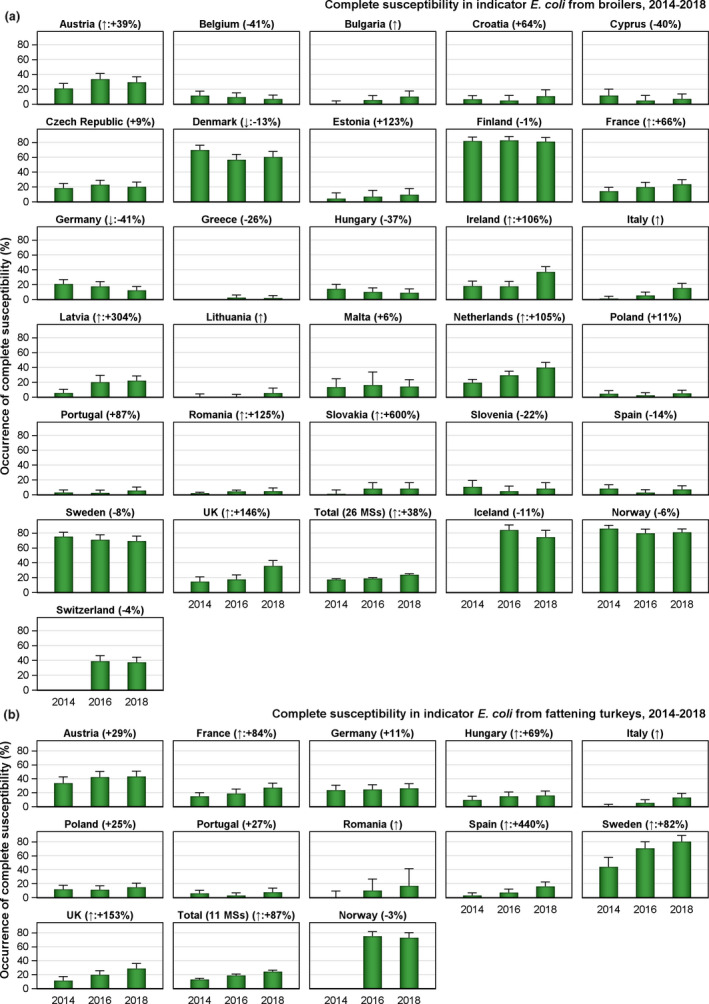
(↓)/(↑): indicates statistically significant trends over the 2014–2018 period. The upper bounds of the 95% confidence interval of the occurrence of complete susceptibility and the rate of change (in %) are also indicated.
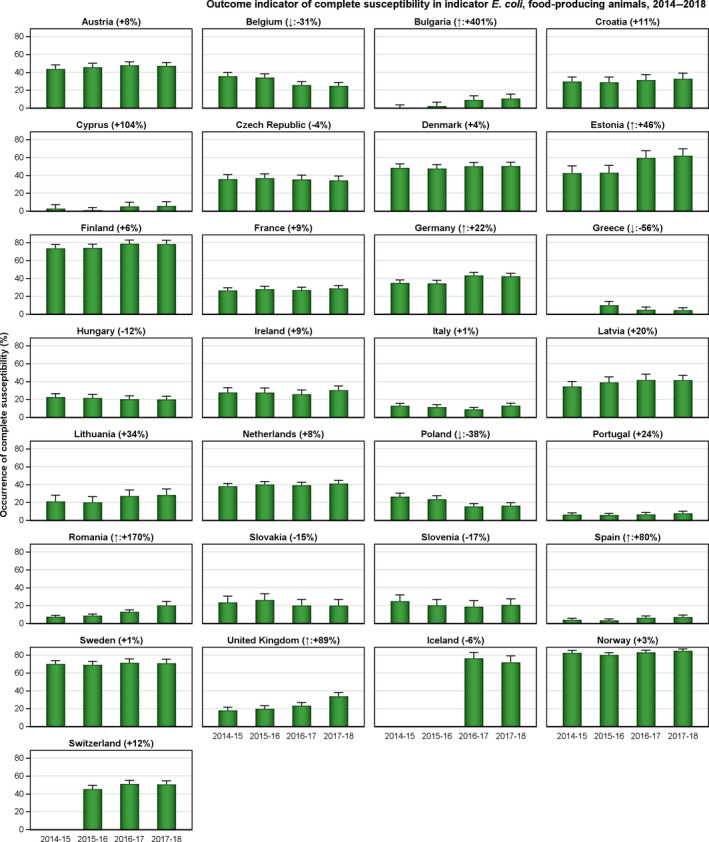
(↓)/(↑): indicates statistically significant decreasing/increasing trends over the 2018–2014 period. The upper bounds of the 95% confidence interval of the OICS and the rate of change (in %) are also indicated.
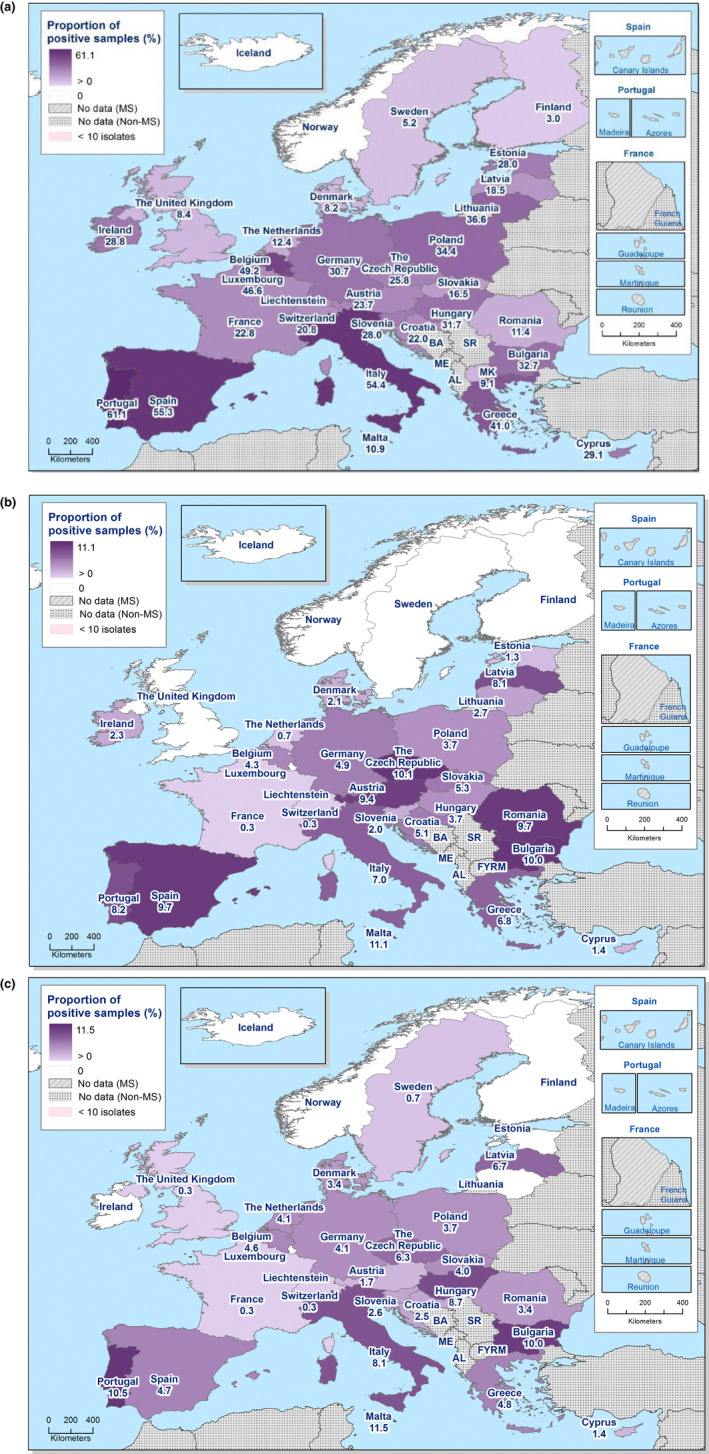
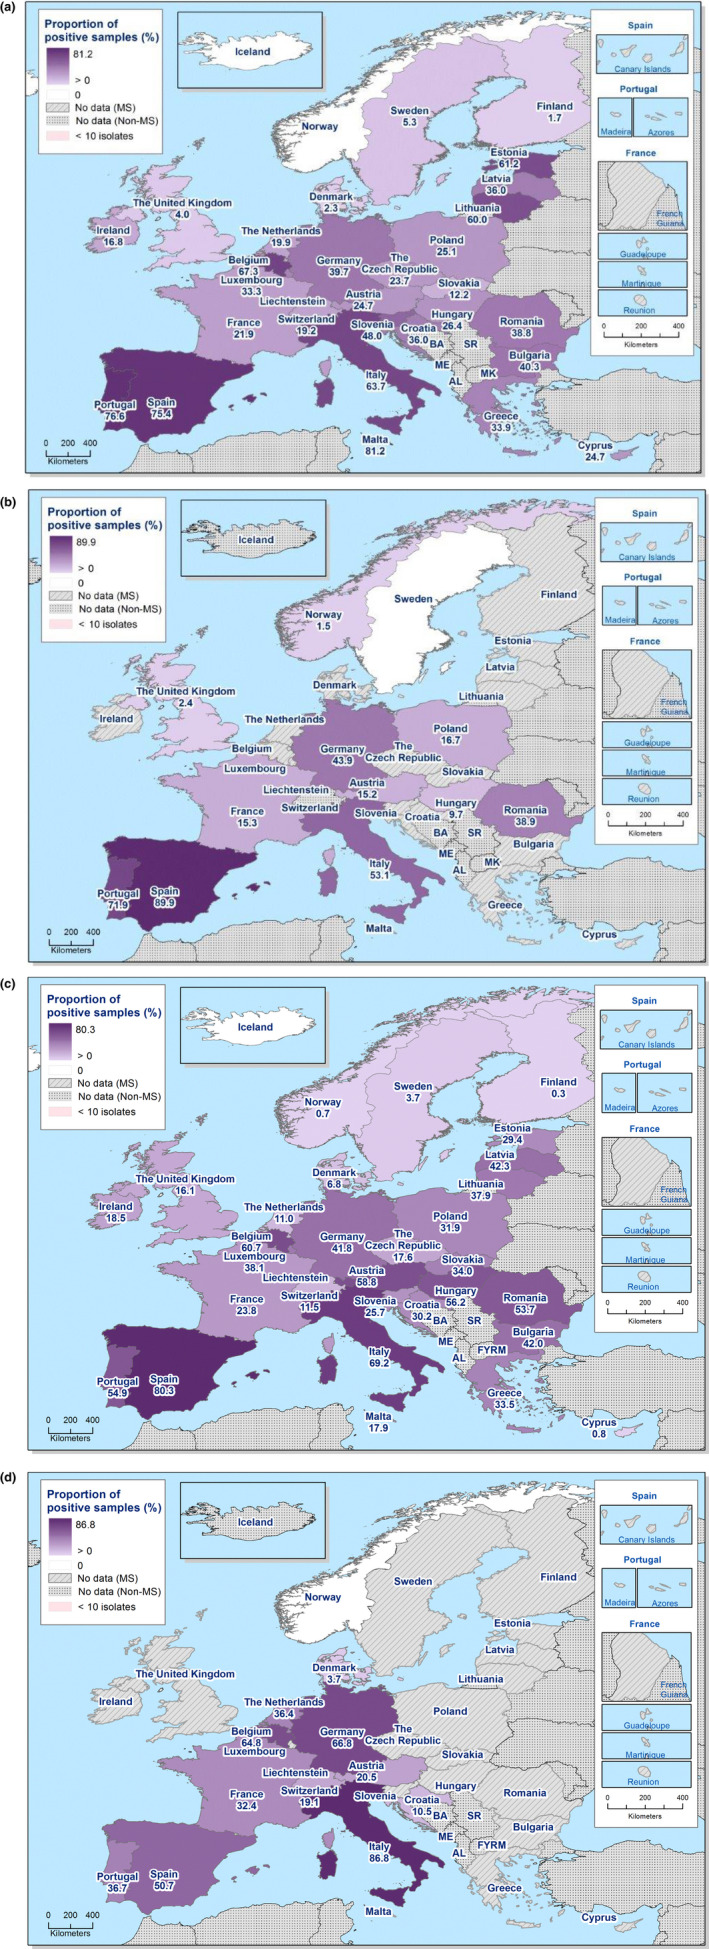
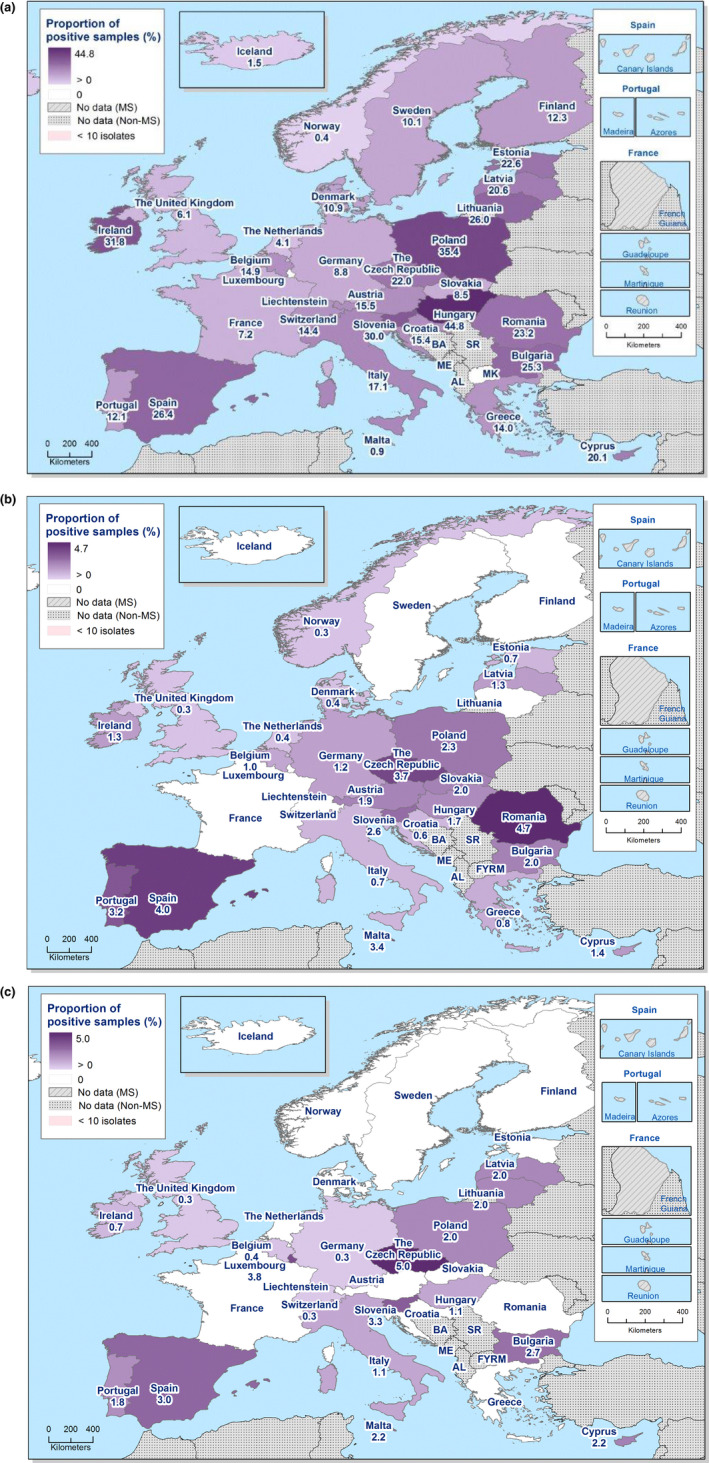
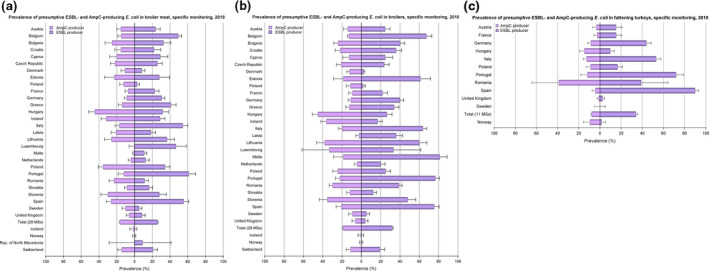
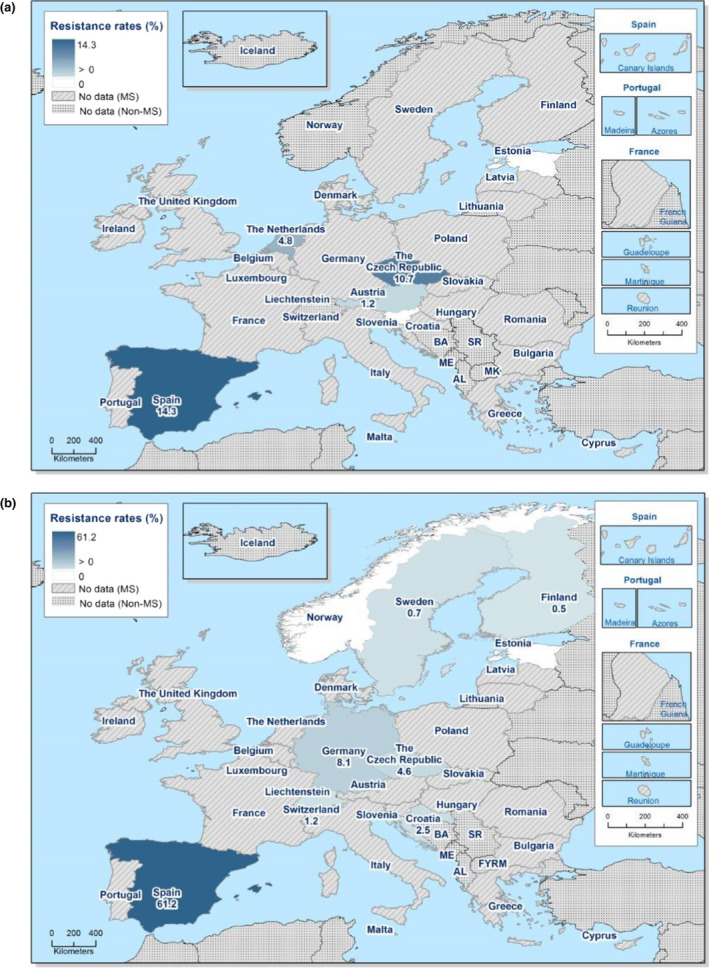
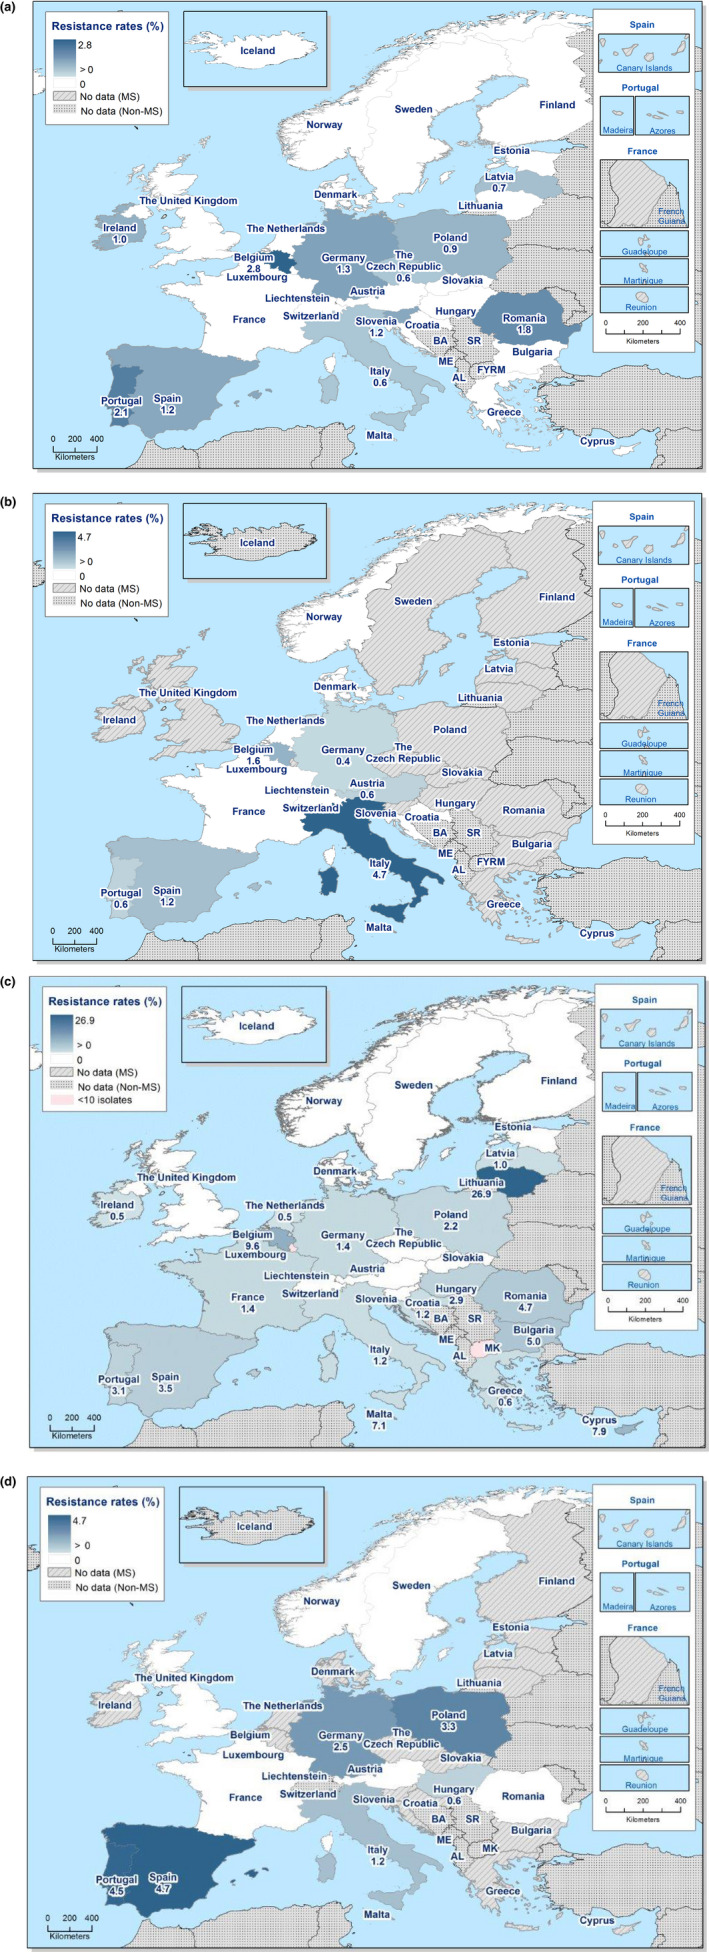
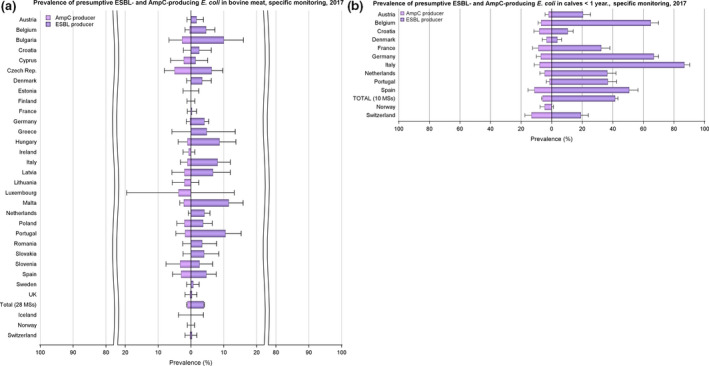
The upper bounds of the 95% confidence interval of the prevalence of ESBL‐ and/or AmpC‐producing E. coli are also indicated.
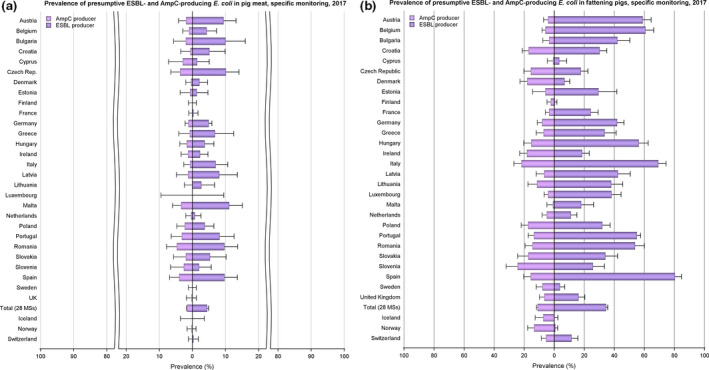
The upper bounds of the 95% confidence interval of the prevalence of ESBL‐ and/or AmpC‐producing E. coli are also indicated.
The upper bounds of the 95% confidence interval of the prevalence of ESBL‐ and/or AmpC‐producing E. coli are also indicated.
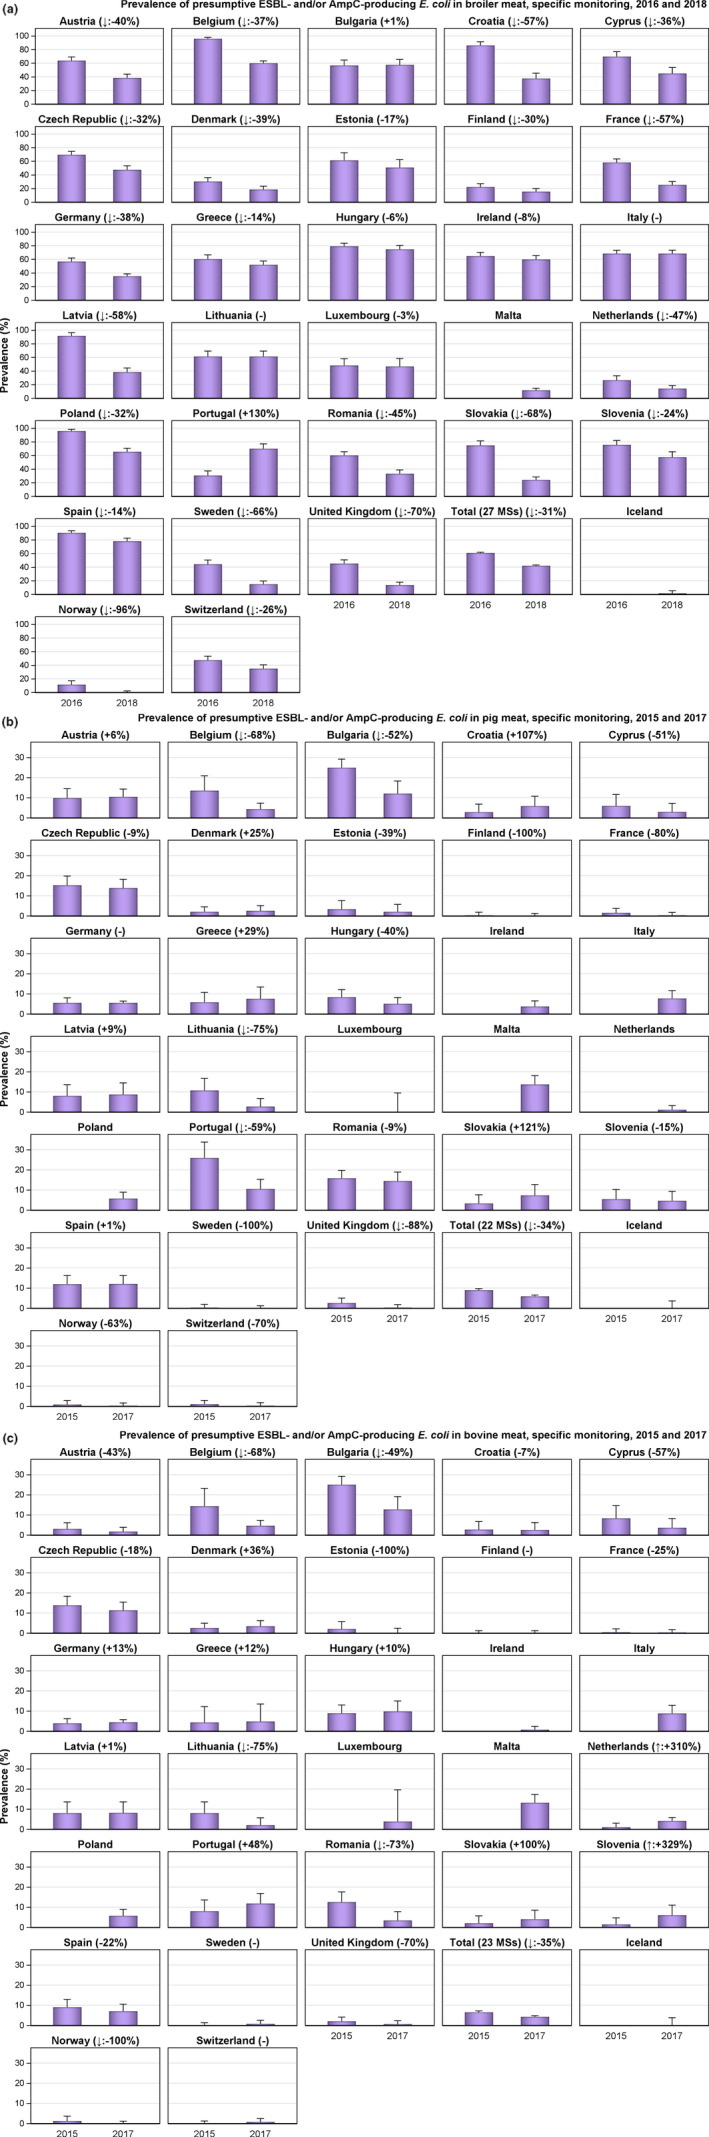
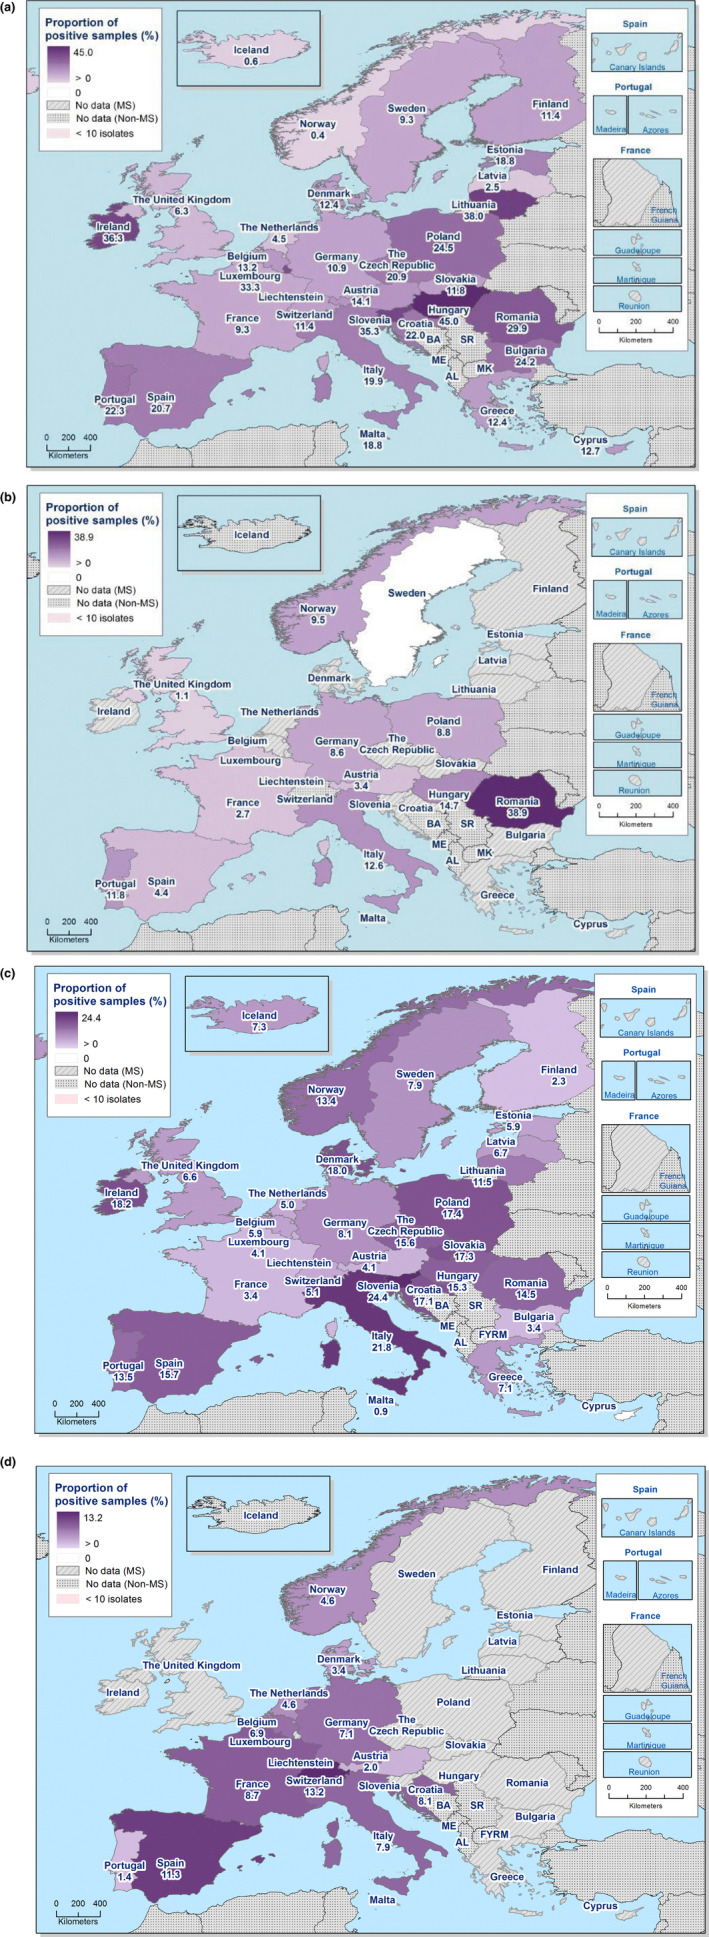
To improve the visibility of the differences, different scales were used for the y‐axis for the different sub‐figures (a, 0–100%; b–c, 0–30%). The upper bounds of the 95% confidence interval of the prevalence of ESBL‐ and/or AmpC‐producing E. coli are also indicated.
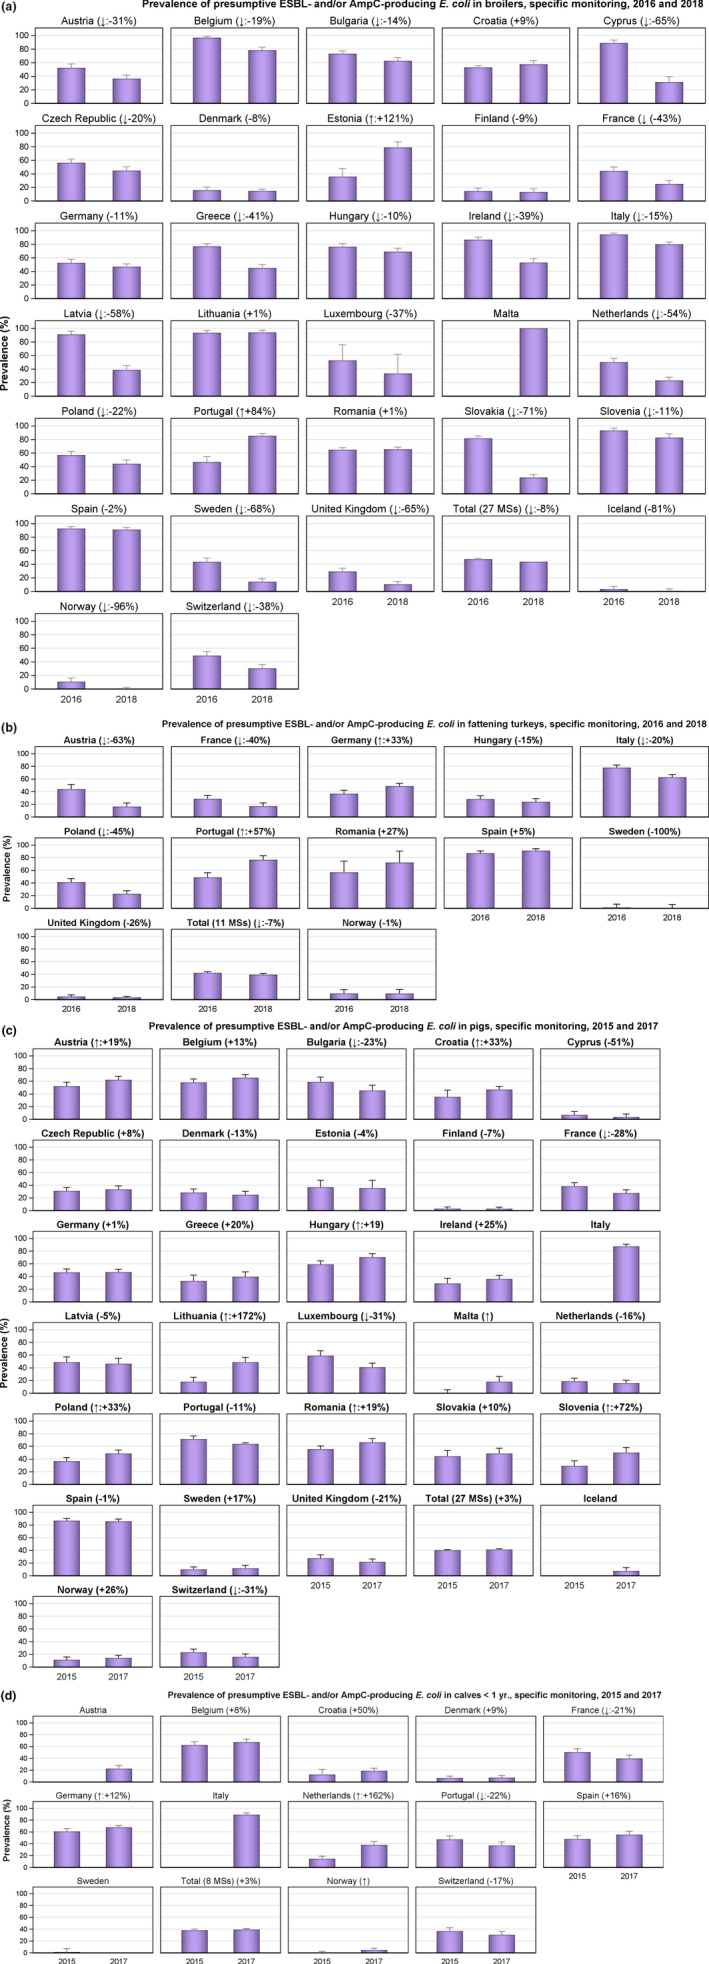
The upper bounds of the 95% confidence interval of the prevalence of ESBL‐ and/or AmpC‐producing E. coli and the rate of change (in %) are also indicated.
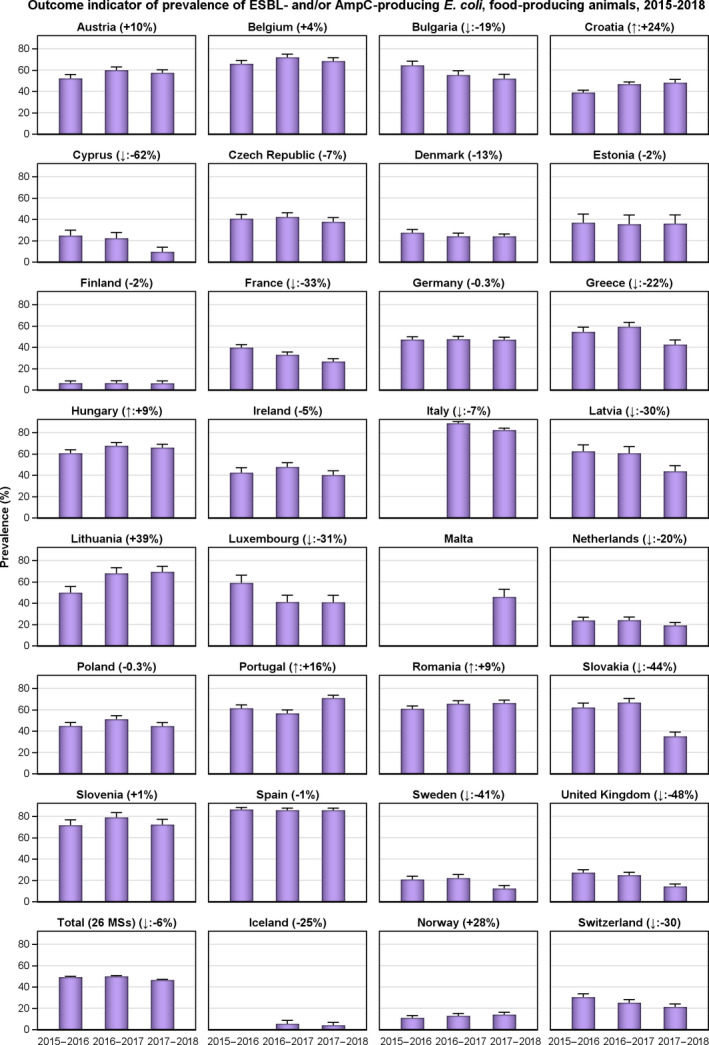
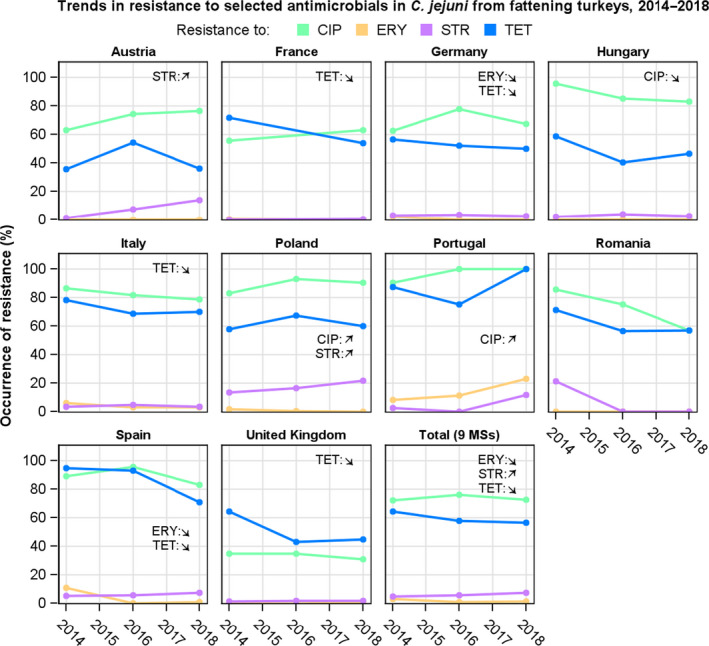
(↓)/(↑): indicates statistically significant decreasing/increasing trends over the 2015–2018 period. The upper bounds of the 95% confidence interval of the OICS and the rate of change (in %) are also indicated. Note: ‘Total’ values from 26 MSs do not include Italy and Malta.
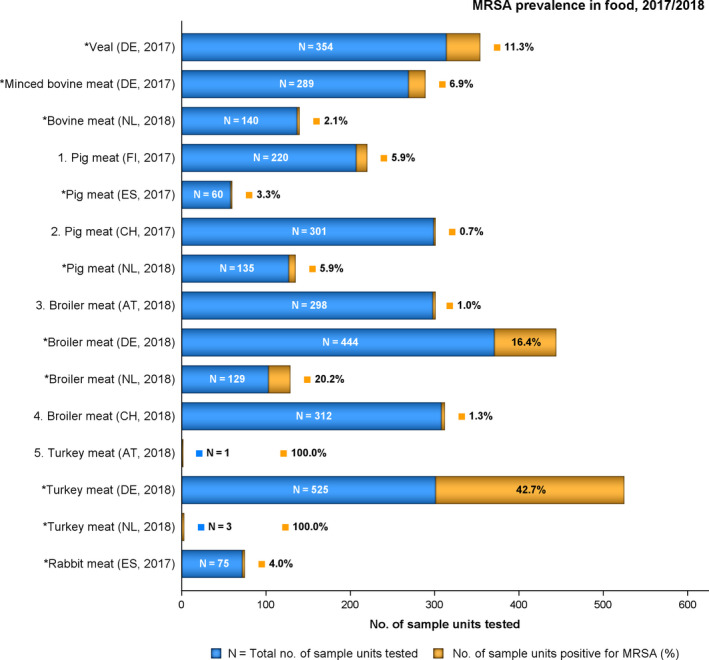
N: Total number of sample units tested;
DE : Germany;NL : the Netherlands;FI : Finland;ES : Spain;CH : Switzerland;AT : Austria.1. spa‐types: t034 (11 isolates), t011 (1), t2741 (1).
2. spa‐types: t011 (1 isolate), t002 (1).
PVL status of the t002 isolate was not reported.3. spa‐types: t011 (2 isolates), t034 (1).
4. spa‐types: t034
CC 398 (1 isolate), t1430 (1), t571CC 398 (1), t13177 (1).5. spa‐types : t011 (1).
*: spa‐types not reported.
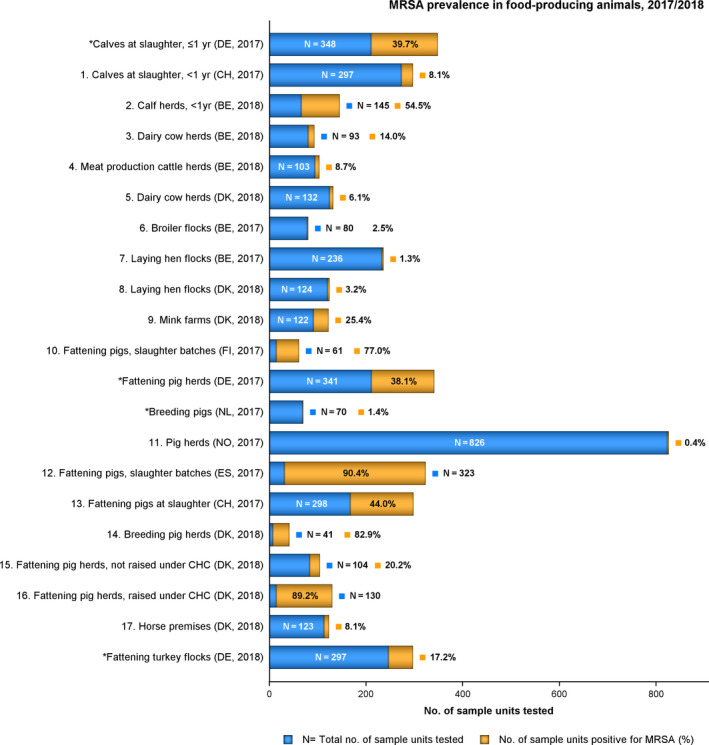
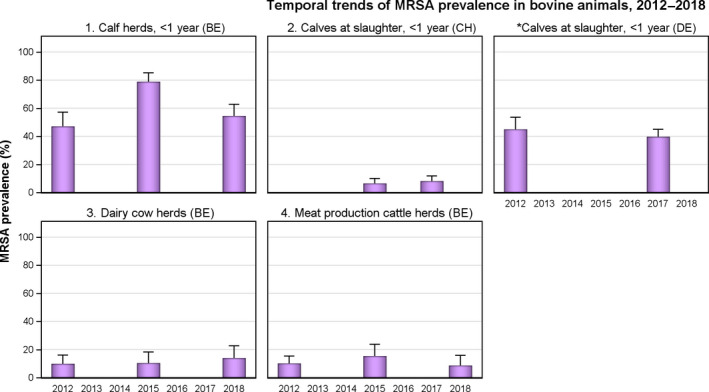
N: Total number of sample units tested;
DE : Germany;CH : Switzerland;BE : Belgium;DK : Denmark;FI : Finland;NL : the Netherlands;NO : Norway;ES : Spain;CHC : controlled housing conditions.1: spa‐types: t011 (14 isolates), t034 (7), t127 (1), t17339 (2).
PVL status of the t127 isolate was not reported.2: spa‐types: t011
CC 398 (65 isolates), t034CC 398 (8), t1451CC 398 (1), t1580CC 398 (2), t3423CC 398 (1), t3479CC 398 (1), t9433CC 398 (1).3: spa‐types: t011
CC 398 (8 isolates), t034CC 398 (1), t223 (3), t1257 (1). The t223 isolates werePVL negative;TSST status was not determined. ThePVL status of the t1257 isolate was not reported.4: spa‐types: t011
CC 398 (5 isolates), t1451CC 398 (1), t223 (2), t223ST 22 (1). All three t223 isolates werePVL negative. One t223 isolate was subjected toWGS and confirmed to belong toST 22 and harbour the tst gene.5. spa‐types: t034 (7 isolates), t267
CC 97 (1).6. spa‐types: t011
CC 398 (2 isolates).7. spa‐types: t011
CC 398 (2 isolates), t037ST 239 (1).WGS of the t037 isolate confirmed it to belong toST 239 and carry sak and scn genes.8. spa‐types: t011
CC 398 (2 isolates), t034CC 398 (2).9. spa‐types: t011
CC 398 (6 isolates), t034CC 398 (19), t571CC 398 (1), t588CC 398 (1), t1456CC 398 (1), t1457CC 398 (2), t13790CC 1 (1).10. spa‐types: t034 (32 isolates), t2741 (25), t011 (9), t108 (6), t1250 (1), t1255 (1), t17061 (1).
NB . AllMRSA isolates were subject to spa‐typing; from one slaughter batch, up to three different spa‐types were detected. Therefore, the total number of individual spa‐types exceeds the number of positive batches.11. spa‐types: t091
CC 7 (1 isolate), t843CC 130 (1), t6292CC 425 (1). The t091 isolate wasPVL negative, spa‐types t843 and t6292 were confirmed to carry the mecC gene.12. spa‐types: t011 (203 isolates), t034 (32), t108 (14), t109 (1), t899 (2), t1197 (11), t1255 (2), t1451 (13), t1606 (1), t2011 (5), t2346 (1), t2748 (1), t3041 (2), t4208 (2), t17304 (1), t17627 (1).
13. spa‐types: t034 (63 isolates), t011 (61), t899 (2), t1451 (3), t2330 (1), t2876 (1).
14. spa‐types: t011
CC 398 (6 isolates), t034CC 398 (24), t1250CC 398 (2), t1793CC 398 (1), t3171CC 398 (1).15. spa‐types: t011
CC 398 (4 isolates), t034CC 398 (15), t588CC 398 (1), t1456CC 398 (1).16. spa‐types: t011
CC 398 (22 isolates), t034CC 398 (85), t571CC 398 (3), t898CC 398 (1), t2383CC 398 (1), t2974CC 398 (1), t3423CC 398 (1), t4652CC 398 (1), t9266CC 398 (1).17. spa‐types: t011
CC 398 (3 isolates), t034CC 398 (6), t843CC 130 (1). spa‐type t843 was confirmed to carry the mecC gene.*: spa‐types not reported.
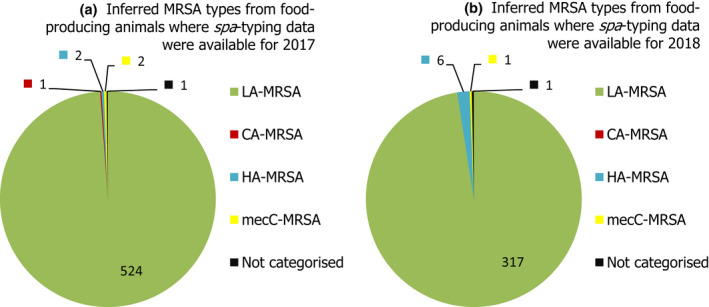
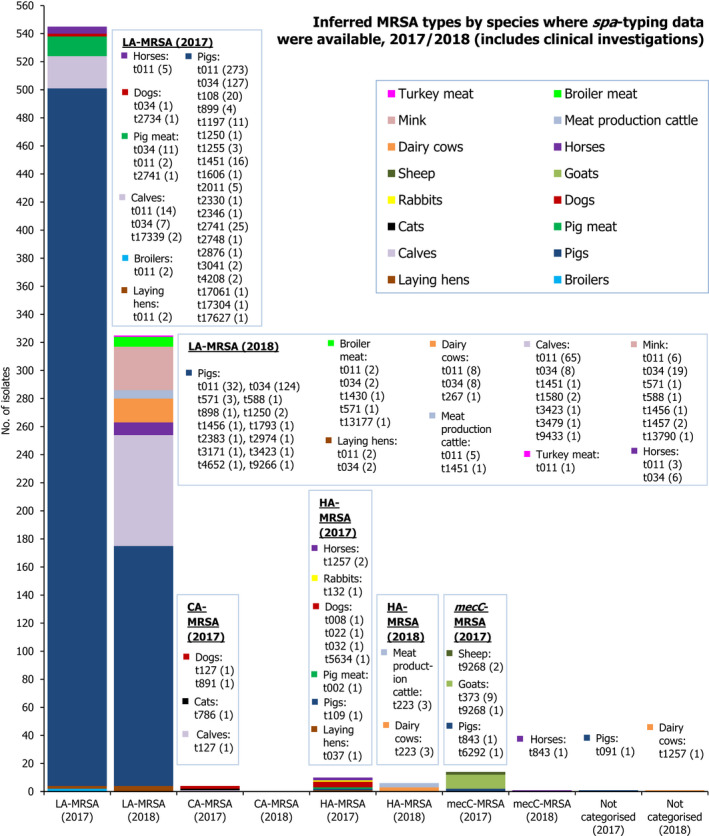
Inferred
MRSA types in (a) 2017 were recovered from calves, pigs and broiler/laying hen flocks; inferredMRSA types in (b) 2018 were recovered from pigs, cattle, laying hens, mink and horses at the herd/flock/farm/stable level.NB . AllMRSA isolates recovered from Finnish fattening pigs in 2017 were subject to spa‐typing; from a slaughter batch of pigs, up to three different spa‐types were detected.
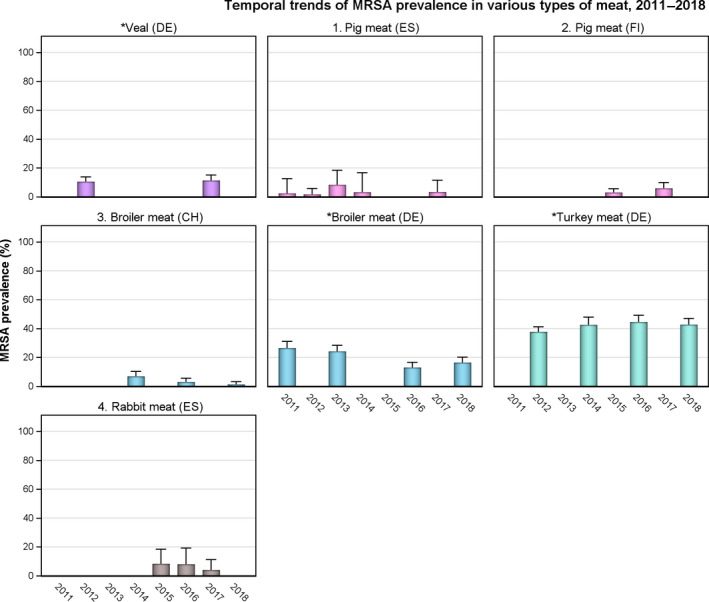
DE : Germany;ES : Spain;FI : Finland;CH : Switzerland.Where comparable longitudinal data were available, all reporting countries (4/4) used the 2‐S method of isolation (2011–2018).
*: spa‐types not reported.
1: In 2011, spa‐type: t011 (1 isolate).
In 2012, 2013, 2014 and 2017, spa‐types not reported.
2: In 2015, spa‐types: t034 (6 isolates), t2741 (3).
In 2017, spa‐types: t034 (11 isolates), t011 (1), t2741 (1).
3: In 2014, spa‐types: t011 (3 isolates), t032 (3), t034 (14), t571 (1) t899 (1).
In 2016, spa‐types: t034 (3 isolates), t153 (1), t1430 (3), t2123 (2).
PVL status of the t153 isolate was not reported.In 2018, spa‐types: t034
CC 398 (1 isolate), t1430 (1), t571CC 398 (1), t13177 (1).4: In 2015 and 2017, spa‐types not reported.
In 2016, spa‐types: t011 (3 isolates), t1190 (1).
PVL status of the t1190 isolate was not reported.
BE : Belgium;CH : Switzerland;DE : Germany. Where comparable longitudinal data were available, all reporting countries (3/3) used the 2‐S method of isolation (2009–2018).*: spa‐types not reported.
1: In 2012, spa‐types: t011 (40 isolates), t1451 (3), t1456 (1), t1985 (3), t3423 (1), untypable (1).
In 2015, spa‐types: t011 (64 isolates), t034 (15), t037 (8), t044 (3), t1451 (3), t1580 (7), t1985 (8), t2287 (2), t3423 (5), untypable (1).. The t044 isolates were
PVL negative.In 2018, spa‐types: t011
CC 398 (65 isolates), t034CC 398 (8), t1451CC 398 (1), t1580CC 398 (2), t3423CC 398 (1), t3479CC 398 (1), t9433CC 398 (1).2: In 2015, spa‐types: t011 (11 isolates), t034 (6) and t008 (2). The t008 isolates were
PVL positive.In 2017, spa‐types: t011 (14 isolates), t034 (7), t127 (1), t17339 (2).
PVL status of the t127 isolate was not reported.3: In 2012, spa‐types: t011 (8 isolates), t037 (1), t388 (1), t1456 (1), t6228 (2), untypable (1).
In 2015, t011 (4 isolates), t034 (1), t1580 (1), t1985 (2), t2383 (1), untypable (1).
In 2018, spa‐types: t011
CC 398 (8 isolates), t034CC 398 (1), t223 (3), t1257 (1). The t223 isolates werePVL negative;TSST status was not determined. ThePVL status of the t1257 isolate was not reported.4: In 2012, spa‐types: t011 (16 isolates), t121 (1), t1456 (1), t1985 (1).
In 2015, spa‐types: t011 (9 isolates), t034 (2), t1451 (1), t1580 (2), t2287 (1), t3423 (1).
In 2018, spa‐types: t011
CC 398 (5 isolates), t1451CC 398 (1), t223 (2), t223ST 22 (1). All three t223 isolates werePVL negative. One t223 isolate was confirmed to belong toST 22 and harbour the tst gene fromWGS data.
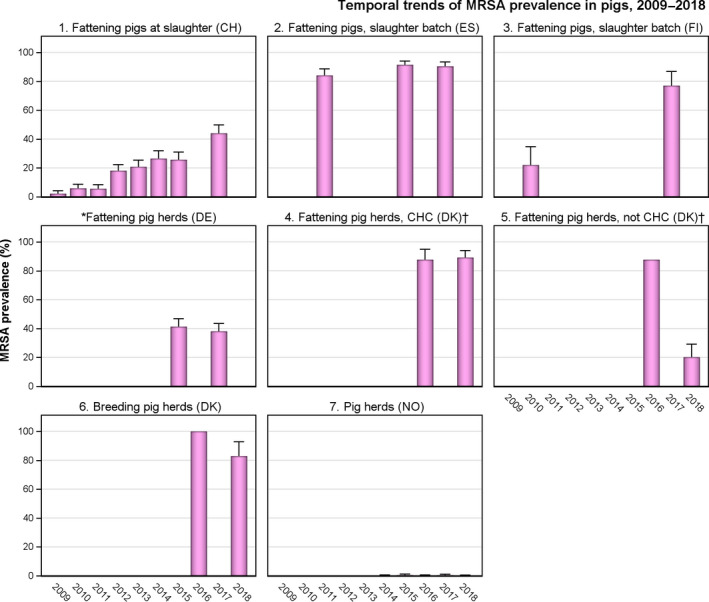
CH : Switzerland;ES : Spain;FI : Finland;DE : Germany;DK : Denmark;NO : Norway;CHC : controlled housing conditions. 4/6 reporting countries used the 2‐S method of isolation (2009–2018).NO andDK used the 1‐S method of isolation in 2018.*: spa‐types not reported.
†: Prevalence data for 2016 is from conventional fattening pig herds.
1: In 2009, spa‐types not reported.
In 2010, spa‐types: t034
ST 398 (17 isolates), t011ST 398 (1), t208ST 49 (5).In 2011, spa‐types: t034
ST 398 (19 isolates), t011ST 398 (1), t208ST 49 (1), t2279ST 1 (1).In 2012, spa‐types: t034
CC 398 (61 isolates), t011CC 398 (9), t208ST 49 (2).In 2013, spa‐types: t034 (63 isolates), t011 (10).
In 2014, spa‐types: t034 (57 isolates), t011 (19), t208 (1), t899 (1), t2741 (1).
In 2015, spa‐types: t034 (48 isolates), t011 (23), t032 (1), t571 (1), t899 (1), t1145 (1), t1250 (1), t4475 (1).
In 2017, spa‐types: t034 (63 isolates), t011 (61), t899 (2), t1451 (3), t2330 (1), t2876 (1).
2: In 2011, spa‐types: t011 (97 isolates), t034 (8), t108 (3), t1197 (7), t1451 (3), t2346 (3), unspecified (68).
In 2015, spa‐types not reported.
In 2017, spa‐types: t011 (203 isolates), t034 (32), t108 (14), t109 (1), t899 (2), t1197 (11), t1255 (2), t1451 (13), t1606 (1), t2011 (5), t2346 (1), t2748 (1), t3041 (2), t4208 (2), t17304 (1), t17627 (1).
3: In 2010, spa‐types: t108 (6 isolates) and t127 (5) were the most commonly detected.
In 2017, spa‐types: t034 (32 isolates), t2741 (25), t011 (9), t108 (6), t1250 (1), t1255 (1), t17061 (1).
NB . AllMRSA isolates were subject to spa‐typing; from one slaughter batch, up to three different spa‐types were detected.4: In 2016, spa‐types not reported.
In 2018, spa‐types: t011
CC 398 (22 isolates), t034CC 398 (85), t571CC 398 (3), t898CC 398 (1), t2383CC 398 (1), t2974CC 398 (1), t3423CC 398 (1), t4652CC 398 (1), t9266CC 398 (1).5: In 2016, spa‐types not reported.
In 2018, spa‐types: t011
CC 398 (4 isolates), t034CC 398 (15), t588CC 398 (1), t1456CC 398 (1).6: In 2016, spa‐types not reported.
In 2018, spa‐types: t011
CC 398 (6 isolates), t034CC 398 (24), t1250CC 398 (2), t1793CC 398 (1), t3171CC 398 (1).7: In 2014, spa‐type: t011 (1).
In 2015, spa‐type: t034
CC 398 (2), t177CC 1 (2).In 2016, spa‐type: t034
CC 398 (1).In 2017, spa‐types: t091
CC 7 (1 isolate), t843CC 130 (1), t6292CC 425 (1). The t091 isolate wasPVL negative, spa‐types t843 and t6292 were confirmed to carry the mecC gene.In 2018, no herds tested positive for
MRSA .
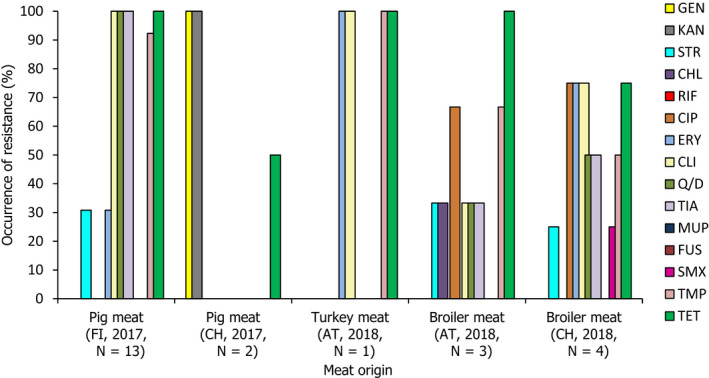
N: Number of
MRSA isolates reported/tested;FI : Finland;CH : Switzerland;AT : Austria.All isolates were tested against
GEN : gentamicin;KAN : kanamycin;STR : streptomycin;CHL : chloramphenicol;RIF : rifampicin;CIP : ciprofloxacin;ERY : erythromycin;CLI : clindamycin; Q/D: quinupristin/dalfopristin;TIA : tiamulin;MUP : mupirocin;FUS : fusidic acid;SMX : sulfamethoxazole;TMP : trimethoprim;TET : tetracycline. AllMRSA isolates were resistant to penicillin and cefoxitin, as expected. All isolates were susceptible to vancomycin and linezolid.
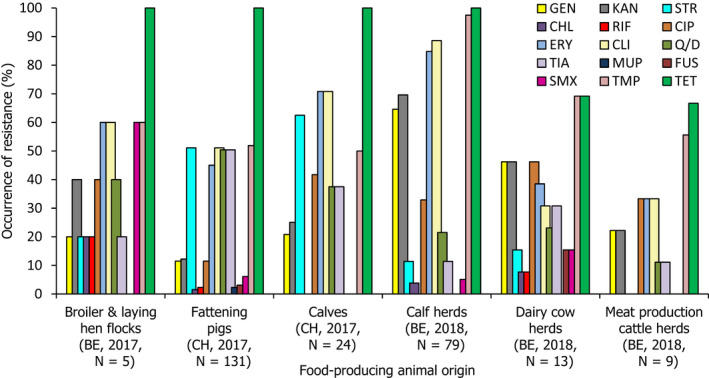
N: Number of
MRSA isolates reported/tested;BE : Belgium;CH : Switzerland.All isolates were tested against
GEN : gentamicin;KAN : kanamycin;STR : streptomycin;CHL : chloramphenicol;RIF : rifampicin;CIP : ciprofloxacin;ERY : erythromycin;CLI : clindamycin; Q/D: quinupristin/dalfopristin;TIA : tiamulin;MUP : mupirocin;FUS : fusidic acid;SMX : sulfamethoxazole;TMP : trimethoprim;TET : tetracycline. AllMRSA isolates were resistant to penicillin and cefoxitin, as expected. All isolates were susceptible to vancomycin and linezolid.
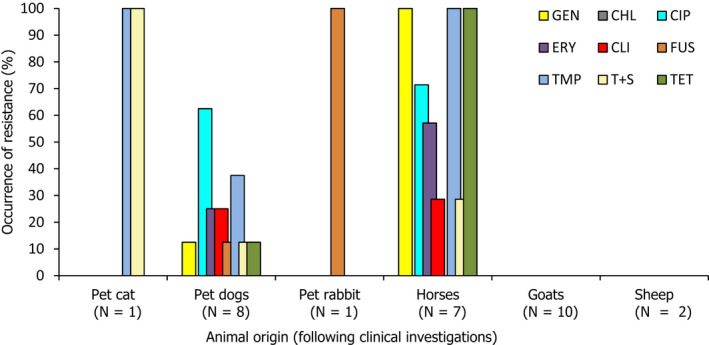
N: Number of
MRSA isolates reported/tested. All isolates were tested againstGEN : gentamicin;CHL : chloramphenicol;CIP : ciprofloxacin;ERY : erythromycin;CLI : clindamycin;FUS : fusidic acid;TMP : trimethoprim; T+S: trimethoprim + sulfonamide;TET : tetracycline. AllMRSA isolates were resistant to penicillin and cefoxitin, as expected, and susceptible to linezolid; vancomycin susceptibility was not reported.
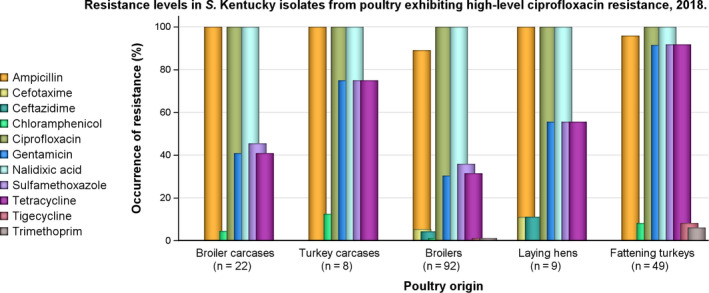
n: Total number of S. Kentucky isolates exhibiting high‐level ciprofloxacin resistance.
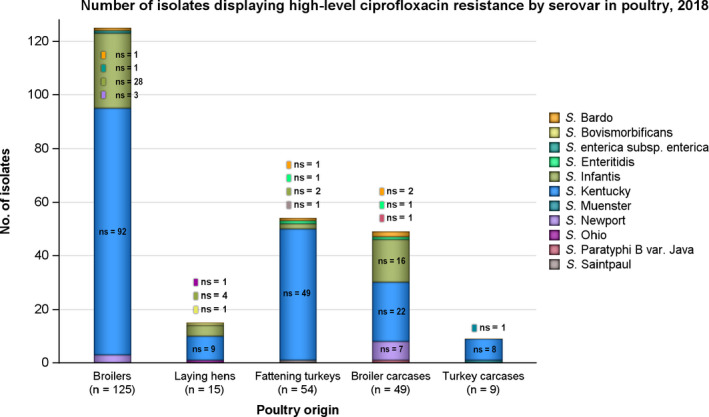
n: Total number of Salmonella isolates exhibiting high‐level ciprofloxacin resistance; ns: number of isolates by serovar exhibiting high‐level ciprofloxacin resistance.
From calf carcases, S. Livingstone, S. Montevideo and S. Typhimurium were joint sixth most frequently reported.
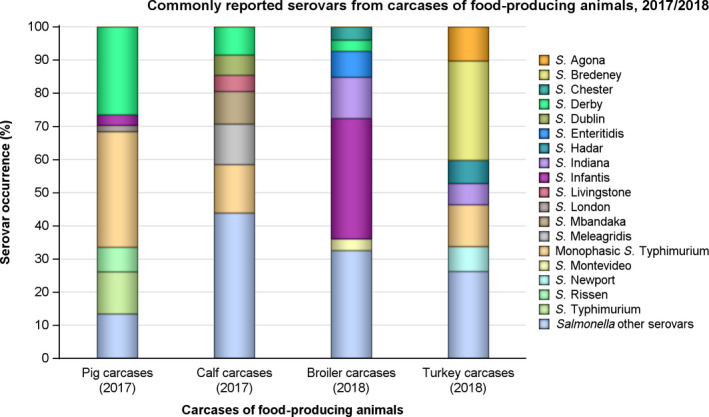
N: Total number of Salmonella spp. or total number of particular serovars recovered from the carcase monitoring.
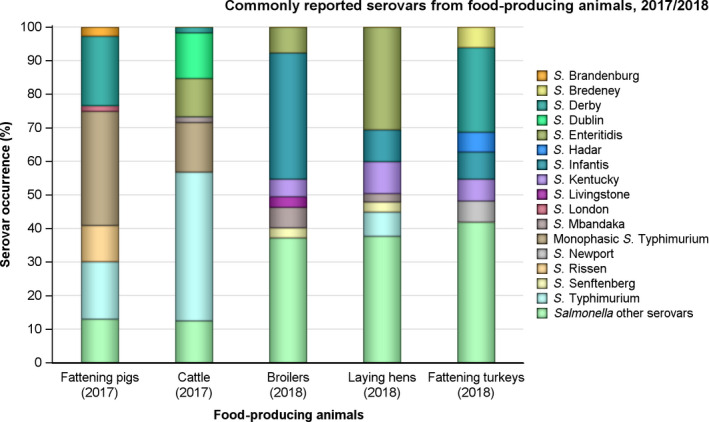
From cattle, S. Derby and S. Mbandaka were the joint fifth most frequently reported.
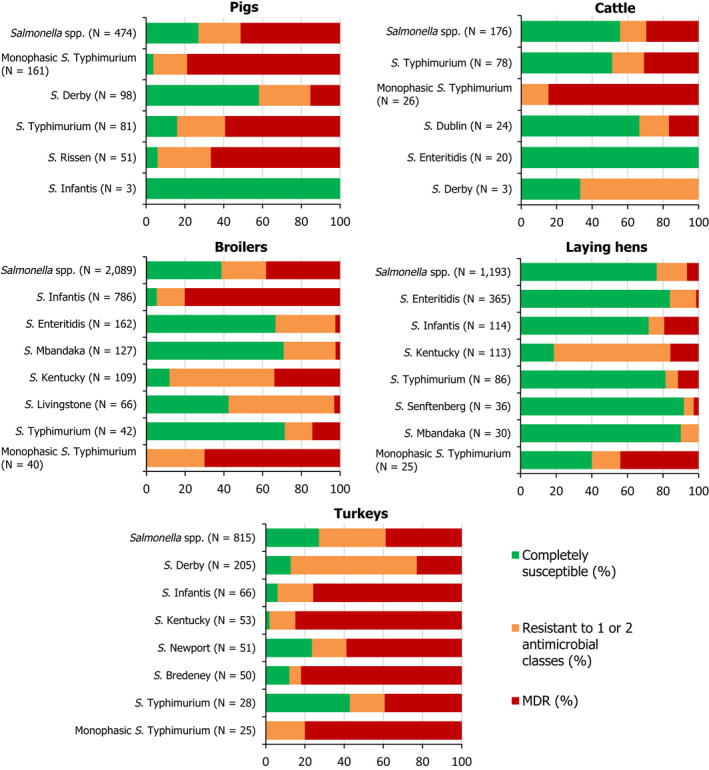
N: Total number of Salmonella spp. or total number of particular serovars recovered from the monitoring of animals.
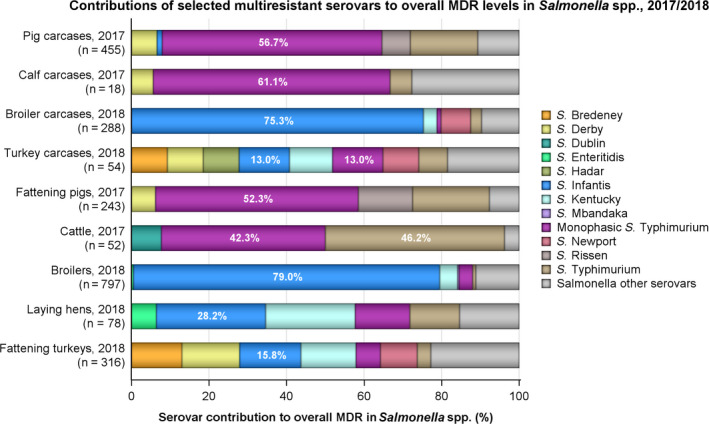
n: Total number of Salmonella isolates exhibiting
MDR ; serovars contributing the highest levels ofMDR to overallMDR levels in Salmonella spp. are illustrated with a percentage.
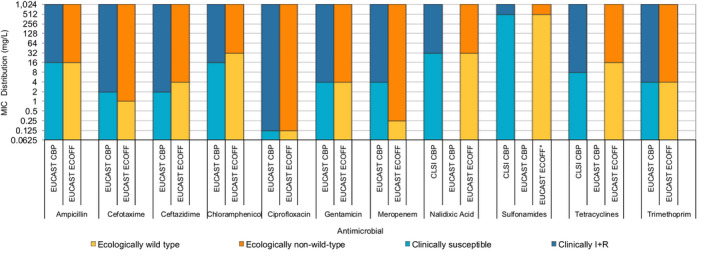
*:
EUCAST has changed the definitions ofSIR from 2019 (EUCAST , 2019b ‐http://www.eucast.org/newsiandr/ ). For I, the new definition ‘susceptible, increased exposure’ is used when there is a high likelihood of therapeutic success because exposure to the agent is increased by adjusting the dosing regimen or by its concentration at the site of infection.
Note: S. Enteritidis was not reported from turkey carcases.
References
-
- Alba P, Feltrin F, Cordaro G, Porrero MC, Kraushaar B, Argudín MA, Nykäsenoja S, Monaco M, Stegger M, Aarestrup FM, Butaye P, Franco A and Battisti A, 2015. Livestock‐associated methicillin resistant and methicillin susceptible Staphylococcus aureus sequence type (CC)1 in European farmed animals: high genetic relatedness of isolates from Italian cattle herds and humans. PLoS ONE, 10, e0137143 10.1371/journal.pone.0137143 - DOI - PMC - PubMed
-
- Aviv G, Tsyba K, Steck N, Salmon‐Divon M, Cornelius A, Rahav G, Grassl GA and Gal‐Mor O, 2014. A unique megaplasmid contributes to stress tolerance and pathogenicity of an emergent Salmonella enterica serovar Infantis strain. Environmental Microbiology, 16, 977–994. 10.1111/1462-2920.12351 - DOI - PubMed
-
- Bai L, Du P, Du Y, Sun H, Zhang P, Wan Y, Lin Q, Fanning S, Cui S and Wu Y, 2019. Detection of plasmid‐mediated tigecycline‐resistant gene tet(X4) in Escherichia coli from pork, Sichuan and Shandong Provinces, China, February 2019. Euro Surveillance, 24, 4 10.2807/1560-7917.es.2019.24.25.1900340 - DOI - PMC - PubMed
LinkOut - more resources
Full Text Sources
Other Literature Sources