. 2020 Apr 29;18(4):e06088.
doi: 10.2903/j.efsa.2020.6088. eCollection 2020 Apr.

Cumulative dietary risk characterisation of pesticides that have chronic effects on the thyroid

Cumulative dietary risk characterisation of pesticides that have chronic effects on the thyroid

European Food Safety Authority (EFSA) et al. EFSA J. .

Abstract

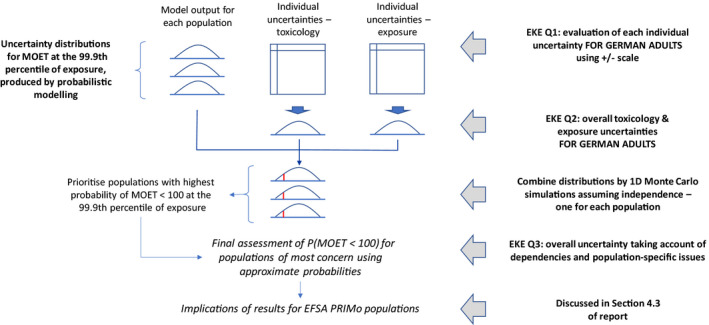
A retrospective chronic cumulative risk assessment of dietary exposure to pesticide residues, supported by an uncertainty analysis based on expert knowledge elicitation, was conducted for two effects on the thyroid, hypothyroidism and parafollicular cell (C-cell) hypertrophy, hyperplasia and neoplasia. The pesticides considered in this assessment were identified and characterised in the scientific report on the establishment of cumulative assessment groups of pesticides for their effects on the thyroid. Cumulative exposure assessments were conducted through probabilistic modelling by EFSA and the Dutch National Institute for Public Health and the Environment (RIVM) using two different software tools and reported separately. These exposure assessments used monitoring data collected by Member States under their official pesticide monitoring programmes in 2014, 2015 and 2016 and individual consumption data from 10 populations of consumers from different countries and different age groups. This report completes the characterisation of cumulative risk, taking account of the available data and the uncertainties involved. For each of the 10 populations, it is concluded with varying degrees of certainty that cumulative exposure to pesticides that have the chronic effects on the thyroid mentioned above does not exceed the threshold for regulatory consideration established by risk managers.

Keywords: cumulative risk assessment; expert knowledge elicitation; pesticide residues; probabilistic modelling; thyroid.


Figures

Figure 1
Figure 1
Overview of the approach to characterising overall uncertainty in the CRA, which was conducted separately for each CAG
Figure 2
Figure 2
Scale used by the experts when assessing EKE Question 1
Figure 3
Figure 3
CAGTCF: Consensus distribution of the experts for the combined impact of the quantified uncertainties affecting exposure (if resolved) on the MOET at the 99.9th percentile of exposure for the German adult population in 2014–2016, expressed as a multiplicative factor f to be applied to the Tier II median estimate shown in Table 1A. The probability distribution is shown by the curve, which represents the probability density (relative likelihood) for different values of the multiplicative factor f. Distribution parameters are shown in Table 5
Figure 4
Figure 4
CAGTCF: Consensus distribution of the experts for the combined impact of the quantified uncertainties affecting toxicology (if resolved) on the MOET at the 99.9th percentile of exposure for the German adult population in 2014–2016, expressed as a multiplicative factor f to be applied to the Tier II median estimate shown in Table 1A. Distribution parameters are shown in Table 6. Graph content is explained in Figure 3
Figure 5
Figure 5
CAGTCF: ‘Model’ boxplots show the unadjusted output of the MCRA Tier II model for the MOET at the 99.9th percentile of exposure in each consumer population in 2014–2016. ‘Model+experts’ boxplots show the result of combining the output of the Tier II model with the elicited distributions quantifying additional sources of uncertainty. Note that the vertical axis is plotted on a logarithmic scale; the values plotted for ‘model + experts’ are shown numerically in Table 7. A key to the populations and explanation of the boxplots are provided in the footnote below the graph.
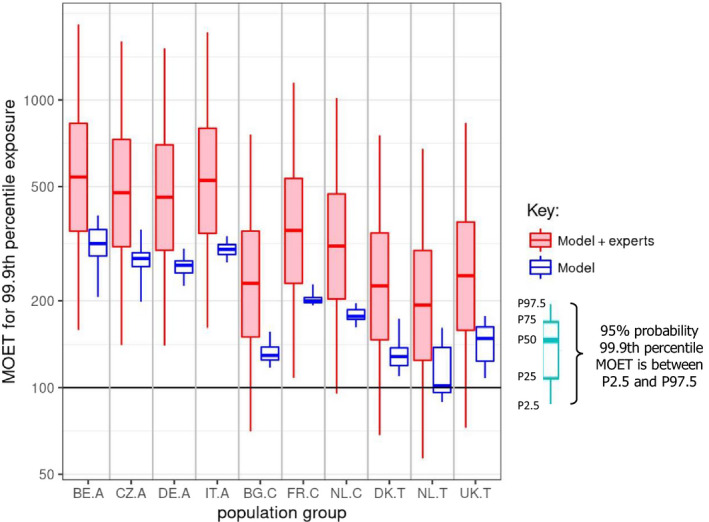
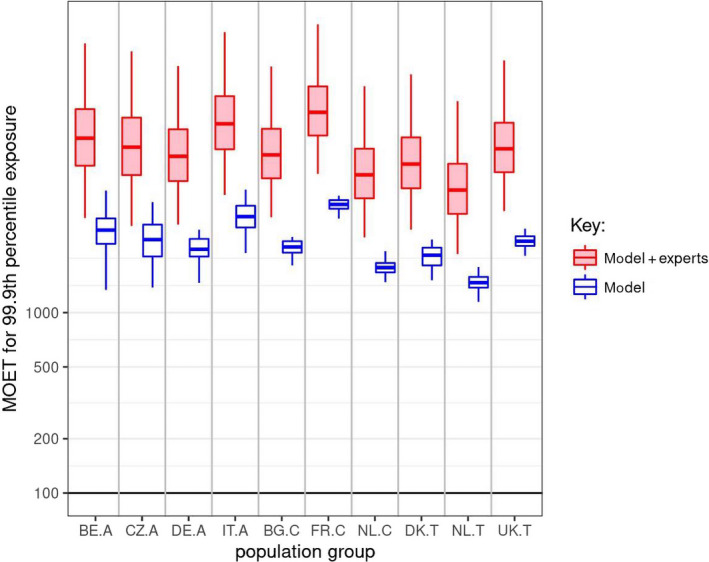
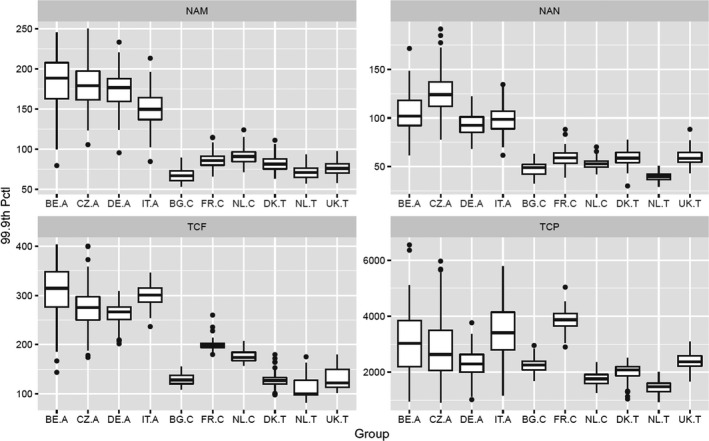
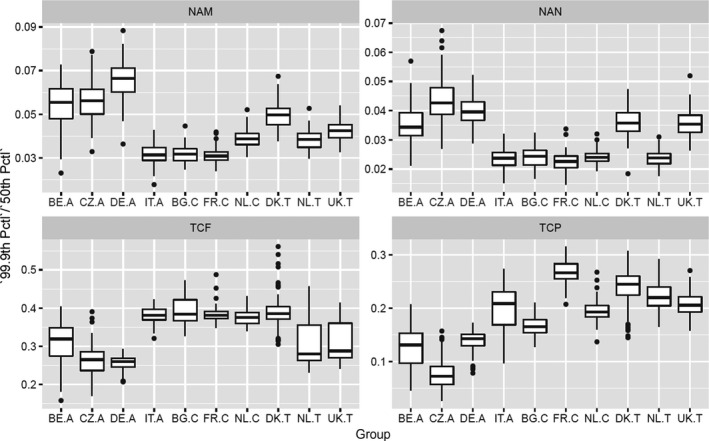
  1. Key: Population groups: BE.A (Belgian adults), CZ.A (Czech Republic adults), DE.A (German adults), IT.A (Italian adults), BG.C (Bulgarian children), FR.C (French children), NL.C (Dutch children), DK.T (Danish toddlers), NL.T (Dutch toddlers), UK.T (United Kingdom toddlers). The lower and upper edges of each boxplot represent the quartiles (P25 and P75) of the uncertainty distribution for each estimate, the horizontal line in the middle of the box represents the median (P50) and the ‘whiskers’ above and below the box show the 95% probability interval (P2.5 and P97.5).

Figure 6
Figure 6
CAGTCP: Consensus distribution of the experts for the combined impact of the quantified uncertainties affecting exposure (if resolved) on the MOET at the 99.9th percentile of exposure for the German adult population in 2014–2016, expressed as a multiplicative factor f to be applied to the Tier II median estimate shown in Table 2A. Distribution parameters are shown in Table 8. Graph content is explained in Figure 3
Figure 7
Figure 7
CAGTCP: Consensus distribution of the experts for the combined impact of the quantified uncertainties affecting toxicology (if resolved) on the MOET at the 99.9th percentile of exposure for the German adult population in 2014–2016, expressed as a multiplicative factor f to be applied to the Tier II median estimate shown in Table 2A. Distribution parameters are shown in Table 9. Graph content is explained in Figure 3
Figure 8
Figure 8
CAG‐TCP: ‘Model’ boxplots show the unadjusted output of the MCRA Tier II model for the MOET at the 99.9th percentile of exposure in each consumer population in 2014–2016. ‘Model + experts’ boxplots show the result of combining the output of the Tier II model with the elicited distributions quantifying additional sources of uncertainty. Note that the vertical axis is plotted on a logarithmic scale; the values plotted for ‘model + experts’ are shown numerically in Table 10. A key to the populations and explanation of the boxplots are provided in the footnote below Figure 5
Figure B.1
Figure B.1
Boxplots of 99.9th percentiles from MCRA bootstrap samples for the different consumer groups. NAM, NAN, TCF and TCP refer to CAGNAM, CAGNAN, CAGTCF and CAGTCP, respectively
Figure B.2
Figure B.2
Boxplots of the ratio of the 99.9th percentile to the 50th percentile from MCRA bootstrap samples for the different consumer groups. NAM, NAN, TCF and TCP refer to CAGNAM, CAGNAN, CAGTCF and CAGTCP, respectively

References

    1. Chung SW, 2018. How effective are common household preparations on removing pesticide residues from fruit and vegetables? A review. Journal of the Science of Food and Agriculture, 98, 2857–2870. 10.1002/jsfa.8821 - DOI - PubMed
    1. Crofton KM, 2008. Thyroid disrupting chemicals: mechanisms and mixtures. International Journal of Andrology, 31, 209–223. - PubMed
    1. Crofton KM, Craft ES, Hedge JM, Gennings C, Simmons JE, Carchman RA, Carter Jr WH and DeVito MJ, 2005. Thyroid‐hormone–disrupting chemicals: evidence for dose‐dependent additivity or synergism. Environmental Health Perspectives, 113. - PMC - PubMed
    1. ECHA and EFSA (European Chemicals Agency and European Food Safety Authority) with the technical support of the Joint Research Centre (JRC), Andersson N, Arena M, Auteri D, Barmaz S, Grignard E, Kienzler A, Lepper P, Lostia AM, Munn S, Parra Morte JM, Pellizzato F, Tarazona J, Terron A and Van der Linden S, 2018. Guidance for the identification of endocrine disruptors in the context of Regulations (EU) No 528/2012 and (EC) No 1107/2009. EFSA Journal 2018;16(6):5311, 135 pp. 10.2903/j.efsa.2018.5311. ECHA‐18‐G‐01‐EN. - DOI - PMC - PubMed
    1. EFSA (European Food Safety Authority), 2011. Use of the EFSA Comprehensive European Food Consumption Database in Exposure Assessment. EFSA Journal 2011;9(3):2097. 34 pp. 10.2903/j.efsa.2011.2097 - DOI

LinkOut - more resources