. 2019 Nov 15;11(2):355-363.
doi: 10.1039/c9sc04670d. eCollection 2020 Jan 14.

Ptychographic X-ray tomography reveals additive zoning in nanocomposite single crystals

Affiliations

Ptychographic X-ray tomography reveals additive zoning in nanocomposite single crystals

Johannes Ihli et al. Chem Sci. .

Abstract

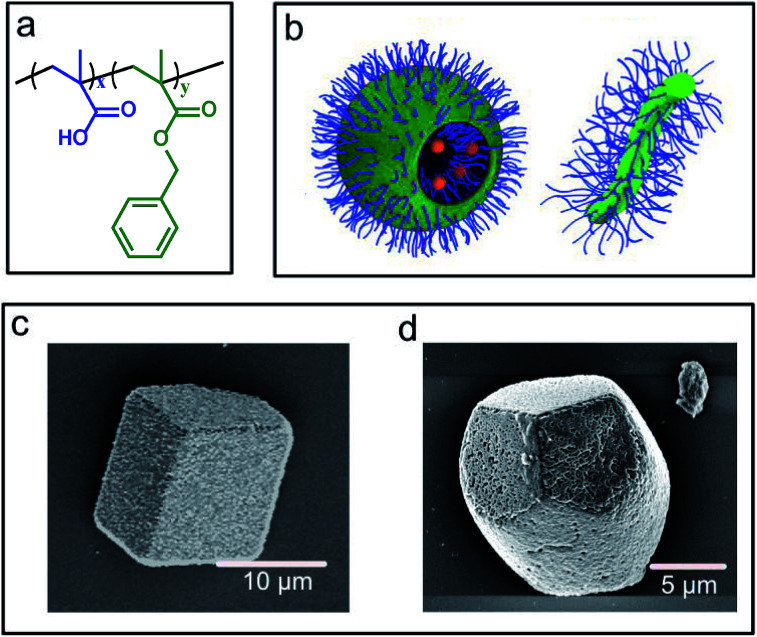
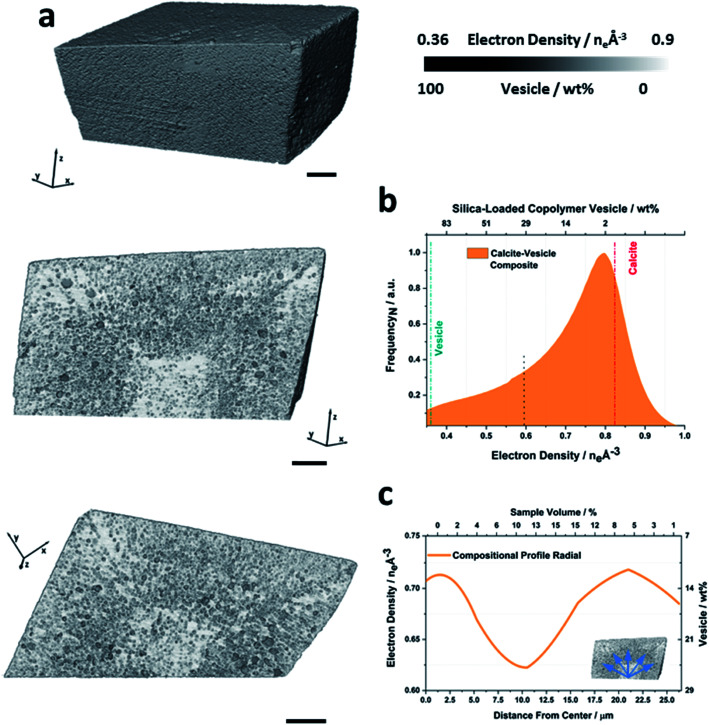
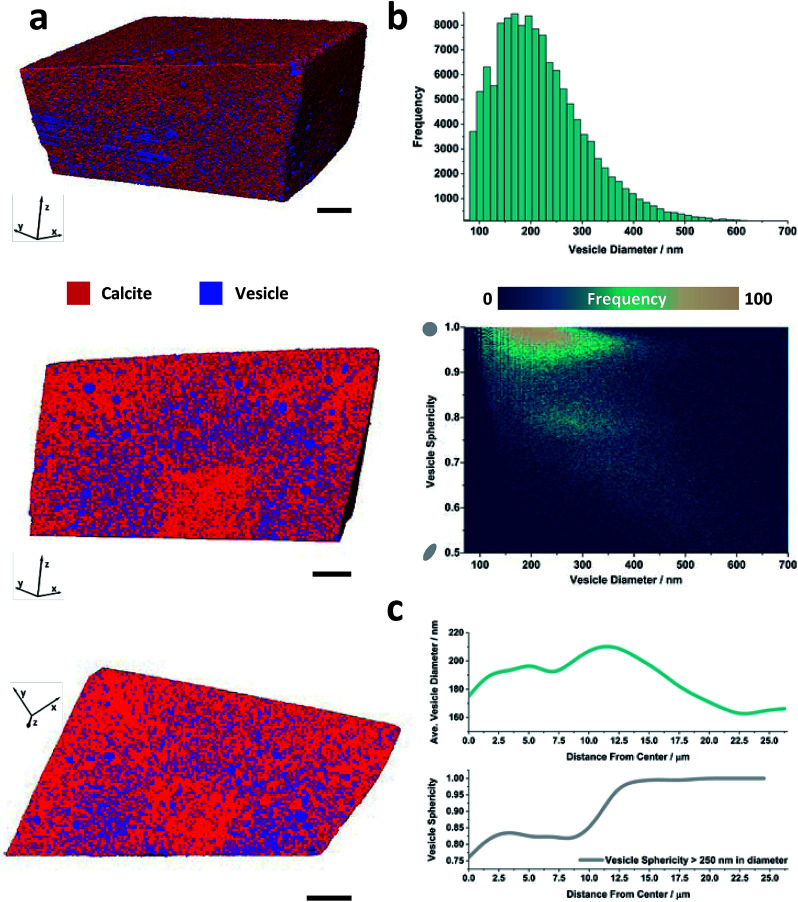
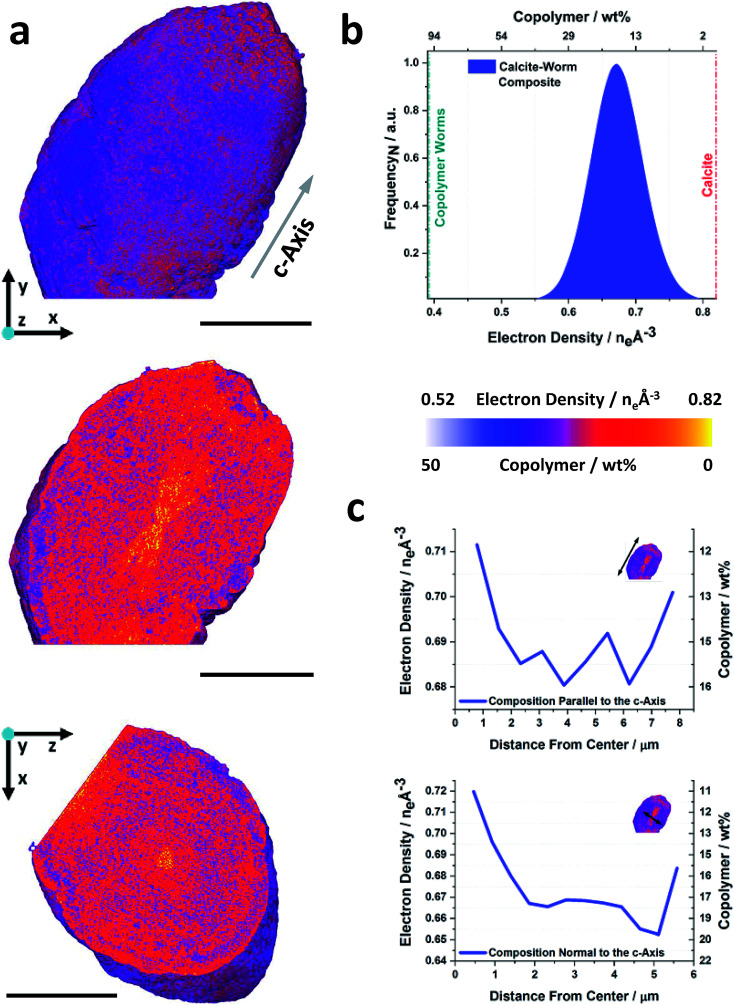
Single crystals containing nanoparticles represent a unique class of nanocomposites whose properties are defined by both their compositions and the structural organization of the dispersed phase in the crystalline host. Yet, there is still a poor understanding of the relationship between the synthesis conditions and the structures of these materials. Here ptychographic X-ray computed tomography is used to visualize the three-dimensional structures of two nanocomposite crystals - single crystals of calcite occluding diblock copolymer worms and vesicles. This provides unique information about the distribution of the copolymer nano-objects within entire, micron-sized crystals with nanometer spatial resolution and reveals how occlusion is governed by factors including the supersaturation and calcium concentration. Both nanocomposite crystals are seen to exhibit zoning effects that are governed by the solution composition and interactions of the additives with specific steps on the crystal surface. Additionally, the size and shape of the occluded vesicles varies according to their location within the crystal, and therefore the solution composition at the time of occlusion. This work contributes to our understanding of the factors that govern nanoparticle occlusion within crystalline materials, where this will ultimately inform the design of next generation nanocomposite materials with specific structure/property relationships.


Figures

Fig. 1
Fig. 1. (a) Generic chemical structure of the PMAAx–PBzMAy diblock copolymer nano-objects used in the study. (b) Schematic representation of PMAA69–PBzMA200 vesicles and PMAA71–PBzMA150 worms. (c) SEM images of vesicle/calcite and a (d) worm/calcite composite single crystals.
Fig. 2
Fig. 2. Ptychographic X-ray computed tomography of a calcite nanocomposite crystal occluding diblock copolymer vesicles. (a) Volume rendering of and orthoslices through the electron density tomogram of a calcite crystal occluding silica-loaded copolymer vesicles (PMAA69–BzMA300). Both orthoslices are shown with a single color scale ranging from black to white, where this is representative of the electron density value or the approximate weight percent of vesicles. (b) Corresponding histogram, where the electron densities of the reference components and the applied segmentation thresholds are marked. (c) Radial distribution profiles showing the volume averaged compositional variation of the nanocomposite as a function of distance from the crystal center (blue arrows). The scale bars are 5 μm, the voxel size is (16.6 nm) and measurements were conducted under cryogenic conditions.
Fig. 3
Fig. 3. Threshold segmented tomography of a calcite nanocomposite crystal occluding diblock copolymer vesicles. (a) Volume rendering of and orthoslices through the threshold-segmented tomogram. The segmentation threshold used to separate the calcite host (red) from the dispersed silica-loaded vesicles (blue) was ∼0.6 eA–3. (b) Vesicle size distribution and bivariate histogram showing the number of vesicles as a function of diameter and sphericity. (c) Radial distribution profiles showing the variations in the volume averaged vesicle diameter and sphericity of larger vesicles as a function of the distance from the composite center. Scale bars are 5 μm and the voxel size is (16.6 nm).
Fig. 4
Fig. 4. Ptychographic X-ray computed tomography of a calcite nanocomposite crystal occluding diblock copolymer worms. (a) Volume rendering, and orthoslices through the electron density tomogram of a calcite crystal occluding copolymer worms (PMAA70–BzMA150). Common to both orthoslices is a single color scale ranging from white to yellow, where this is representative of the electron density value or weight percent of copolymer. (b) Electron density histogram, electron densities of the reference components are indicated. (c) Radial distribution profiles showing the compositional variation parallel and normal to the crystallographic c-axis as a function of distance from the composite center. The scale bars are 5 μm, the voxel size is (38.8 nm)3 and the measurements were conducted under cryogenic conditions.

Similar articles

Cited by

References

    1. Zhang S. J., Pelligra C. I., Feng X. D., Osuji C. O. Adv. Mater. 2018;30(18):23. - PubMed
    1. Hao Y. N., Wang X. H., Bi K., Zhang J. M., Huang Y. H., Wu L. W., Zhao P. Y., Xu K., Lei M., Li L. T. Nano Energy. 2017;31:49–56.
    1. Chen A. P., Su Q., Han H., Enriquez E., Jia Q. X. Adv. Mater. 2019;31(4):1803241. - PubMed
    1. Ning Z., Gong X., Comin R., Walters G., Fan F., Voznyy O., Yassitepe E., Buin A., Hoogland S., Sargent E. H. Nature. 2015;523:324–328. - PubMed
    1. Green D. C., Holden M. A., Levenstein M. A., Zhang S. H., Johnson B. R. G., de Pablo J. G., Ward A., Botchway S. W., Meldrum F. C. Nat. Commun. 2019;10:206. - PMC - PubMed