

Determination of protein-ligand binding modes using fast multi-dimensional NMR with hyperpolarization
- PMID: 32874513
- PMCID: PMC7441707
- DOI: 10.1039/d0sc00266f
Determination of protein-ligand binding modes using fast multi-dimensional NMR with hyperpolarization
Abstract
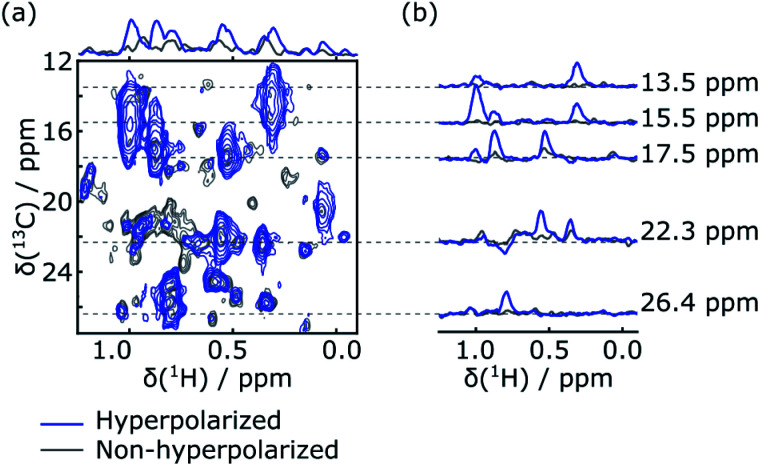
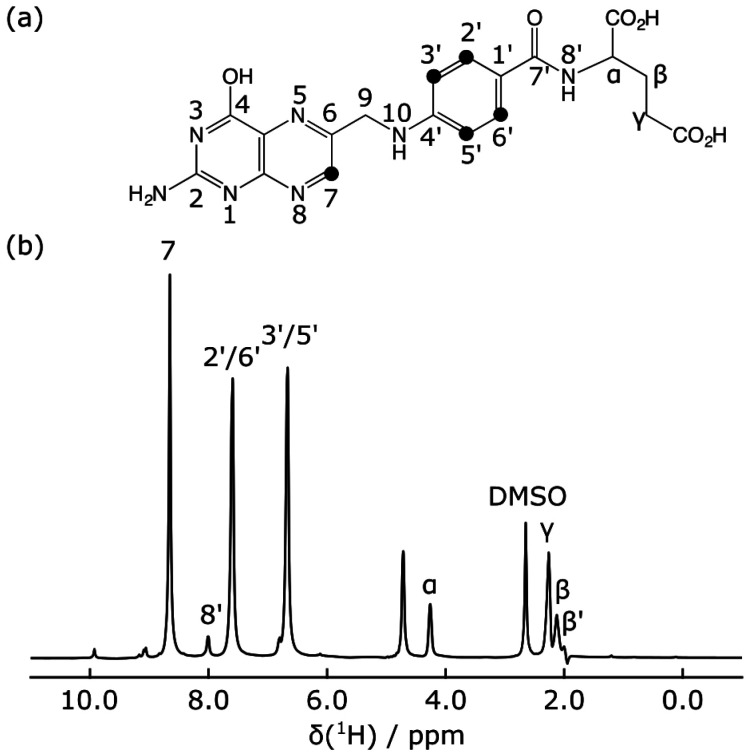
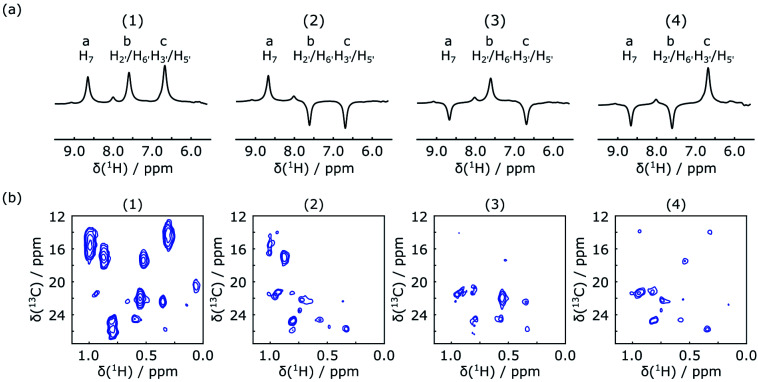
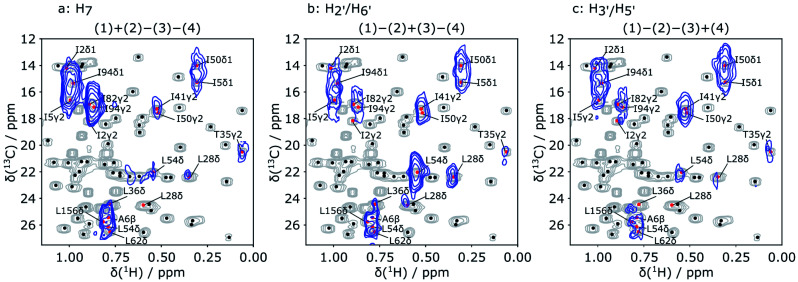
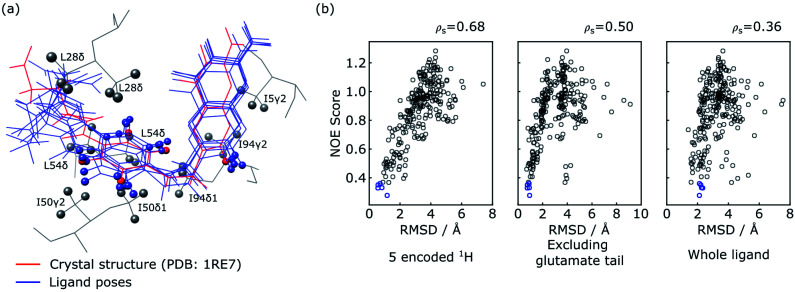
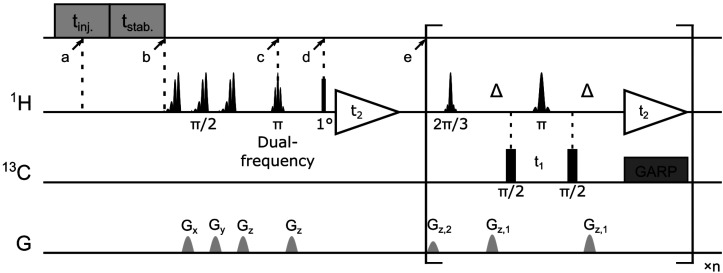
Elucidation of small molecule-protein interactions provides essential information for understanding biological processes such as cellular signaling, as well as for rational drug development. Here, multi-dimensional NMR with sensitivity enhancement by dissolution dynamic nuclear polarization (D-DNP) is shown to allow the determination of the binding epitope of folic acid when complexed with the target dihydrofolate reductase. Protein signals are selectively enhanced by polarization transfer from the hyperpolarized ligand. A pseudo three-dimensional data acquisition with ligand-side Hadamard encoding results in protein-side [13C, 1H] chemical shift correlations that contain intermolecular nuclear Overhauser effect (NOE) information. A scoring function based on this data is used to select pre-docked ligand poses. The top five poses are within 0.76 Å root-mean-square deviation from a reference structure for the encoded five protons, showing improvements compared with the poses selected by an energy-based scoring function without experimental inputs. The sensitivity enhancement provided by the D-DNP combined with multi-dimensional NMR increases the speed and potentially the selectivity of structure elucidation of ligand binding epitopes.
This journal is © The Royal Society of Chemistry 2020.
Figures
Similar articles
-
Determination of Ligand Binding Epitope Structures Using Polarization Transfer from Hyperpolarized Ligands.J Med Chem. 2019 Mar 14;62(5):2419-2427. doi: 10.1021/acs.jmedchem.8b01711. Epub 2019 Feb 20. J Med Chem. 2019. PMID: 30715877
-
Site specific polarization transfer from a hyperpolarized ligand of dihydrofolate reductase.J Biomol NMR. 2016 May;65(1):41-8. doi: 10.1007/s10858-016-0037-x. Epub 2016 May 17. J Biomol NMR. 2016. PMID: 27189223 Free PMC article.
-
Amplification of Nuclear Overhauser Effect Signals by Hyperpolarization for Screening of Ligand Binding to Immobilized Target Proteins.Anal Chem. 2020 Oct 20;92(20):13718-13723. doi: 10.1021/acs.analchem.0c01071. Epub 2020 Sep 29. Anal Chem. 2020. PMID: 32897681
-
Applications of dissolution dynamic nuclear polarization in chemistry and biochemistry.Magn Reson Chem. 2018 Jul;56(7):566-582. doi: 10.1002/mrc.4735. Epub 2018 Apr 24. Magn Reson Chem. 2018. PMID: 29602263 Review.
-
Overview of Probing Protein-Ligand Interactions Using NMR.Curr Protoc Protein Sci. 2015 Aug 3;81:17.18.1-17.18.24. doi: 10.1002/0471140864.ps1718s81. Curr Protoc Protein Sci. 2015. PMID: 26237672 Review.
Cited by
-
Nuclear Overhauser spectroscopy in hyperpolarized water - chemical vs. magnetic exchange.Chem Commun (Camb). 2022 Oct 18;58(83):11661-11664. doi: 10.1039/d2cc03735a. Chem Commun (Camb). 2022. PMID: 36169286 Free PMC article.
-
Solution NMR investigations of integral membrane proteins: Challenges and innovations.Curr Opin Struct Biol. 2023 Oct;82:102654. doi: 10.1016/j.sbi.2023.102654. Epub 2023 Aug 3. Curr Opin Struct Biol. 2023. PMID: 37542910 Free PMC article. Review.
-
Parahydrogen in Reversible Exchange Induces Long-Lived 15N Hyperpolarization of Anticancer Drugs Anastrozole and Letrozole.Anal Chem. 2023 May 23;95(20):7822-7829. doi: 10.1021/acs.analchem.2c04817. Epub 2023 May 10. Anal Chem. 2023. PMID: 37163687 Free PMC article.
-
Dynamic Nuclear Polarization Using 3D Aromatic Boron Cluster Radicals.J Phys Chem Lett. 2021 Jan 14;12(1):13-18. doi: 10.1021/acs.jpclett.0c03216. Epub 2020 Dec 9. J Phys Chem Lett. 2021. PMID: 33296205 Free PMC article.
-
Hyperpolarized water as universal sensitivity booster in biomolecular NMR.Nat Protoc. 2022 Jul;17(7):1621-1657. doi: 10.1038/s41596-022-00693-8. Epub 2022 May 11. Nat Protoc. 2022. PMID: 35546640 Free PMC article. Review.
References
-
- Arkin M. R., Wells J. A. Nat. Rev. Drug Discovery. 2004;3:301–317. - PubMed
-
- McCormick F. Curr. Opin. Biotechnol. 2000;11:593–597. - PubMed
-
- Piazza I., Kochanowski K., Cappelletti V., Fuhrer T., Noor E., Sauer U., Picotti P. Cell. 2018;172:358–372. - PubMed
-
- Mattos C. Trends Biochem. Sci. 2002;27:203–208. - PubMed
-
- Meyer B., Peters T. Angew. Chem., Int. Ed. 2003;42:864–890. - PubMed
LinkOut - more resources
Full Text Sources