. 2020 Jul 8;7(7):200632.
doi: 10.1098/rsos.200632. eCollection 2020 Jul.

Contrasting evolutionary responses in two co-distributed species of Galaxias (Pisces, Galaxiidae) in a river from the glaciated range in Southern Chile

Affiliations

Contrasting evolutionary responses in two co-distributed species of Galaxias (Pisces, Galaxiidae) in a river from the glaciated range in Southern Chile

P F Victoriano et al. R Soc Open Sci. .

Abstract

Life-history traits are among the most important factors affecting population abundance and genetic diversity of species. Here, we analysed the genetic patterns of two Galaxias species with different life-history traits to investigate how these biological differences impacted their evolution in the Valdivia River basin, Southern Chile. We analysed mitochondrial DNA (mtDNA) sequences from 225 individuals of Galaxias maculatus and 136 of G. platei to compare patterns of genetic diversity, structure and demographic growth across the basin. Galaxias maculatus presented higher genetic diversity and higher genetic structure than G. platei. Demographic analyses showed G. maculatus kept a higher population size over time, with a signal of demographic expansion in the last 250 kyr. Whereas Galaxias platei, exhibited lower, but constant population size over time. Furthermore, haplotype networks revealed higher lineage diversity in G. maculatus with a tendency to occupy different areas of the basin. Coalescent simulations ruled out that genetic differences between species could be explained by stochastic processes (genetic drift), suggesting species-specific biological differences as responsible for the observed genetic differences. We discuss how differences in life-history traits and past glaciations interact to shape the evolutionary history of the two Galaxias species.

Keywords: Last Glacial Maximum; comparative phylogeography; freshwater fishes; genetic variation; idiosyncratic responses.


Conflict of interest statement

The authors declare no competing interests.

Figures

Figure 1.
Figure 1.
Distribution map, showing sampling localities and river zones in the Valdivia River basin, South Chile. Dotted line represents the west margin of the ice sheet during the Last Glacial Maximum.
Figure 2.
Figure 2.
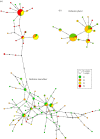
Haplotype network (median-joining) for (a) Galaxias maculatus and (b) Galaxias platei based on the mtDNA D-loop region. Circle size is proportional to haplotype frequency; Colours represent the study zones as represented in the distribution map (figure 1).
Figure 3.
Figure 3.
Historical estimates of female effective population size through time constructed using the Bayesian skyline model for (a) Galaxias maculatus and (b) G. platei from the Valdivia River basin based on the mtDNA D-loop region. Myr, million years.
Figure 4.
Figure 4.
Results from the genetic simulation analyses. Genetic data were simulated under parameters that fitted the empirical data of one species (Galaxias platei) to test whether differences in genetic patterns in relation to the other species (G. maculatus) were possible under coalescent stochasticity as the only process acting to produce variation. Frequency distributions for three summary statistics—distribution for segregating sites (a), number of haplotypes (b), and pairwise number of nucleotide differences (c)—obtained from the simulated data are compared against the empirical values of G. maculatus (vertical dashed line).

References

    1. Beheregaray LB. 2008. Twenty years of phylogeography: the state of the field and the challenges for the Southern Hemisphere. Mol. Ecol. 17, 3754–3774. (10.1111/j.1365-294X.2008.03857.x) - DOI - PubMed
    1. Turchetto-Zolet AC, Pinheiro F, Salgueiro F, Palma-Silva C. 2013. Phylogeographical patterns shed light on evolutionary process in South America. Mol. Ecol. 22, 1193–1213. (10.1111/mec.12164) - DOI - PubMed
    1. Ruzzante DE, Walde SJ, Cussac VE, Dalebout ML, Seibert J, Ortubay S, Habit E. 2006. Phylogeography of the Percichthyidae (Pisces) in Patagonia: roles of orogeny, glaciation, and volcanism. Mol. Ecol. 15, 2949–2968. (10.1111/j.1365-294X.2006.03010.x) - DOI - PubMed
    1. Muñoz-Ramírez CP, Unmack PJ, Habit E, Johnson JB, Cussac VE, Victoriano P. 2014. Phylogeography of the ancient catfish family Diplomystidae: biogeographic, systematic, and conservation implications. Mol. Phylogenet. Evol. 73, 146–160. (10.1016/j.ympev.2014.01.015) - DOI - PubMed
    1. Vera-Escalona I, Senthivasan S, Habit E, Ruzzante DE. 2018. Past, present, and future of a freshwater fish metapopulation in a threatened landscape. Conserv. Biol. 32, 849–859. (10.1111/cobi.13093) - DOI - PubMed

LinkOut - more resources