. 2020 Dec;9(4):560-574.
doi: 10.1016/j.hlpt.2020.08.013. Epub 2020 Aug 27.

The first months of the COVID-19 pandemic in Spain

Affiliations

The first months of the COVID-19 pandemic in Spain

Josefa Henríquez et al. Health Policy Technol. 2020 Dec.

Abstract

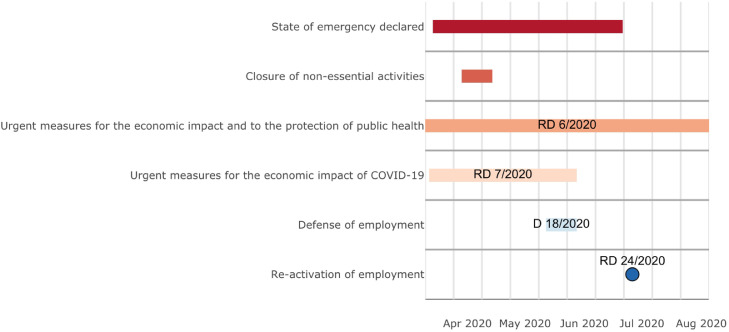
Background: The COVID-19 outbreak has led to an unprecedented crisis in Spain. After Italy, the spread of the virus was quick, and Spain became the second epicenter in Europe by number of cases and deceased. To tackle the outbreak and contain the spread, the Spanish authorities undertook exceptional measures based on a generalized lockdown by which the majority of the economic activity ceased for several weeks.

Objectives: The goal of this paper is to examine the spread of COVID-19 in Spain from February to May 2020, as well as the public policies and technologies used to contain the evolution of the pandemic. In particular it aims to assess the effectivity of the policies applied within the different autonomous communities. Cases are presented until August as well as the main changes in containment and mitigation measures.

Methods: Data was collected from various official sources, including government reports, press releases and datasets provided by national and international level institutions.

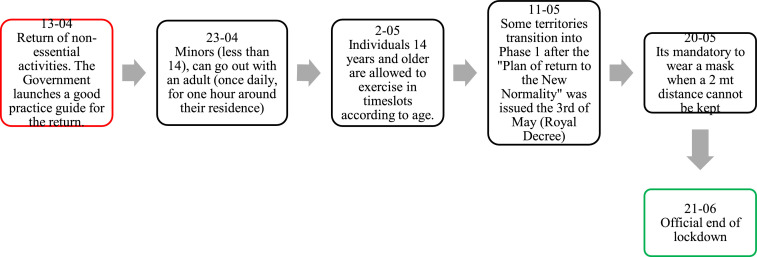
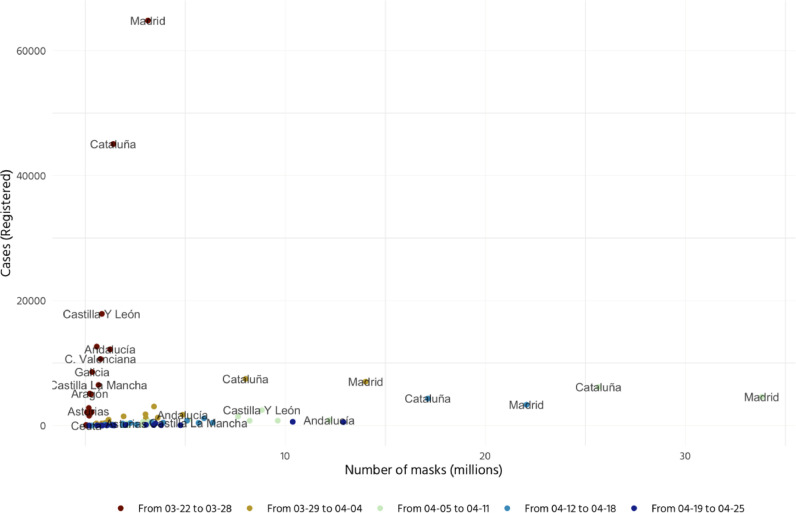
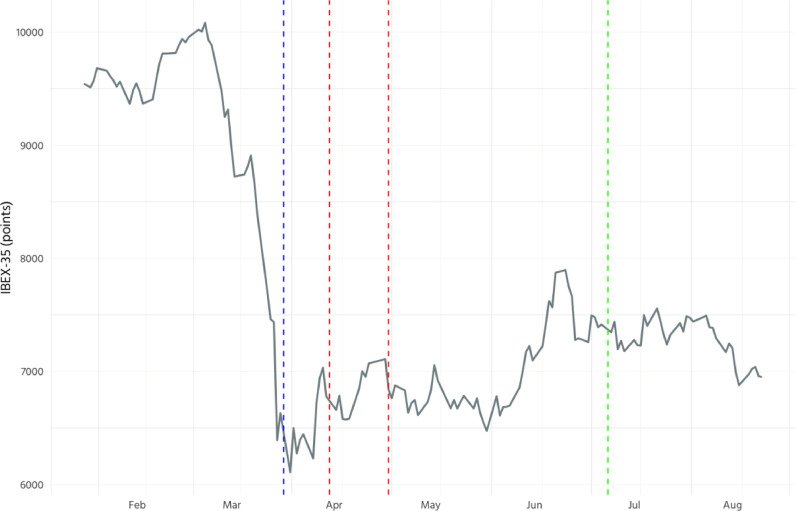
Results: We show that the main measure to contain the spread of the pandemic was a stringent confinement policy enforced through fines. It resulted in a substantial reduction in the mobility and the economic activity. At a regional level, the negative consequences of the crisis affected differently across regions.

Keywords: COVID-19; Policy and technology; Spain.


Figures

Fig. 1
Fig. 1
Cumulative cases, deceased and recovered (regions) Note: Blue (first) dotted line indicates 15–03 (start of lockdown), red (second and third, respectively) dotted lines indicate 01–04 (close of non-essential activities) and 15–04 (lifting of restriction of non-essential activities). The data compiled correspond to the cumulative cases up to 15th of May. Deaths are recorded as a person that has tested positive to COVID-19 and has passed away. Cases correspond to those with positive PCR tests. Confirmed cases do not come from the sum of hospitalized, recovered and deceased, as they are not mutually exclusive. Deceased and recovered could have been hospitalized and therefore be in the two groups. (For interpretation of the references to color in this figure legend, the reader is referred to the web version of this article.)
Fig. 2
Fig. 2
Fatality rates over time (provinces) Note: Fatality rates are represented by quintiles and calculated as the proportion of deceases among registered cases. Figures are not cumulative and refer to each date in the panels instead. A zero fatality rate on that day means no deaths were recorded. (For interpretation of the references to color in this figure legend, the reader is referred to the web version of this article.)
Fig. 3
Fig. 3
Hospitalisations by age groups and gender (cumulative) Note: Red dotted lines indicate 01–04 (close of non-essential activities) and 15–04 (lifting of restriction of non-essential activities).
Fig. 4
Fig. 4
ICU referrals by age groups and gender (cumulative) Note: Red dotted lines indicate 01–04 (close of non-essential activities) and 15–04 (lifting of restriction of non-essential activities).
Fig. 5
Fig. 5
Hospitalisations by type of disease (cumulative) Note: Red dotted lines indicate 01–04 (close of non-essential activities) and 15–04 (lifting of restriction of non-essential activities).
Fig. 6
Fig. 6
Policy interventions in February and March to contain the spread of the virus until phase-out of restrictions Note: in blue the start of lockdown, in red the closure of nonessential activities, and in green the end of lockdown. (For interpretation of the references to color in this figure legend, the reader is referred to the web version of this article.)
Fig. 7
Fig. 7
Stringency index and daily cases (rolling 7-day average). Note: Stringency Index represents a measure of containment. Blue (first) dotted line indicates start of lockdown (15th March), red (second and third) dotted lines indicate the closure of non-essential activities (1st-14th April). Green (fourth) dotted line represents the official end of lockdown (21st June). (For interpretation of the references to color in this figure legend, the reader is referred to the web version of this article.)
Fig. 8
Fig. 8
Mobility per AC Note: Rolling 7-day average of the mobility in each AC. The percentage of mobility corresponds to that with respect to the reference period 14–20 February. Blue (first) dotted line indicates start of lockdown (15-03), red (second and third) dotted lines indicate the closure of non-essential activities (1st-14th April). Green (fourth) dotted line represents the official end of lockdown (21-06). (For interpretation of the references to color in this figure legend, the reader is referred to the web version of this article.)
Fig. 9
Fig. 9
Policy interventions to contain the spread of the virus starting with the phase out of restrictions
Fig. 10
Fig. 10
Main economic policies.
Fig. 11
Fig. 11
Delivered masks to AC weekly and daily cases (10-03 to 20-04). Note: There is missing information between the 20th and before the 19th of May. (For interpretation of the references to color in this figure legend, the reader is referred to the web version of this article.)
Fig. 12
Fig. 12
Ibex-35 trends January - August 2020. Note: Blue (first) dotted line indicates start of lockdown (15th March), red (second and third) dotted lines indicate the closure of non-essential activities (1st-14th April). Green (fourth) dotted line represents the official end of lockdown (21st June).

References

    1. Ministerio de Sanidad, Consumo y Bienestar Social. Estadística de Centros Sanitarios de Atención Especializada. [Online]; 2017. Available from:https://www.mscbs.gob.es/estadisticas/microdatos.do.
    1. Bernal-Delgado E., García-Armesto S., Oliva J., Sánchez Martínez F., Repullo J., Peña- Longobardo L., et al. Spain: health system review.; 2018. - PubMed
    1. Instituto de Salud Carlos III. Situación de COVID-19 en España. [Online]; 2020. Available from:https://covid19.isciii.es.
    1. Ministerio de Sanidad, Consumo y Servicios Sociales. Actualizacion. Enfermedad por coronavirus (COVID-19).; 2020.
    1. Ministerio de Sanidad. La inmunidad de la población española experimenta un leve incremento con una tasa del 5,21% en la segunda ronda del ENE-Covid19. [Online]; 2020. Available from:https://www.mscbs.gob.es/gabinete/notasPrensa.do?id=4950.

LinkOut - more resources