

Adipose tissue from metabolic syndrome mice induces an aberrant miRNA signature highly relevant in prostate cancer development
- PMID: 32875710
- PMCID: PMC7607170
- DOI: 10.1002/1878-0261.12788
Adipose tissue from metabolic syndrome mice induces an aberrant miRNA signature highly relevant in prostate cancer development
Abstract
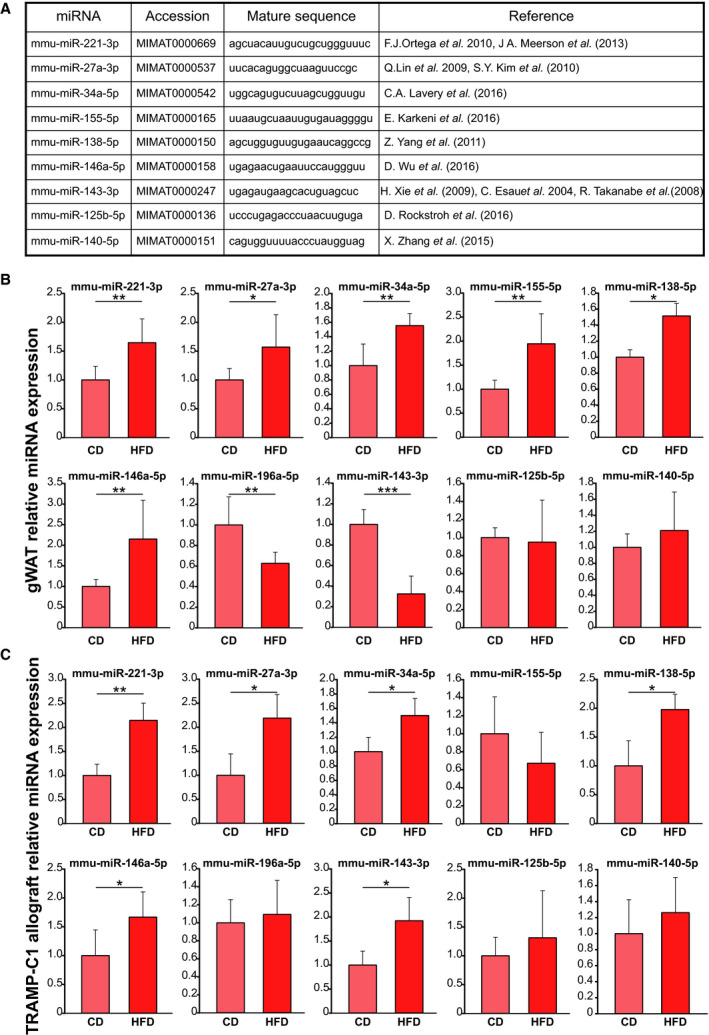
Prostate cancer (PCa) remains an important public health concern in Western countries. Metabolic syndrome (MeS) is a cluster of pathophysiological disorders with increasing prevalence in the general population that is a risk factor for PCa. Several studies have determined that a crosstalk between white adipose tissue (WAT) and solid tumors favors cancer aggressiveness. In this work, our main goal was to investigate the interaction between WAT and PCa cells through microRNAs (miRNAs), in MeS mice. We developed a MeS-like disease model using C57BL/6J mice chronically fed with high-fat diet (HFD) that were inoculated with TRAMP-C1 PCa cells. A group of five miRNAs (mmu-miR-221-3p, 27a-3p, 34a-5p, 138-5p, and 146a-5p) were increased in gonadal WAT (gWAT), tumors, and plasma of MeS mice compared to control animals. Three of these five miRNAs were detected in the media from gWAT and TRAMP-C1 cell cocultures, and significantly increased in MeS context. More importantly, hsa-miR-221-3p, 146a-5p, and 27a-3p were increased in bloodstream of PCa patients compared to healthy donors. Using miRNA microarrays, we found that 121 miRNAs were differentially released to the coculture media between HFD-gWAT and tumor cells compared to control diet-gWAT and tumor cells. Target genes for the 66 most deregulated miRNAs were involved in common pathways, mainly related to fatty acid metabolism, ER protein processing, amino acid degradation, PI3K AKT signaling, and PCa. Our findings show for the first time a signature of five miRNAs as important players involved in the interaction between WAT and PCa in MeS mice. Further research will be necessary to track these miRNAs in the interaction between these tissues as well as their role in PCa patients with MeS.
Keywords: adipose tissue; metabolic syndrome; miRNA; prostate cancer.
© 2020 The Authors. Published by FEBS Press and John Wiley & Sons Ltd.
Conflict of interest statement
The authors declare no conflict of interest.
Figures


Similar articles
-
CTBP1 depletion on prostate tumors deregulates miRNA/mRNA expression and impairs cancer progression in metabolic syndrome mice.Cell Death Dis. 2019 Apr 1;10(4):299. doi: 10.1038/s41419-019-1535-z. Cell Death Dis. 2019. PMID: 30931931 Free PMC article.
-
CTBP1/CYP19A1/estradiol axis together with adipose tissue impacts over prostate cancer growth associated to metabolic syndrome.Int J Cancer. 2019 Mar 1;144(5):1115-1127. doi: 10.1002/ijc.31773. Epub 2018 Oct 9. Int J Cancer. 2019. PMID: 30152543
-
MicroRNA-27a-5p regulation by promoter methylation and MYC signaling in prostate carcinogenesis.Cell Death Dis. 2018 Feb 7;9(2):167. doi: 10.1038/s41419-017-0241-y. Cell Death Dis. 2018. PMID: 29415999 Free PMC article.
-
[Correlation between autophagy-associated miRNAs and prostate cancer: An update].Zhonghua Nan Ke Xue. 2024 Jan;30(1):77-82. Zhonghua Nan Ke Xue. 2024. PMID: 39046418 Review. Chinese.
-
Role of Metabolism and Metabolic Pathways in Prostate Cancer.Metabolites. 2023 Jan 25;13(2):183. doi: 10.3390/metabo13020183. Metabolites. 2023. PMID: 36837801 Free PMC article. Review.
Cited by
-
MAFG-DT promotes prostate cancer bone metastasis through activation of the Wnt/β-catenin pathway.Front Oncol. 2024 Dec 13;14:1461546. doi: 10.3389/fonc.2024.1461546. eCollection 2024. Front Oncol. 2024. PMID: 39735608 Free PMC article.
-
Molecular mechanism of CD163+ tumor-associated macrophage (TAM)-derived exosome-induced cisplatin resistance in ovarian cancer ascites.Ann Transl Med. 2022 Sep;10(18):1014. doi: 10.21037/atm-22-4267. Ann Transl Med. 2022. PMID: 36267748 Free PMC article.
-
Incorporating adipose tissue into a CT-based deep learning nomogram to differentiate granulomas from lung adenocarcinomas.iScience. 2024 Aug 19;27(10):110733. doi: 10.1016/j.isci.2024.110733. eCollection 2024 Oct 18. iScience. 2024. PMID: 39474083 Free PMC article.
-
Elevated miR-221-3p inhibits epithelial-mesenchymal transition and biochemical recurrence of prostate cancer via targeting KPNA2: an evidence-based and knowledge-guided strategy.BMC Cancer. 2025 Jan 8;25(1):34. doi: 10.1186/s12885-025-13444-1. BMC Cancer. 2025. PMID: 39780096 Free PMC article.
-
Hsa-miR-133a-3p, miR-1-3p, GOLPH3 and JUP combination results in a good biomarker to distinguish between prostate cancer and non-prostate cancer patients.Front Oncol. 2022 Oct 26;12:997457. doi: 10.3389/fonc.2022.997457. eCollection 2022. Front Oncol. 2022. PMID: 36387263 Free PMC article.
References
-
- Siegel RL, Miller KD & Jemal A (2020) Cancer statistics, 2020. CA Cancer J Clin. 70(1), 7–30. - PubMed
-
- NCEP‐ATPIII (2002) Third Report of the National Cholesterol Education Program (NCEP) Expert Panel on Detection, Evaluation, and Treatment of High Blood Cholesterol in Adults (Adult Treatment Panel III) final report. Communication 106, 3143–3421. - PubMed
-
- Gacci M, Russo GI, De Nunzio C, Sebastianelli A, Salvi M, Vignozzi L, Tubaro A, Morgia G & Serni S (2017) Meta‐analysis of metabolic syndrome and prostate cancer. Prostate Cancer Prostatic Dis 20, 146–155. - PubMed
Publication types
MeSH terms
Substances
LinkOut - more resources
Full Text Sources
Medical
Molecular Biology Databases
Miscellaneous
