

SARS-CoV-2 targets neurons of 3D human brain organoids
- PMID: 32876341
- PMCID: PMC7560208
- DOI: 10.15252/embj.2020106230
SARS-CoV-2 targets neurons of 3D human brain organoids
Abstract
COVID-19 pandemic caused by SARS-CoV-2 infection is a public health emergency. COVID-19 typically exhibits respiratory illness. Unexpectedly, emerging clinical reports indicate that neurological symptoms continue to rise, suggesting detrimental effects of SARS-CoV-2 on the central nervous system (CNS). Here, we show that a Düsseldorf isolate of SARS-CoV-2 enters 3D human brain organoids within 2 days of exposure. We identified that SARS-CoV-2 preferably targets neurons of brain organoids. Imaging neurons of organoids reveal that SARS-CoV-2 exposure is associated with altered distribution of Tau from axons to soma, hyperphosphorylation, and apparent neuronal death. Our studies, therefore, provide initial insights into the potential neurotoxic effect of SARS-CoV-2 and emphasize that brain organoids could model CNS pathologies of COVID-19.
Keywords: SARS-CoV-2; Tau pathology; brain organoids; cell death; neurons.
© 2020 The Authors. Published under the terms of the CC BY NC ND 4.0 license.
Conflict of interest statement
The authors declare that they have no conflict of interest.
Figures
- A
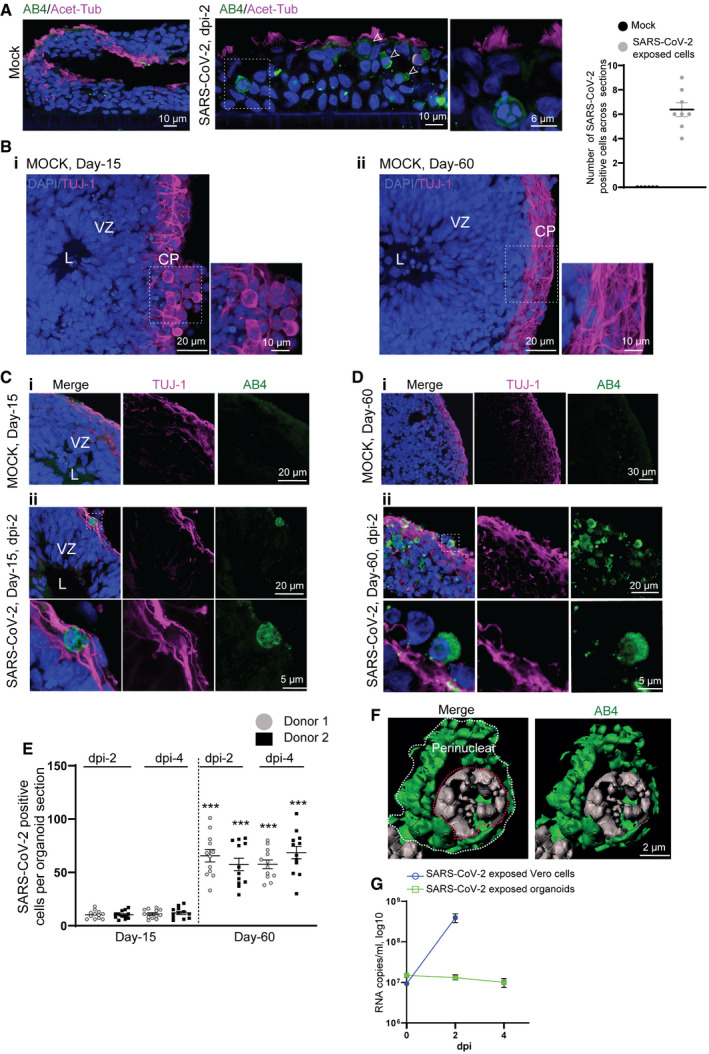
A positive control experiment. SARS‐CoV-2 readily targets ciliated human respiratory epithelial cells (hRECs). Acetylated α‐tubulin labels cilia. Arrows point SARS‐CoV-2‐positive cells labeled by AB4 (green). Figures display scale bars. Bar diagram at right quantifies frequencies of SARS‐CoV-2‐positive cells in hRECs. At least six hREC sections from three (n = 3) independent samples were examined. Data presented as mean ± SEM.
- B
Mock organoids of two age groups Day‐15 (i) and‐60 (ii) display typical cytoarchitecture of brain organoids. L, lumen, VZ, ventricular Zone is containing compact and palisade‐like elongated nuclei of neural progenitor cells (NPCs, blue) and CP, a cortical plate containing TUJ‐1-positive neurons (magenta). Note a distinct difference TUJ‐1 labeling pattern between younger (Day‐15) and older (Day‐60) brain organoid. Figures display scale bars. Representative images from eight organoids cultured in at least three independent batches (n = 3) derived from donor‐1 (IMR90) iPSC line.
- C
Compared to mock organoids (i), SARS‐CoV-2‐exposed Day‐15 organoids display SARS‐CoV-2‐positive cells (AB4, green) in their outer periphery, a region of the cortical plate (ii) that is specified by TUJ-1‐positive neurons (magenta). L, the lumen of a VZ, the inner area of an organoid where NPCs are located, is free from SARS‐CoV-2‐positive cells. Magnified region (dotted while box) is given below. At least 10 organoids from five different batches (n = 5) are tested. Figures display scale bars.
- D
SARS-CoV‐2-exposed Day‐60 organoids. Compared to Day 15 organoids and mock (i), Day‐60 organoids display an increased number of SARS‐CoV-2‐positive cells (AB4, green) in their cortical plate that is specified by TUJ-1‐positive neurons (magenta) (ii). Magnified region (dotted while box) is given below, showing the perinuclear location of SARS‐CoV-2 in cortical neurons. At least 10 organoids from five different batches (n = 5) are tested. Figures display scale bars.
- E
The bar diagram quantifies frequencies of SARS‐CoV-2‐positive cells in different brain organoid sections derived from two donor iPSC lines (IMR90 and Crx‐iPS, see Materials and Methods). Please note that each point represents one organoid section. SARS‐CoV-2 shows an enhanced tropism for Day‐60 organoids. Note, comparative statistics are shown between different age groups and respective days post‐infection (dpi) of organoids, and the significance is given as Asterisks in Day‐60 groups. There is no significant difference in SARS‐CoV-2‐positive cells between 2‐ and 4‐dpi within each age groups. At least twelve organoids sections from four (n = 4) independent batches, from each donor and day post‐infections (dpi), were analyzed. One‐way ANOVA, followed by Tukey's multiple comparisons test, ***P < 0.001. Data presented as mean ± SEM.
- F
Subcellular localization SARS‐CoV-2 in cortical neurons. High‐resolution imaging and deconvolution show perinuclear localization of SARS‐CoV-2. SARS‐CoV-2 (AB4, green) and nucleus (gray). Figures display scale bars. Representative images from at least 200 cells are examined. White line surrounds perinuclear border, and red line encircles the nucleus.
- G
Determination of viral progeny. Supernatants of SARS‐CoV-2 exposed Vero cells, and brain organoids were analyzed for viral RNA assessed by qRT–PCR. While an increase in viral RNA was detected in the supernatants of Vero cells, no apparent increase was identified in brain organoid supernatants. Data are obtained from five technical replicates from four (n = 4) independent batches of organoids. Data presented as mean ± SEM.
- A
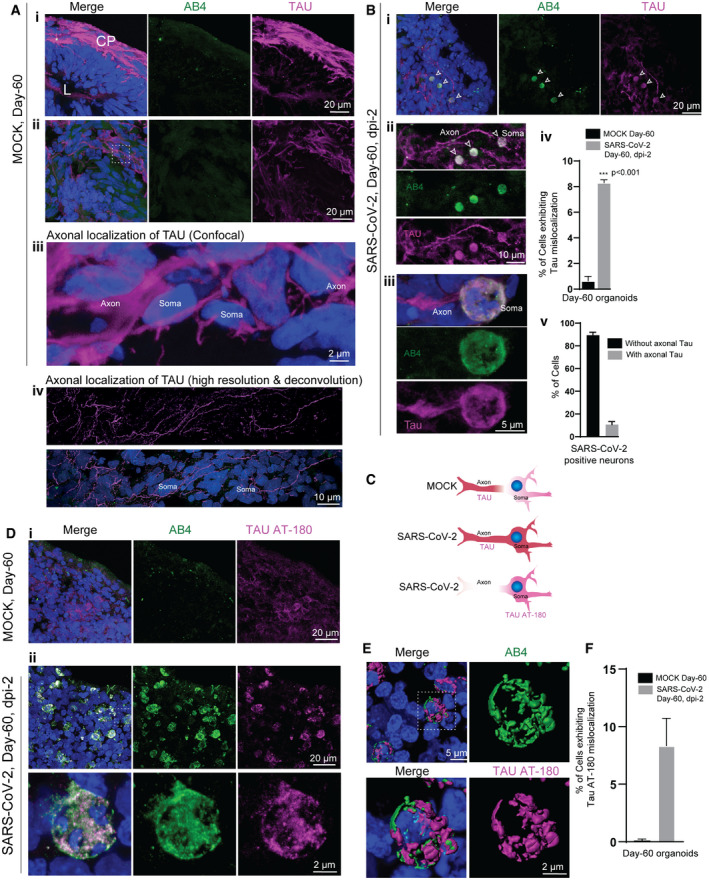
Tau immunoreactivity (magenta) specifies the cortical plate (CP) surrounding the lumen (L) (i). Selected optic sections at high magnification (ii and iii) and high‐resolution imaging (iv) show Tau localization only in axons of cortical neurons. Note the somas of neurons are free from Tau protein. At least eight organoids from four different batches (n = 4) are tested. Figures display scale bars.
- B
Tau localization in SARS‐CoV-2‐positive neurons (AB4, green) in selected optic sections (i). Note, in contrast, to control groups, SARS‐CoV-2‐exposed organoids display mislocalized Tau (magenta) majorly into the somas of neurons (arrowheads). Selected confocal slices are shown to distinguish Tau mislocalization into neuronal soma (arrowheads). At high magnification, neuronal soma is further specified by the perinuclear localization of SARS‐CoV-2 (green) (ii and iii). Bar diagrams at right quantifies the percentage of neurons (Mock and SARS‐CoV-2 exposed) exhibiting mislocalized Tau (iv) and the fraction of SARS‐CoV-2‐positive neurons exhibiting Tau‐positive axons spanning different cortical areas (v). For statistics, at least 300 cells from six organoids from four different batches (n = 4) were tested. Figures display scale bars. Unpaired t‐test with Welch's correction, ***P < 0.001. Data presented as mean ± SD.
- C
Schematic cartoon of differential Tau distribution in mock compared to SARS‐CoV-2‐positive neurons. In mock, Tau is sorted mainly to axons. In SARS‐CoV-2‐positive neurons, Tau is missorted to the soma (determined by Pan‐Tau antibody). Furthermore, phosphorylated Tau (at T231) majorly localizes in the soma (bottom panel, determined by Tau AT‐180 antibody, see below).
- D
In contrast to controls (i), Tau AT180 antibody (magenta) that specifically recognizes the phosphorylated Threonine 231 of Tau protein distinctly localizes at the somas of SARS‐CoV-2‐positive neurons (AB4, green) (ii). At least four organoids from two different batches (n = 2) are tested. Figures display scale bars.
- E
Co‐localization of SARS‐CoV-2 (AB4, green) and phosphorylated Tau protein (magenta) at somas of cortical neurons revealed by high‐resolution imaging and deconvolution. Representative images from at least 300 cells examined. Figures display scale bars.
- F
The bar diagram quantifies the fraction of Tau AT180‐positive neurons that co‐localize with SARS‐CoV-2‐positive neurons. For statistics, at least 250 cells from four organoids and two independent batches (n = 2) were examined. Unpaired t‐test with Welch's correction. Data presented as mean ± SEM.
- A
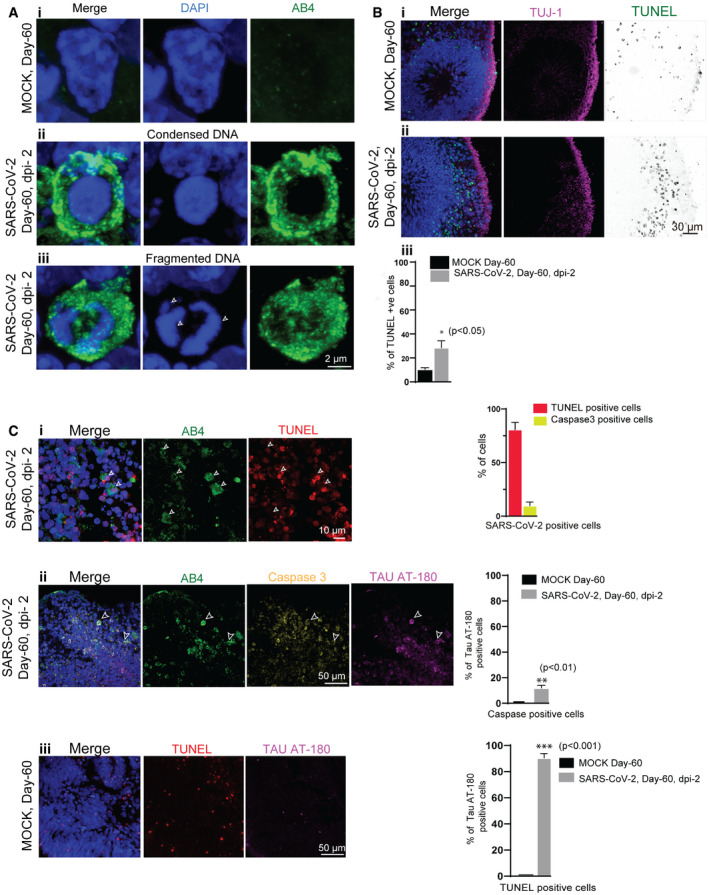
Cells from mock organoids display a healthy nucleus labeled by DAPI (blue) (i). SARS‐CoV-2‐positive cells (green) display condensed (middle panel, ii) and fragmented DNA (bottom panel, iii, arrows). At least 75 cells from two (n = 2) independent batches of organoids were examined. Figures display scale bars.
- B
Compared to mock organoids, (i) SARS‐CoV-2‐exposed organoids (ii) display increased TUNEL‐positive cells (displayed as inverted LUT) at the cortical plate that is specified by TUJ‐1 (magenta). At least four organoids from two (n = 2) independent batches of organoids were examined. Figures display scale bars. The bar diagram below quantifies the frequencies of TUNEL‐positive cells between mock and SARS‐CoV-2‐exposed organoids. Four organoids from two (n = 2) independent batches were examined. Unpaired t‐test, *P < 0.05. Data presented as mean ± SD.
- C
Most of the SARS‐CoV-2‐positive cells (AB4, green) are TUNEL‐positive (i) and some of the SARS‐CoV-2‐positive cells are caspase‐positive (ii). Caspase‐positive cells in SARS‐CoV-2‐exposed organoids display pT231Tau localization at the cell soma specified by AT‐180 (ii), which are not observed in mock organoids (iii). Arrowheads point SARS‐CoV-2‐positive cells (AB4, green) that are also positive for TUNNEL (red), caspase 3 (yellow), and Tau AT‐180 (magenta). Figures display scale bars. Bar diagrams at right quantifies proportions of TUNEL and caspase‐positive cells among SARS‐CoV-2‐positive cells. The second graph below quantifies the proportions of pT231Tau‐positive cells among caspase‐positive cells between control and virus exposed groups. At least 400 cells from four organoids and two independent (n = 2) batches were examined. Unpaired t‐test, **P < 0.01. Data presented as mean ± SEM. TUNEL‐positive cells in control un‐exposed organoids do not contain pT231Tau (iii). Figures display scale bars. Bar diagrams at right quantifies proportions of pT231Tau‐positive cells among TUNNEL‐positive cells between control and virus exposed groups. At least 350 cells from 4 organoids and two independent (n = 2) batches were examined. Unpaired t‐test, ***P < 0.001. Data presented as mean ± SEM.
References
-
- Augustinack JC, Sanders JL, Tsai LH, Hyman BT (2002a) Colocalization and fluorescence resonance energy transfer between cdk5 and AT8 suggests a close association in pre‐neurofibrillary tangles and neurofibrillary tangles. J Neuropathol Exp Neurol 61: 557–564 - PubMed
-
- Augustinack JC, Schneider A, Mandelkow EM, Hyman BT (2002b) Specific tau phosphorylation sites correlate with severity of neuronal cytopathology in Alzheimer's disease. Acta Neuropathol 103: 26–35 - PubMed
-
- Baig AM, Khaleeq A, Ali U, Syeda H (2020) Evidence of the COVID‐19 virus targeting the CNS: tissue distribution, host‐virus interaction, and proposed neurotropic mechanisms. ACS Chem Neurosci 11: 995–998 - PubMed
Publication types
MeSH terms
Substances
Grants and funding
LinkOut - more resources
Full Text Sources
Miscellaneous
