. 2020 Sep 2;20(9):1.
doi: 10.1167/jov.20.9.1.

Machine learning-based classification of viewing behavior using a wide range of statistical oculomotor features

Affiliations

Machine learning-based classification of viewing behavior using a wide range of statistical oculomotor features

Timo Kootstra et al. J Vis. .

Abstract

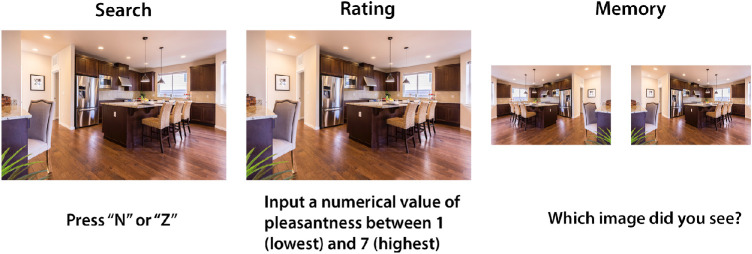
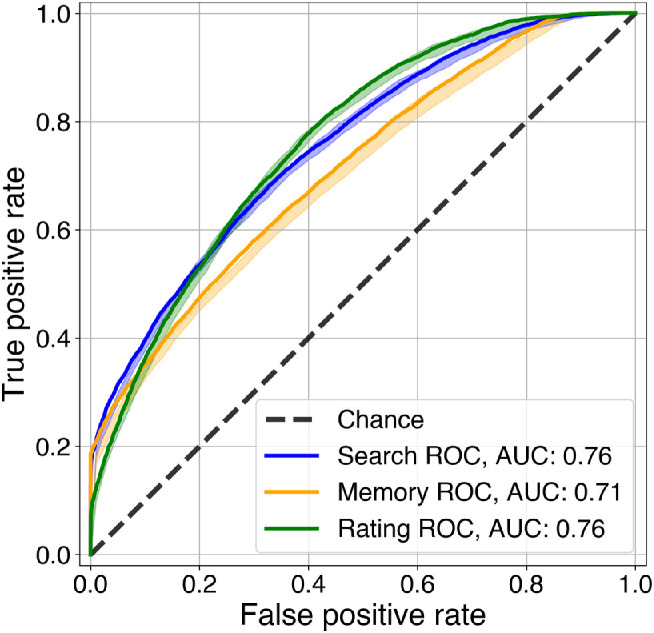
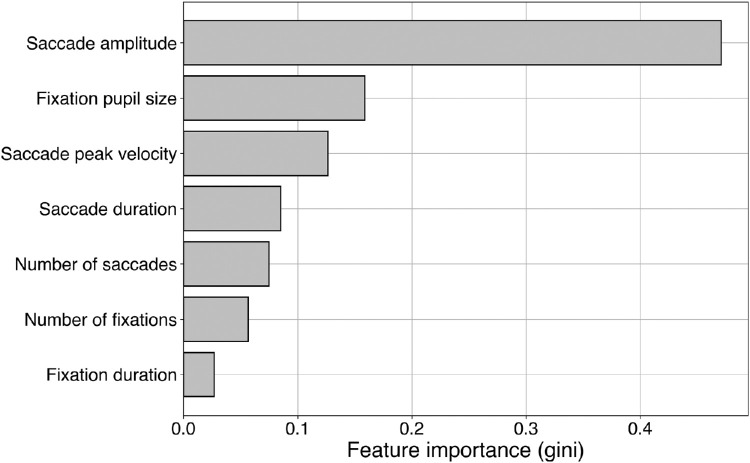
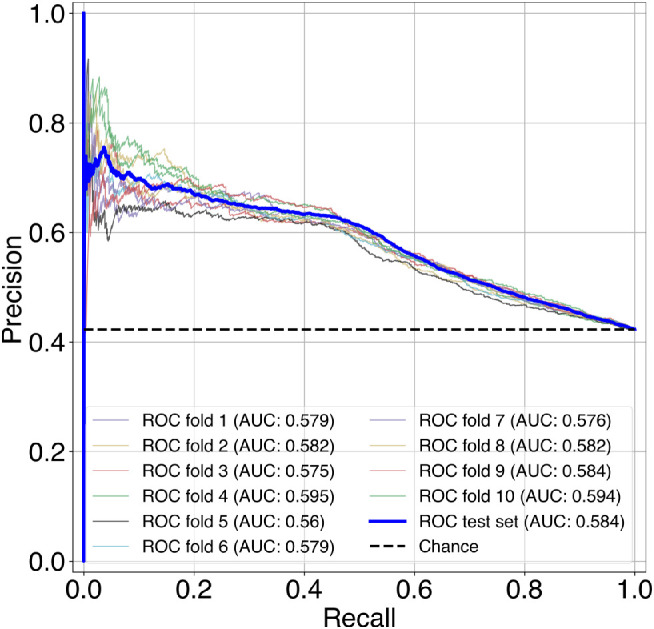
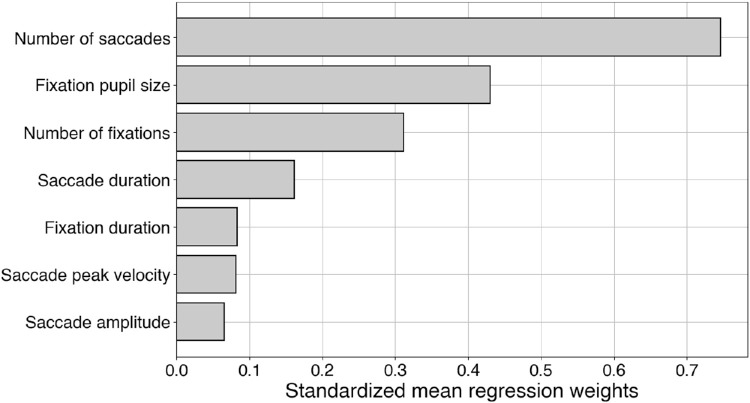
Since the seminal work of Yarbus, multiple studies have demonstrated the influence of task-set on oculomotor behavior and the current cognitive state. In more recent years, this field of research has expanded by evaluating the costs of abruptly switching between such different tasks. At the same time, the field of classifying oculomotor behavior has been moving toward more advanced, data-driven methods of decoding data. For the current study, we used a large dataset compiled over multiple experiments and implemented separate state-of-the-art machine learning methods for decoding both cognitive state and task-switching. We found that, by extracting a wide range of oculomotor features, we were able to implement robust classifier models for decoding both cognitive state and task-switching. Our decoding performance highlights the feasibility of this approach, even invariant of image statistics. Additionally, we present a feature ranking for both models, indicating the relative magnitude of different oculomotor features for both classifiers. These rankings indicate a separate set of important predictors for decoding each task, respectively. Finally, we discuss the implications of the current approach related to interpreting the decoding results.


Figures

Figure 1.
Figure 1.
Visual example representation of search, rating and memory trials during test phase. For all but five trials, there was no actual target present in the search condition to provoke search behavior. Before the start of the experiment, participants were instructed to enter the pleasantness of the image on a seven-point Likert scale. The memory condition represents a mirror reversal modification. Note that although the conditions were randomly sampled from 120 indoor scenes, the current example in this image was not actually among them.
Figure 2.
Figure 2.
Distributions of the five (excluding saccade and fixation numbers) base features per cognitive trial type. Distribution shapes show some deviations per type of trial.
Figure 3.
Figure 3.
Schematic representation of data pre-processing steps.
Figure 4.
Figure 4.
Correlation matrix of base feature measurements.
Figure 5.
Figure 5.
Schematic representation of model implementation steps.
Figure 6.
Figure 6.
Schematic representation of the second step in our two-step model for determining the feature ranking for our cognitive state classifier model.
Figure 7.
Figure 7.
ROC/AUC performance evaluation under false-/true-positive rate for each cognitive state in our final model. Confidence bands represent cross-validation performance estimates. Although this was a single three-way classification model, note that for each trial type, the AUC represents the discriminative ability of the model when distinguishing that trial type from the remaining ones. A random classifier would score an AUCsc of 0.5.
Figure 8.
Figure 8.
Feature ranking for the decision tree model. These determine the relative importance of feature groups for models which strongly predicted for Search trials.
Figure 9.
Figure 9.
/AUC under precision -recall performance evaluation for task-switching in our final model. Smaller lines represent performance during cross-validation. Here, the AUC represents the discriminative ability of the model when distinguishing task-repeat from task-switch trials. Chance level is represented by the dotted black line.
Figure 10.
Figure 10.
Feature ranking for the Logistic regression model. The standardized average regression weights represent the relative magnitude of each feature group in the classifier.

References

    1. Bahle B., Mills M., & Dodd M. D. (2017). Human classifier: Observers can deduce task solely from eye movements. Attention, Perception, & Psychophysics, 79(5), 1415–1425. - PMC - PubMed
    1. Blum A. L., & Langley P. (1997). Selection of relevant features and examples in machine learning. Artificial Intelligence, 97(1–2), 245–271.
    1. Borji A., & Itti L. (2014). Defending Yarbus: Eye movements reveal observers' task. Journal of Vision, 14(3), 29–29. - PubMed
    1. Bradley M. M., Miccoli L., Escrig M. A., & Lang P. J. (2008). The pupil as a measure of emotional arousal and autonomic activation. Psychophysiology, 45(4), 602–607. - PMC - PubMed
    1. Geng J. J., Blumenfeld Z., Tyson T. L., & Minzenberg M. J. (2015). Pupil diameter reflects uncertainty in attentional selection during visual search. Frontiers in Human Neuroscience, 9, 435. - PMC - PubMed

Publication types