. 2020 Oct 27;14(10):12840-12853.
doi: 10.1021/acsnano.0c03614. Epub 2020 Sep 15.

4D Multimodal Nanomedicines Made of Nonequilibrium Au-Fe Alloy Nanoparticles

Affiliations

4D Multimodal Nanomedicines Made of Nonequilibrium Au-Fe Alloy Nanoparticles

Veronica Torresan et al. ACS Nano. .

Abstract

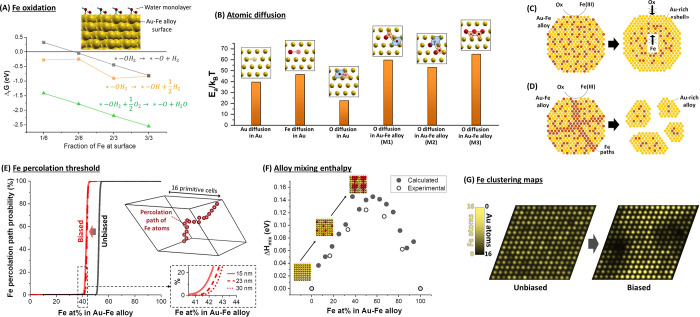
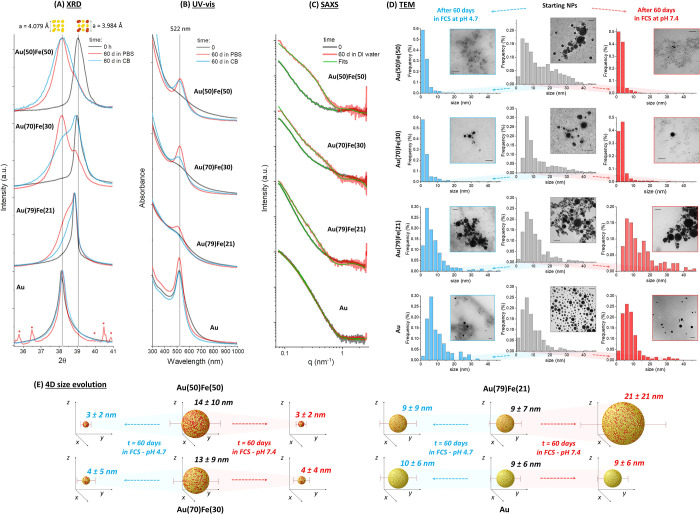
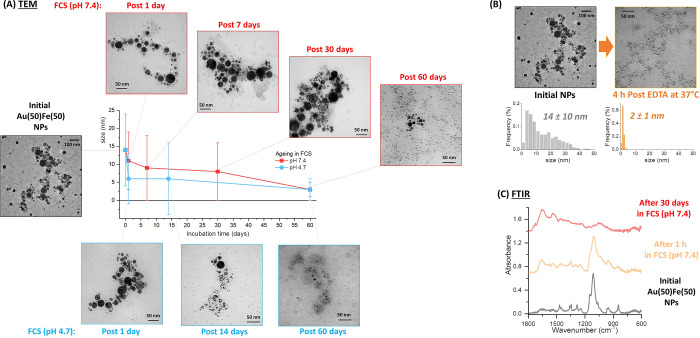
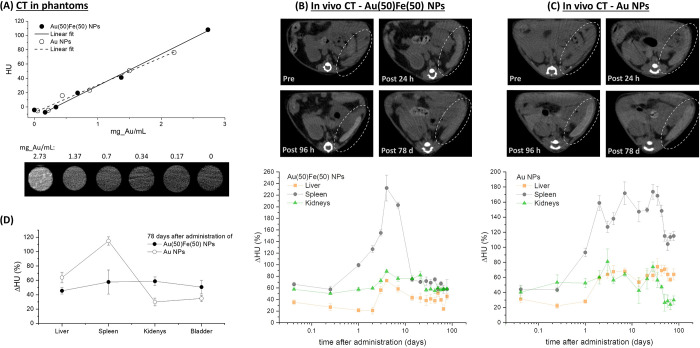
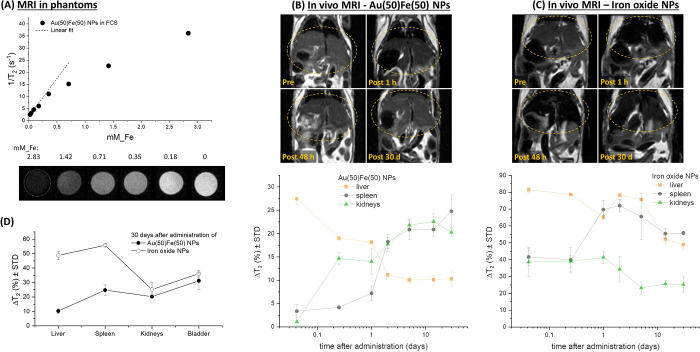
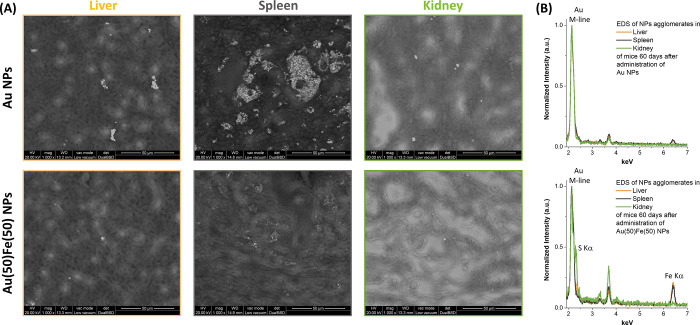
Several examples of nanosized therapeutic and imaging agents have been proposed to date, yet for most of them there is a low chance of clinical translation due to long-term in vivo retention and toxicity risks. The realization of nanoagents that can be removed from the body after use remains thus a great challenge. Here, we demonstrate that nonequilibrium gold-iron alloys behave as shape-morphing nanocrystals with the properties of self-degradable multifunctional nanomedicines. DFT calculations combined with mixing enthalpy-weighted alloying simulations predict that Au-Fe solid solutions can exhibit self-degradation in an aqueous environment if the Fe content exceeds a threshold that depends upon element topology in the nanocrystals. Exploiting a laser-assisted synthesis route, we experimentally confirm that nonequilibrium Au-Fe nanoalloys have a 4D behavior, that is, the ability to change shape, size, and structure over time, becoming ultrasmall Au-rich nanocrystals. In vivo tests show the potential of these transformable Au-Fe nanoalloys as efficient multimodal contrast agents for magnetic resonance imaging and computed X-ray absorption tomography and further demonstrate their self-degradation over time, with a significant reduction of long-term accumulation in the body, when compared to benchmark gold or iron oxide contrast agents. Hence, Au-Fe alloy nanoparticles exhibiting 4D behavior can respond to the need for safe and degradable inorganic multifunctional nanomedicines required in clinical translation.

Keywords: Au nanoparticles; CT; Fe nanoparticles; MRI; alloys; degradable materials; nanomedicine.


Conflict of interest statement

The authors declare no competing financial interest.

Figures

Figure 1
Figure 1
DFT calculations and numerical simulations. (A) Gibbs free energies of the iron oxidation reactions reported as a function of the Fe amount at the surface; * indicates an Fe surface site. (B) Energy barriers for the diffusion of Au, Fe, and O atomic species in alloy bulk, computed using the climbing-image nudged elastic band (NEB) method (see SI) and different alloy models. (C) Pictorial model of the nanoalloy evolution in water media for an alloy composition below the percolation threshold, for which the oxidation of surface Fe leads to passivation and (D) for an alloy composition above the percolation threshold, for which oxidation can proceed along percolation paths. (E) Percolation threshold as a function of the alloy composition for τ = ∞ (black line) or 0.26 eV (red line); inset represents an example of a percolation path. The threshold has been evaluated also as a function of slab size, evidencing that it is influent for only a few at. % on the result. This is appreciable from the zoom-in black dashed inset (continuous red line: 15 nm slab; red dashed lines: 23 nm slab; red dotted line: 30 nm slab). (F) Mixing enthalpy of the alloy. (G) Distribution of Fe atoms in a supercell, obtained by counting Fe atoms along a close-packed direction, in the perfectly random alloy (unbiased) and in an alloy model where segregation is allowed (biased).
Figure 2
Figure 2
4D structural and size evolution. XRD (A), UV–vis (B), SAXS (C), and TEM (D) analysis on Au and AuFe samples before and after aging for 60 days in different environments: for XRD and UV–vis in PBS or citrate buffer (CB), for SAXS in distilled water, for TEM in FCS at pH 7.4 and 4.7. In all cases, the pure Au sample shows negligible modifications, while the Au–Fe alloy sample exhibits increasing structural evolution for increasing Fe content. In (A), the XRD peaks due to residual buffer salts in the Au NPs sample incubated 60 days in PBS are denoted with red asterisks. In (D), the scale bar of TEM images is 50 nm. (E) Sketch resuming the evolution of average NP size described in (D) after 60 days, where the 4D transformable nature of the Au(50)Fe(50) and Au(30)Fe(70) samples is well evidenced. In fact, while stable NPs are defined by their 3D shape, the Au–Fe alloy NPs transform over time, requiring a fourth dimension (time) to be properly identified.
Figure 3
Figure 3
4D size evolution in different environments. (A) TEM analysis at different time points for the Au(50)Fe(50) sample in FCS at pH 7.4 and 4.7. (B) Size distribution and representative TEM image of Au(50)Fe(50) NPs before and after 4 h incubation at 37 °C with EDTA in 20% v/v FCS/water. (C) FTIR of the Au(50)Fe(50) sample before and after aging in FCS (pH 7.4) for 1 h and 30 days. The vibrations of the PEG coating dominate the spectra before and after 1 h, but disappear in the spectrum after 30 days, where only vibrations ascribable to serum proteins are found.
Figure 4
Figure 4
CT monitoring of the biodistribution. (A) Plot of HU versus Au concentration collected on phantoms containing the Au(50)Fe(50) NPs at variable dilution. CT images of phantoms’ cross-section are also reported. (B, C) Comparative biodistribution study of Au(50)Fe(50) and pure Au NPs administered on healthy mice and monitored by CT up to 78 days. Top: Images of mouse spleen showing the evolution of contrast over time, where it is appreciable that Au(50)Fe(50) NPs massively leave the spleen after 78 days, while Au NPs persisted to a large extent. Bottom: Plot of the relative increment of CT contrast over time, measured as ΔHU (%), in the liver, spleen, and kidneys. The biodistribution curve of Au(50)Fe(50) NPs exhibits a peak, while the curve of Au NPs shows a step, except for kidneys, which are not affected by Au distribution after 60 days. (D) Plot of ΔHU for liver, spleen, kidneys, and bladder at 78 days after administration, suggesting the flow of Au(50)Fe(50) NPs through the renal clearance pathway, in contrast to the persistence of Au NPs in the liver and spleen.
Figure 5
Figure 5
MRI monitoring of biodistribution. (A) Plot of relaxivity versus Fe concentration collected on phantoms containing the Au(50)Fe(50) sample at variable dilution. MRI images of phantoms’ cross-section are also reported. (B, C) Comparative biodistribution study of Au(50)Fe(50) and commercial iron oxide NPs (Endorem) administered on healthy mice and monitored by MRI up to 30 days. Top: Images of mouse liver showing the evolution of contrast over time, where it is appreciable that Au(50)Fe(50) NPs massively leave that organ after 30 days, while iron oxide NPs accumulate to a large extent. Bottom: Plot of the MRI contrast of over time, measured as the relative T2 signal intensity decrease (ΔT2, expressed in absolute % variation), in the liver, spleen, and kidneys. The biodistribution curves of Au(50)Fe(50) NPs exhibit a consistent decrease of ΔT2 in the liver and a sharp increase in the spleen and kidneys, while the curves of iron oxide NPs shows a slight decrease in the liver and kidneys and a sharp positive step in the spleen. (D) Plot of ΔT2 for liver, spleen, kidneys, and bladder at 30 days after administration, again suggesting the flow of Au(50)Fe(50) NPs through the renal clearance pathway, in contrast to the persistence of iron oxide NPs in the liver and spleen.
Figure 6
Figure 6
ESEM analysis of histopathological sections after 60 days. (A) Top: Mice treated with Au NPs. Large agglomerates of NPs are found in the spleen, and several clusters of NPs are found also in the liver and kidneys. Bottom: Mice treated with Au(50)Fe(50) NPs. Compared to the mouse treated with pure Au NPs, in this case there is a much lower density of NPs in all three organs. (B) EDS spectra collected on a group of NPs in each of the histopathological sections. The Au M-line peak is observed in all spectra, while the Fe Kα-line is found only in the liver and spleen of the mouse treated with the Au(50)Fe(50) NPs. In the kidney of the same animal, no Fe peak is detected, but the S Kα-line appears, suggesting that Au-rich nanoparticles coated with thiolated molecules reached this organ. Peaks in the 3–4 keV range belong to Ca and K.

Similar articles

Cited by

References

    1. Bogart L. K.; Pourroy G.; Murphy C. J.; Puntes V.; Pellegrino T.; Rosenblum D.; Peer D.; Lévy R. Nanoparticles for Imaging, Sensing, and Therapeutic Intervention. ACS Nano 2014, 8, 3107–3122. 10.1021/nn500962q. - DOI - PMC - PubMed
    1. Ehlerding E. B.; Chen F.; Cai W. Biodegradable and Renal Clearable Inorganic Nanoparticles. Adv. Sci. 2016, 3, 1500223.10.1002/advs.201500223. - DOI - PMC - PubMed
    1. Yang G.; Phua S. Z. F.; Bindra A. K.; Zhao Y. Degradability and Clearance of Inorganic Nanoparticles for Biomedical Applications. Adv. Mater. 2019, 31, 1805730.10.1002/adma.201805730. - DOI - PubMed
    1. Yu L.; Chen Y.; Wu M.; Cai X.; Yao H.; Zhang L.; Chen H.; Shi J. Manganese Extraction” Strategy Enables Tumor-Sensitive Biodegradability and Theranostics of Nanoparticles. J. Am. Chem. Soc. 2016, 138, 9881–9894. 10.1021/jacs.6b04299. - DOI - PubMed
    1. Soo Choi H.; Liu W.; Misra P.; Tanaka E.; Zimmer J. P.; Itty Ipe B.; Bawendi M. G.; Frangioni J. V. Renal Clearance of Quantum Dots. Nat. Biotechnol. 2007, 25, 1165–1170. 10.1038/nbt1340. - DOI - PMC - PubMed

Publication types