

High-fat diet induces fibrosis in mice lacking CYP2A5 and PPARα: a new model for steatohepatitis-associated fibrosis
- PMID: 32877213
- PMCID: PMC8087345
- DOI: 10.1152/ajpgi.00213.2020
High-fat diet induces fibrosis in mice lacking CYP2A5 and PPARα: a new model for steatohepatitis-associated fibrosis
Abstract
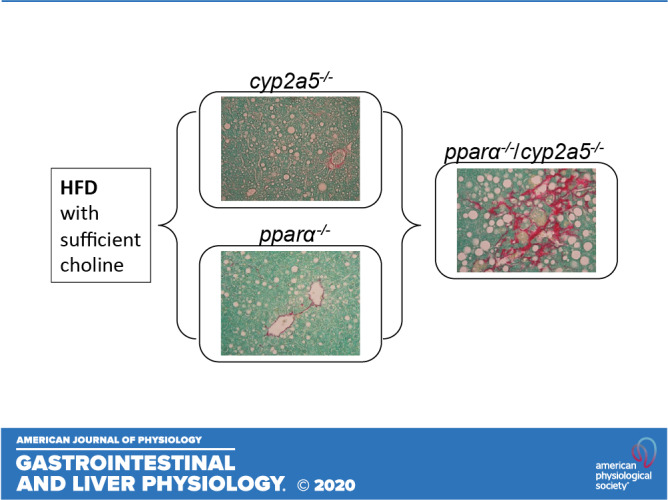
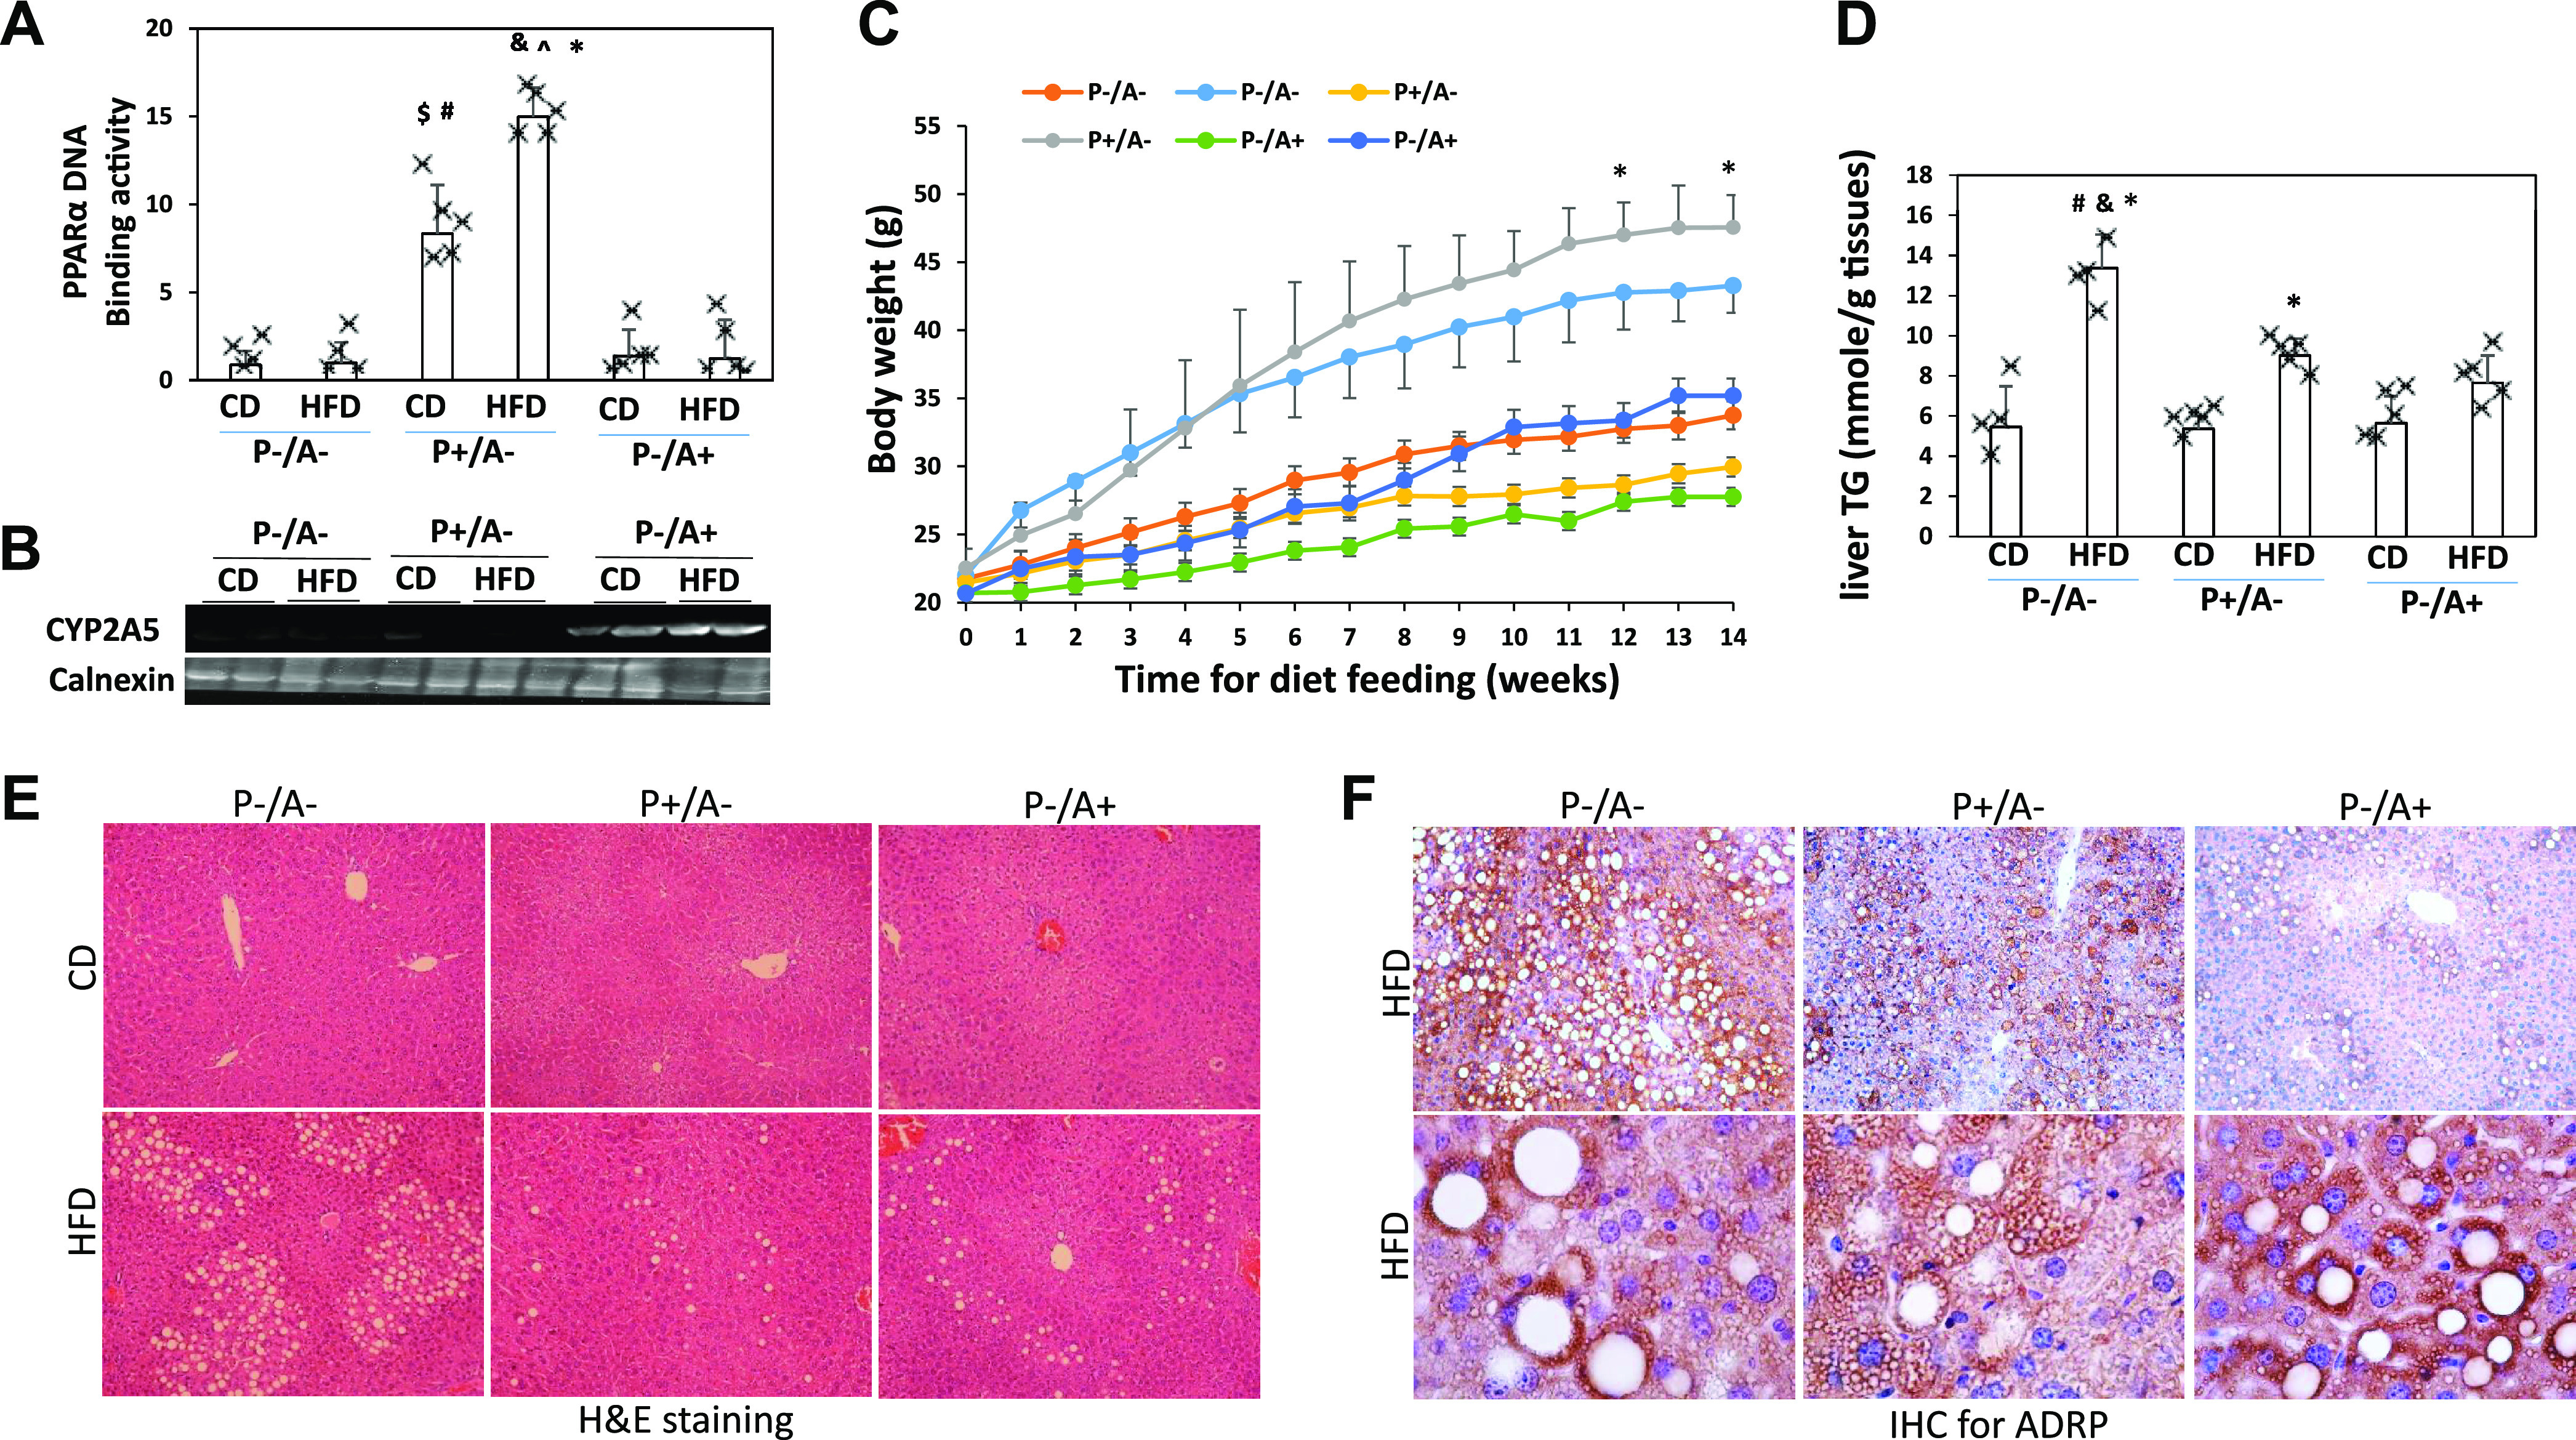
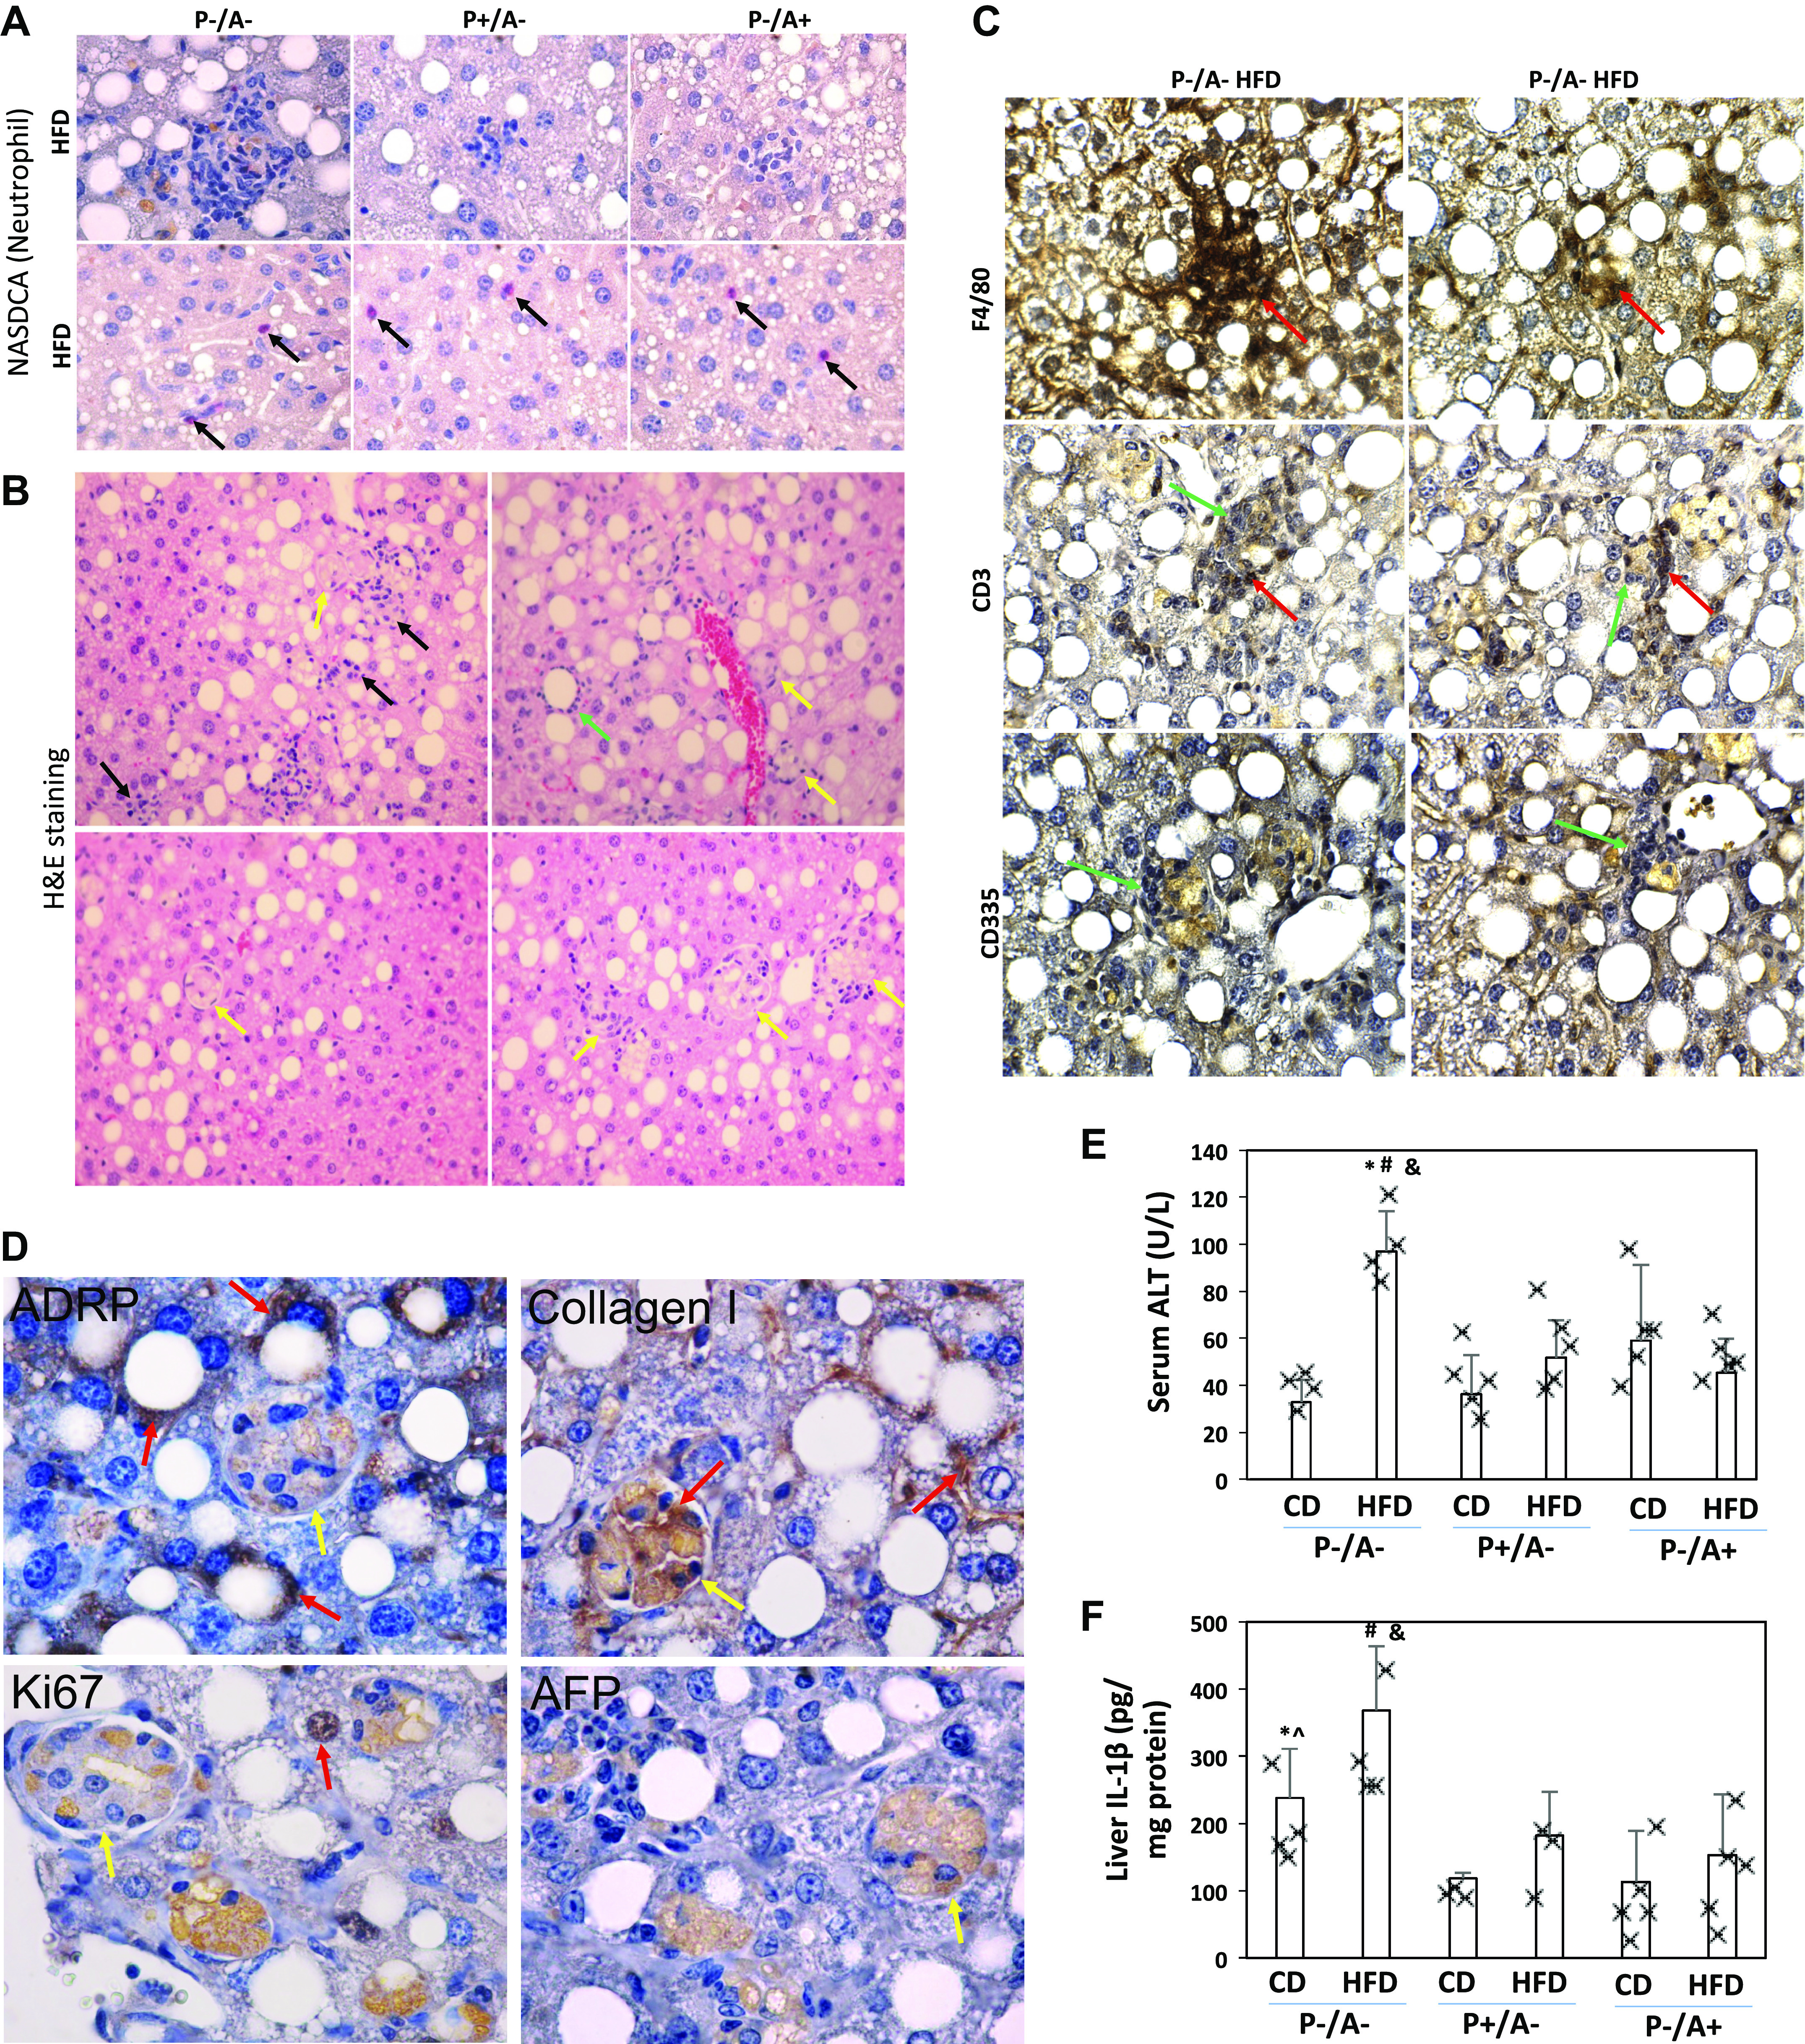
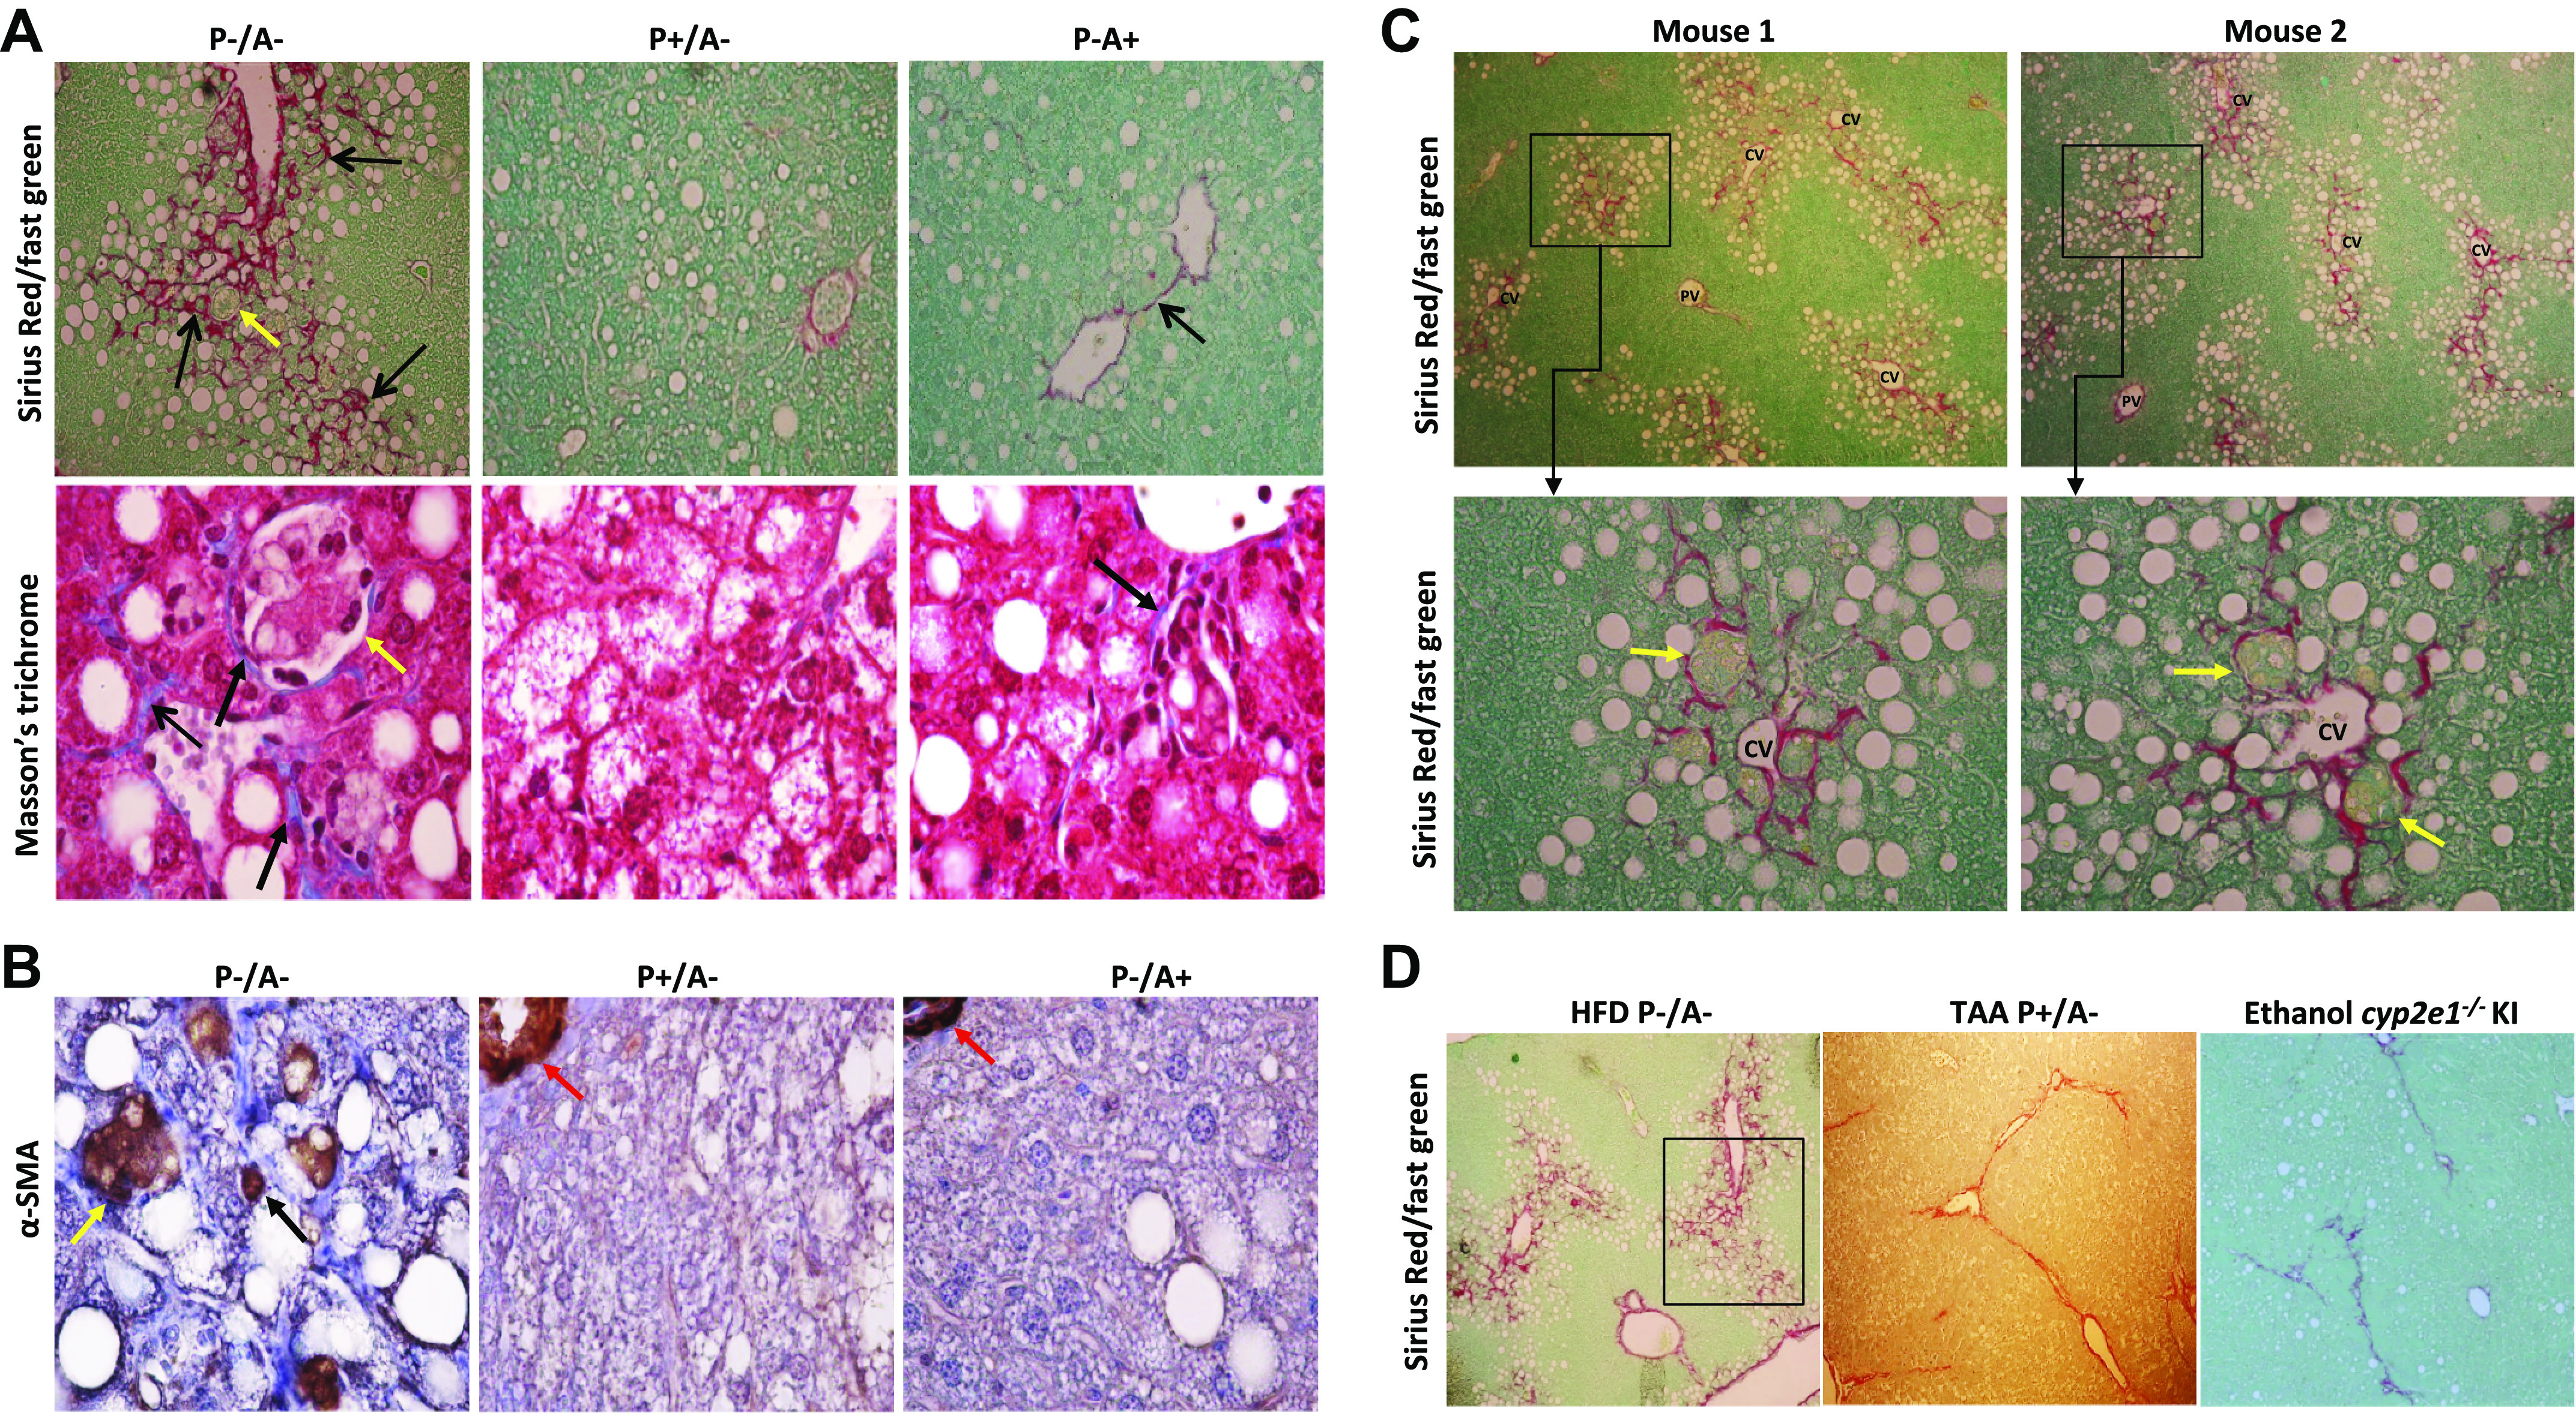
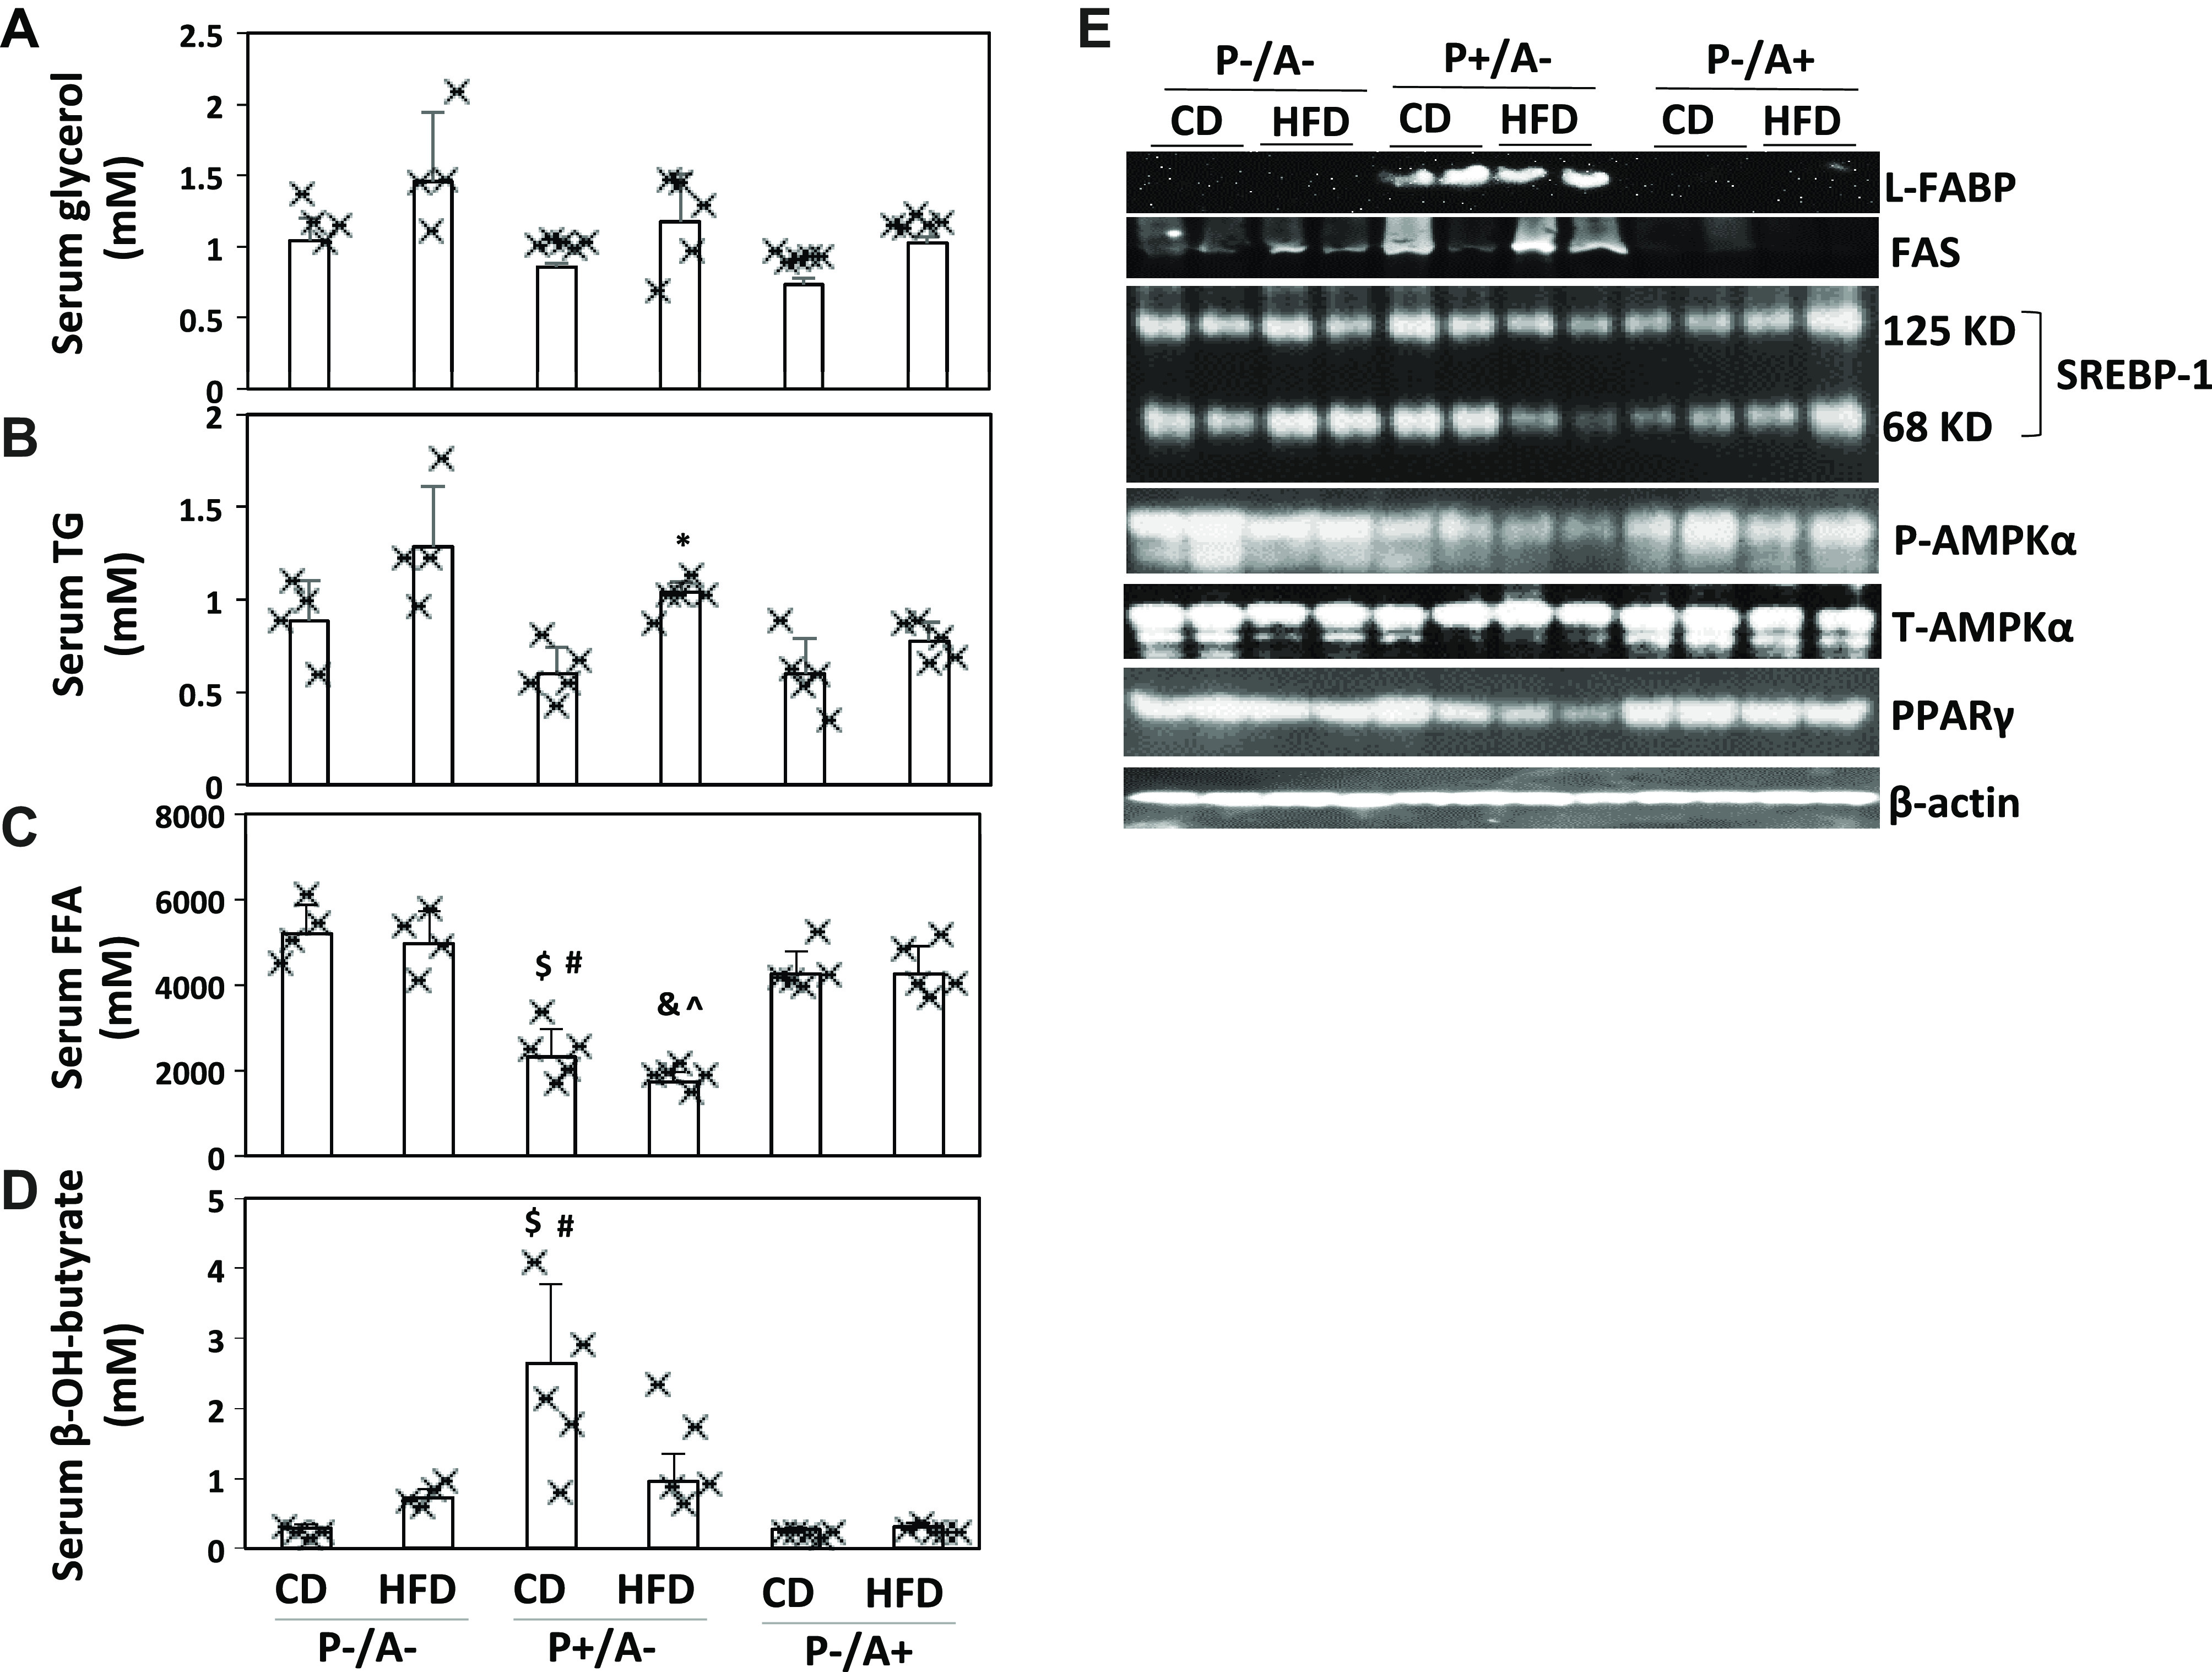
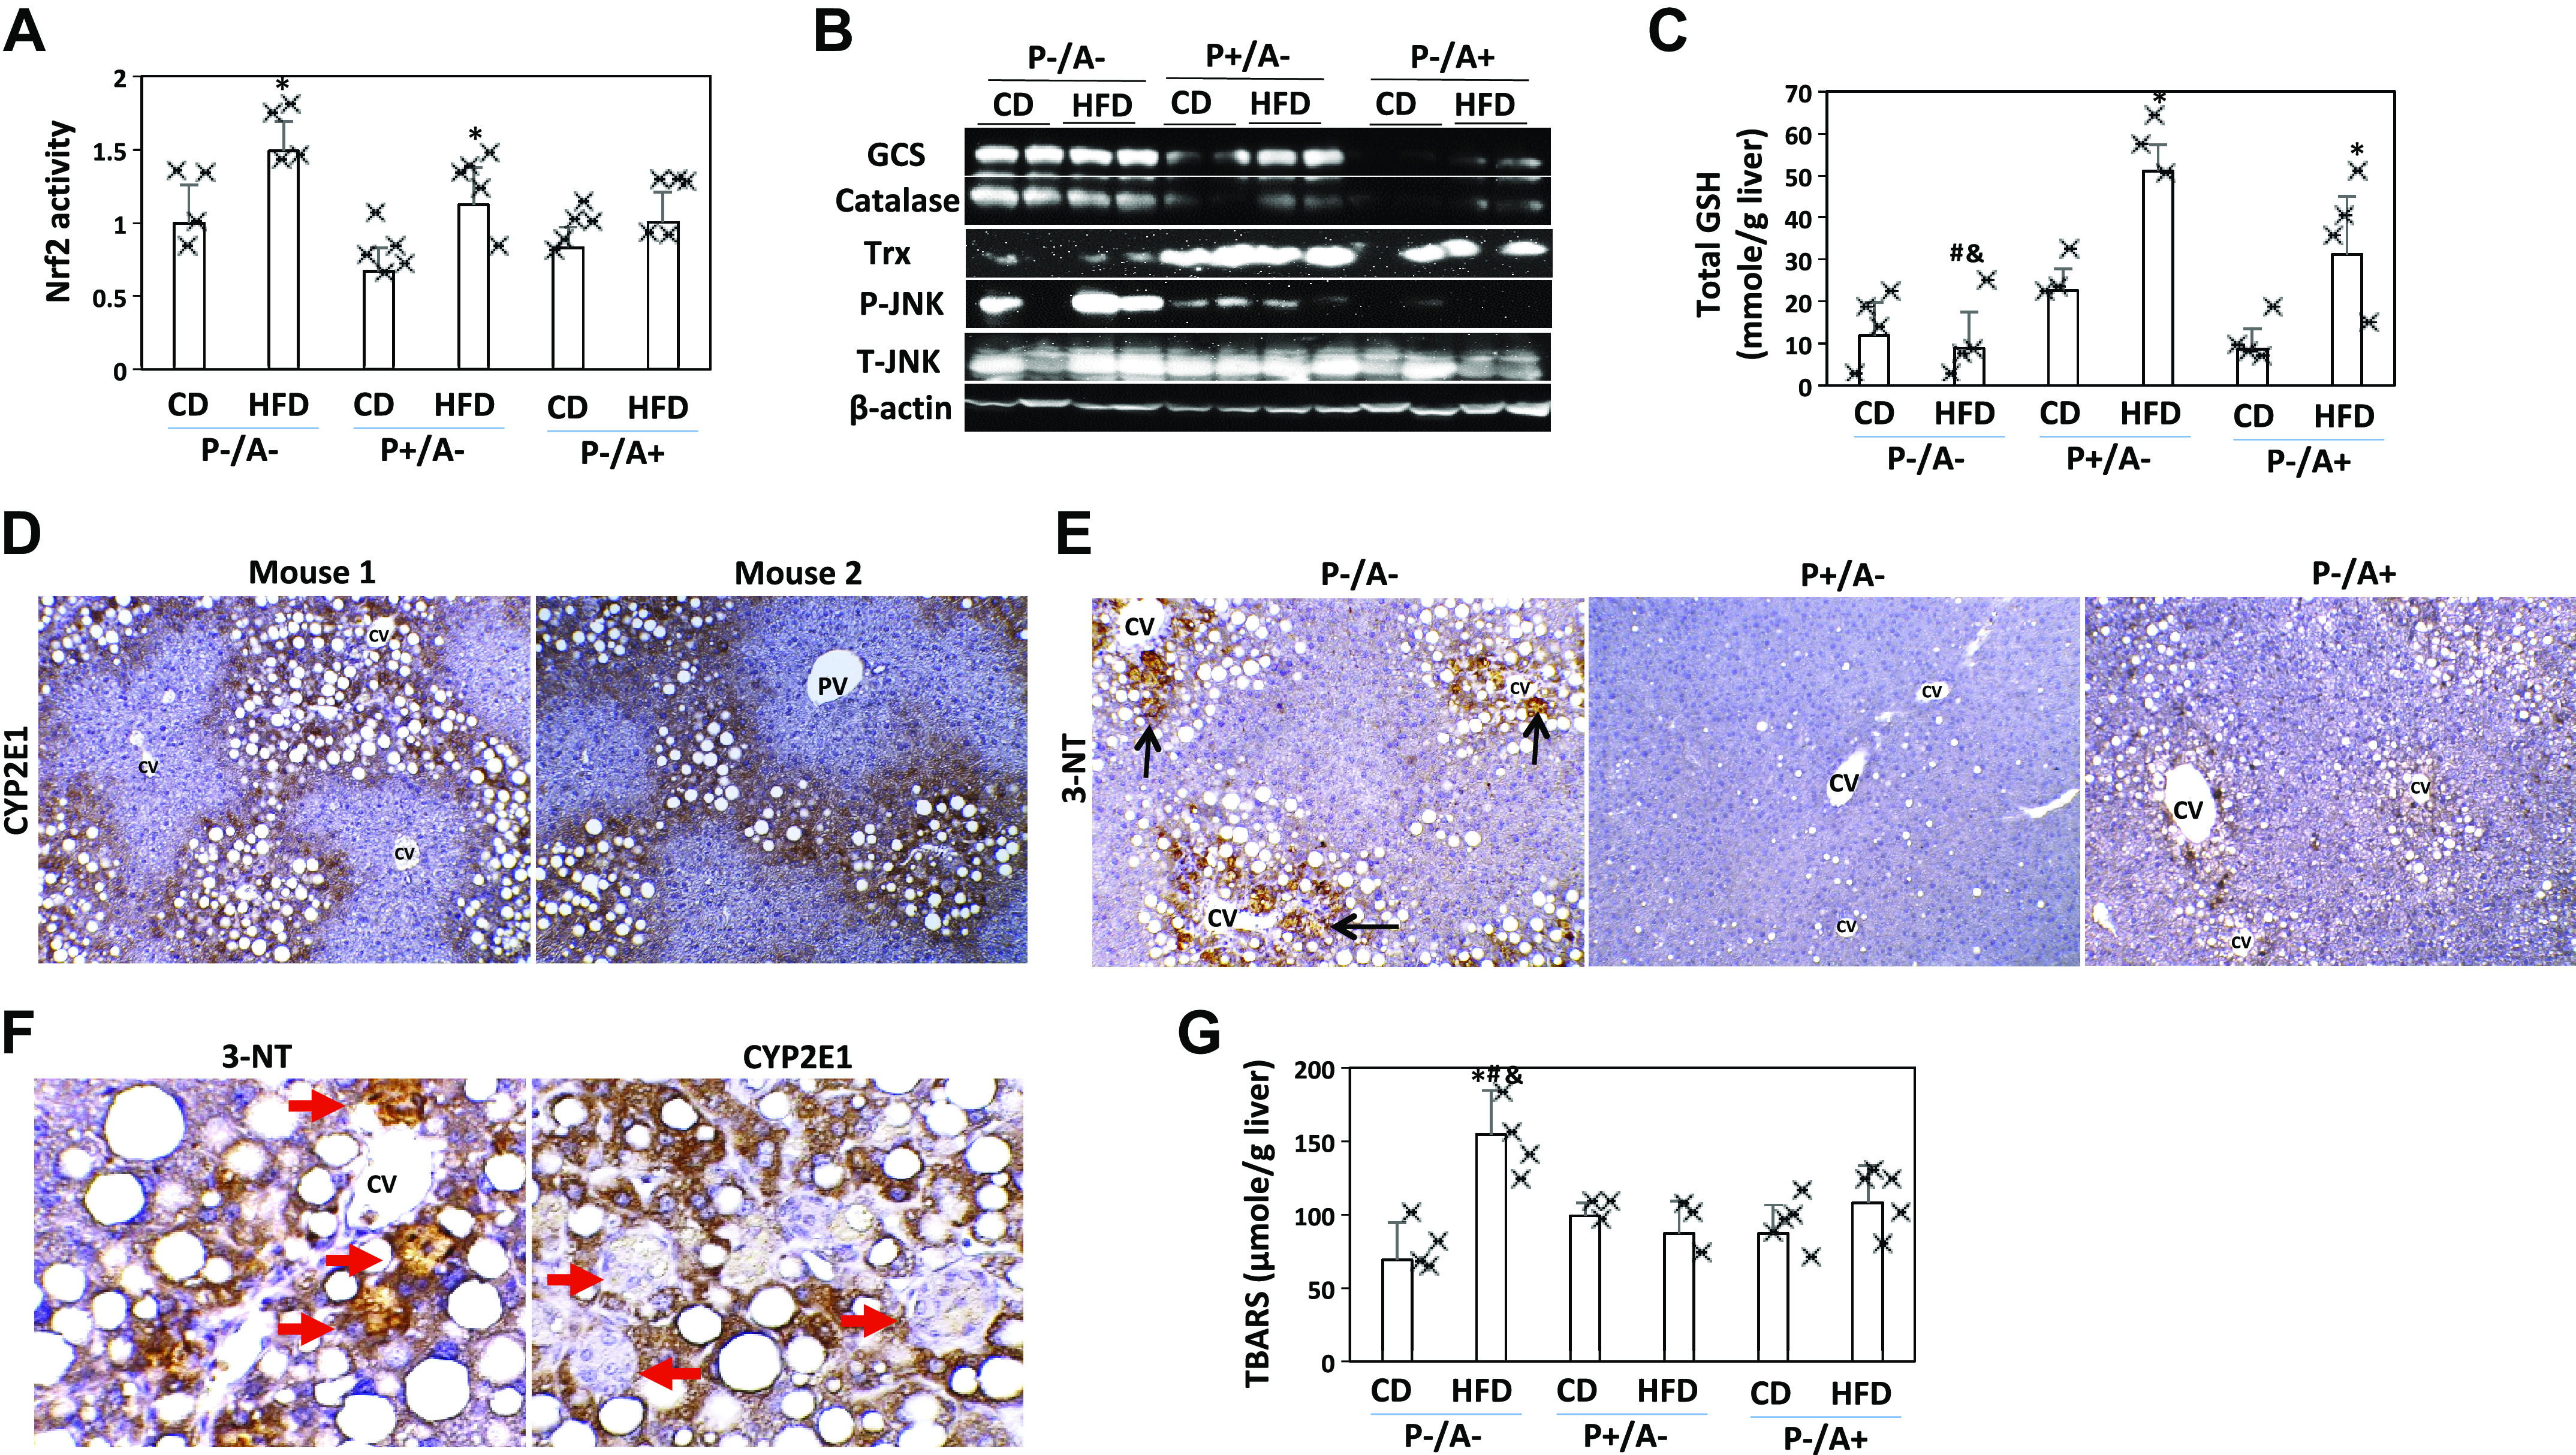
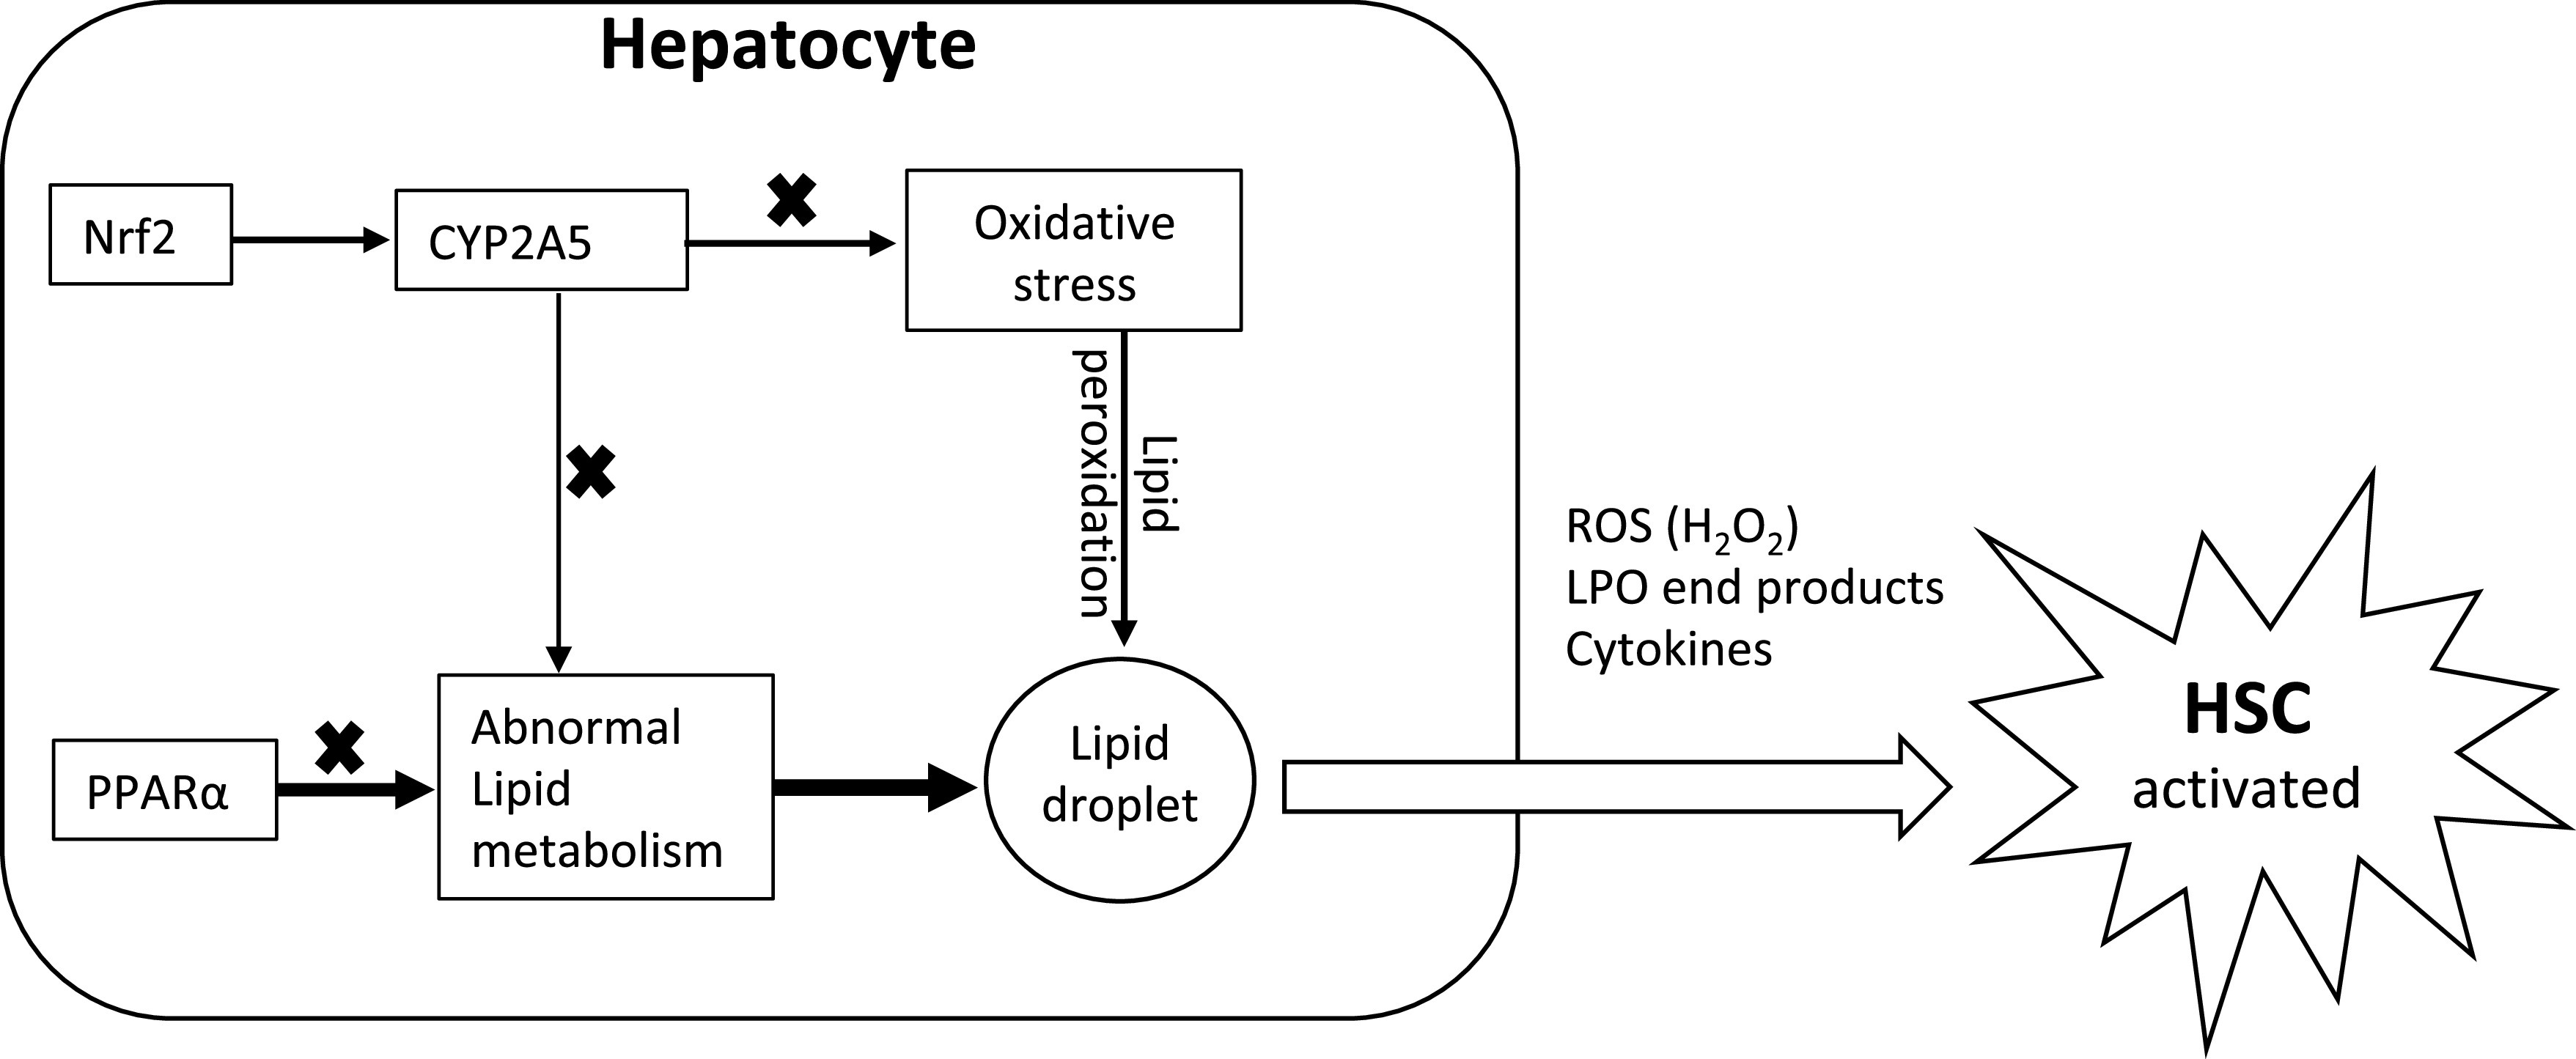
Obesity is linked to nonalcoholic steatohepatitis. Peroxisome proliferator-activated receptor-α (PPARα) regulates lipid metabolism. Cytochrome P-450 2A5 (CYP2A5) is a potential antioxidant and CYP2A5 induction by ethanol is CYP2E1 dependent. High-fat diet (HFD)-induced obesity and steatosis are more severe in CYP2A5 knockout (cyp2a5-/-) mice than in wild-type mice although PPARα is elevated in cyp2a5-/- mice. To examine why the upregulated PPARα failed to prevent the enhanced steatosis in cyp2a5-/- mice, we abrogate the upregulated PPARα in cyp2a5-/- mice by cross-breeding cyp2a5-/- mice with PPARα knockout (pparα-/-) mice to create pparα-/-/cyp2a5-/- mice. The pparα-/-/cyp2a5-/- mice, pparα-/- mice, and cyp2a5-/- mice were fed HFD to induce steatosis. After HFD feeding, more severe steatosis was developed in pparα-/-/cyp2a5-/- mice than in pparα-/- mice and cyp2a5-/- mice. The pparα-/-/cyp2a5-/- mice and pparα-/- mice exhibited comparable and impaired lipid metabolism. Elevated serum alanine transaminase and liver interleukin-1β, liver inflammatory cell infiltration, and foci of hepatocellular ballooning were observed in pparα-/-/cyp2a5-/- mice but not in pparα-/- mice and cyp2a5-/- mice. In pparα-/-/cyp2a5-/- mice, although redox-sensitive transcription factor nuclear factor erythroid 2-related factor 2 and its target antioxidant genes were upregulated as a compensation, thioredoxin was suppressed, and phosphorylation of JNK and formation of nitrotyrosine adduct were increased. Liver glutathione was decreased, and lipid peroxidation was increased. Interestingly, inflammation and fibrosis were all observed within the clusters of lipid droplets, and these lipid droplet clusters were all located inside the area with CYP2E1-positive staining. These results suggest that HFD-induced fibrosis in pparα-/-/cyp2a5-/- mice is associated with steatosis, and CYP2A5 interacts with PPARα to participate in regulating steatohepatitis-associated fibrosis.
Keywords: 3-NT; CYP2E1; IL-1β; choline; lipid peroxidation.
Figures
Similar articles
-
Alcoholic fatty liver is enhanced in CYP2A5 knockout mice: The role of the PPARα-FGF21 axis.Toxicology. 2017 Mar 15;379:12-21. doi: 10.1016/j.tox.2017.01.016. Epub 2017 Jan 25. Toxicology. 2017. PMID: 28131861 Free PMC article.
-
Experimental nonalcoholic fatty liver disease in mice leads to cytochrome p450 2a5 upregulation through nuclear factor erythroid 2-like 2 translocation.Redox Biol. 2013 Aug 24;1(1):433-40. doi: 10.1016/j.redox.2013.08.003. eCollection 2013. Redox Biol. 2013. PMID: 24191237 Free PMC article.
-
The role of CYP2A5 in liver injury and fibrosis: chemical-specific difference.Naunyn Schmiedebergs Arch Pharmacol. 2016 Jan;389(1):33-43. doi: 10.1007/s00210-015-1172-8. Epub 2015 Sep 12. Naunyn Schmiedebergs Arch Pharmacol. 2016. PMID: 26363552 Free PMC article.
-
Molecular mechanism of PPARα action and its impact on lipid metabolism, inflammation and fibrosis in non-alcoholic fatty liver disease.J Hepatol. 2015 Mar;62(3):720-33. doi: 10.1016/j.jhep.2014.10.039. Epub 2014 Nov 1. J Hepatol. 2015. PMID: 25450203 Review.
-
Alcoholic Liver Disease: from CYP2E1 to CYP2A5.Curr Mol Pharmacol. 2017;10(3):172-178. doi: 10.2174/1874467208666150817111846. Curr Mol Pharmacol. 2017. PMID: 26278389 Free PMC article. Review.
Cited by
-
Noninvasive biomarkers implicated in urea and TCA cycles for metabolic liver disease.Biomark Res. 2024 Nov 22;12(1):145. doi: 10.1186/s40364-024-00694-7. Biomark Res. 2024. PMID: 39578903 Free PMC article.
-
The Structure Basis of Phytochemicals as Metabolic Signals for Combating Obesity.Front Nutr. 2022 Jun 13;9:913883. doi: 10.3389/fnut.2022.913883. eCollection 2022. Front Nutr. 2022. PMID: 35769384 Free PMC article. Review.
-
Stress kinases in the development of liver steatosis and hepatocellular carcinoma.Mol Metab. 2021 Aug;50:101190. doi: 10.1016/j.molmet.2021.101190. Epub 2021 Feb 13. Mol Metab. 2021. PMID: 33588102 Free PMC article. Review.
-
Hepatocellular loss of mTOR aggravates tumor burden in nonalcoholic steatohepatitis-related HCC.Neoplasia. 2023 Dec;46:100945. doi: 10.1016/j.neo.2023.100945. Epub 2023 Nov 15. Neoplasia. 2023. PMID: 37976569 Free PMC article.
-
Suppression of NNK Metabolism by Anthocyanin-Rich Haskap Berry Supplementation Through Modulation of P450 Enzymes.Pharmaceuticals (Basel). 2024 Nov 30;17(12):1615. doi: 10.3390/ph17121615. Pharmaceuticals (Basel). 2024. PMID: 39770457 Free PMC article.
References
-
- Chen A, Tang Y, Davis V, Hsu FF, Kennedy SM, Song H, Turk J, Brunt EM, Newberry EP, Davidson NO. Liver fatty acid binding protein (L-Fabp) modulates murine stellate cell activation and diet-induced nonalcoholic fatty liver disease. Hepatology 57: 2202–2212, 2013. doi:10.1002/hep.26318. - DOI - PMC - PubMed
Publication types
MeSH terms
Substances
Grants and funding
LinkOut - more resources
Full Text Sources
Medical
Molecular Biology Databases
Research Materials