. 2020 Oct 28;108(2):349-366.e6.
doi: 10.1016/j.neuron.2020.07.039. Epub 2020 Sep 1.

Neuropeptides Modulate Local Astrocytes to Regulate Adult Hippocampal Neural Stem Cells

Affiliations

Neuropeptides Modulate Local Astrocytes to Regulate Adult Hippocampal Neural Stem Cells

Brent Asrican et al. Neuron. .

Abstract

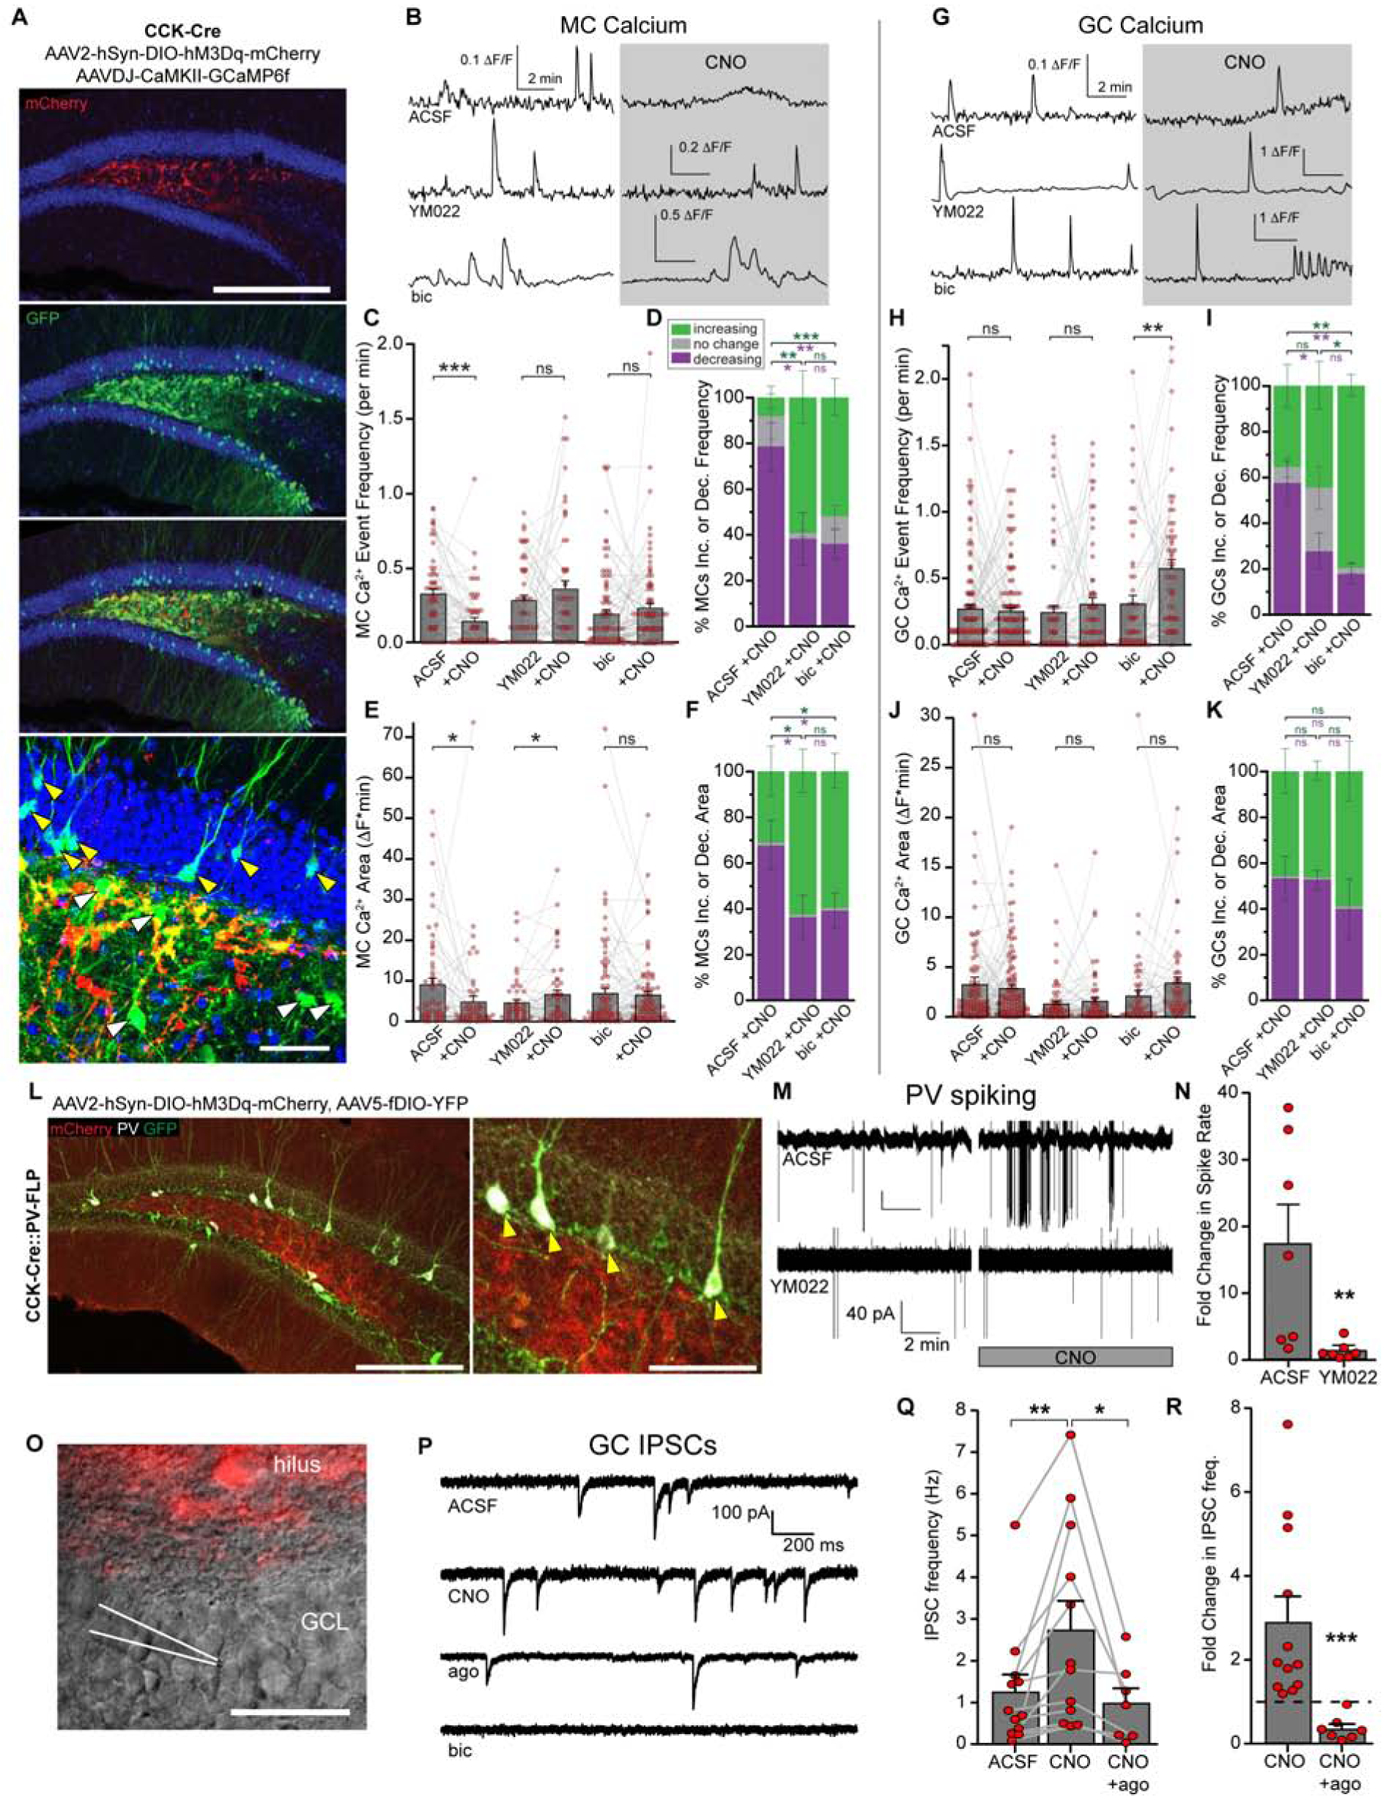
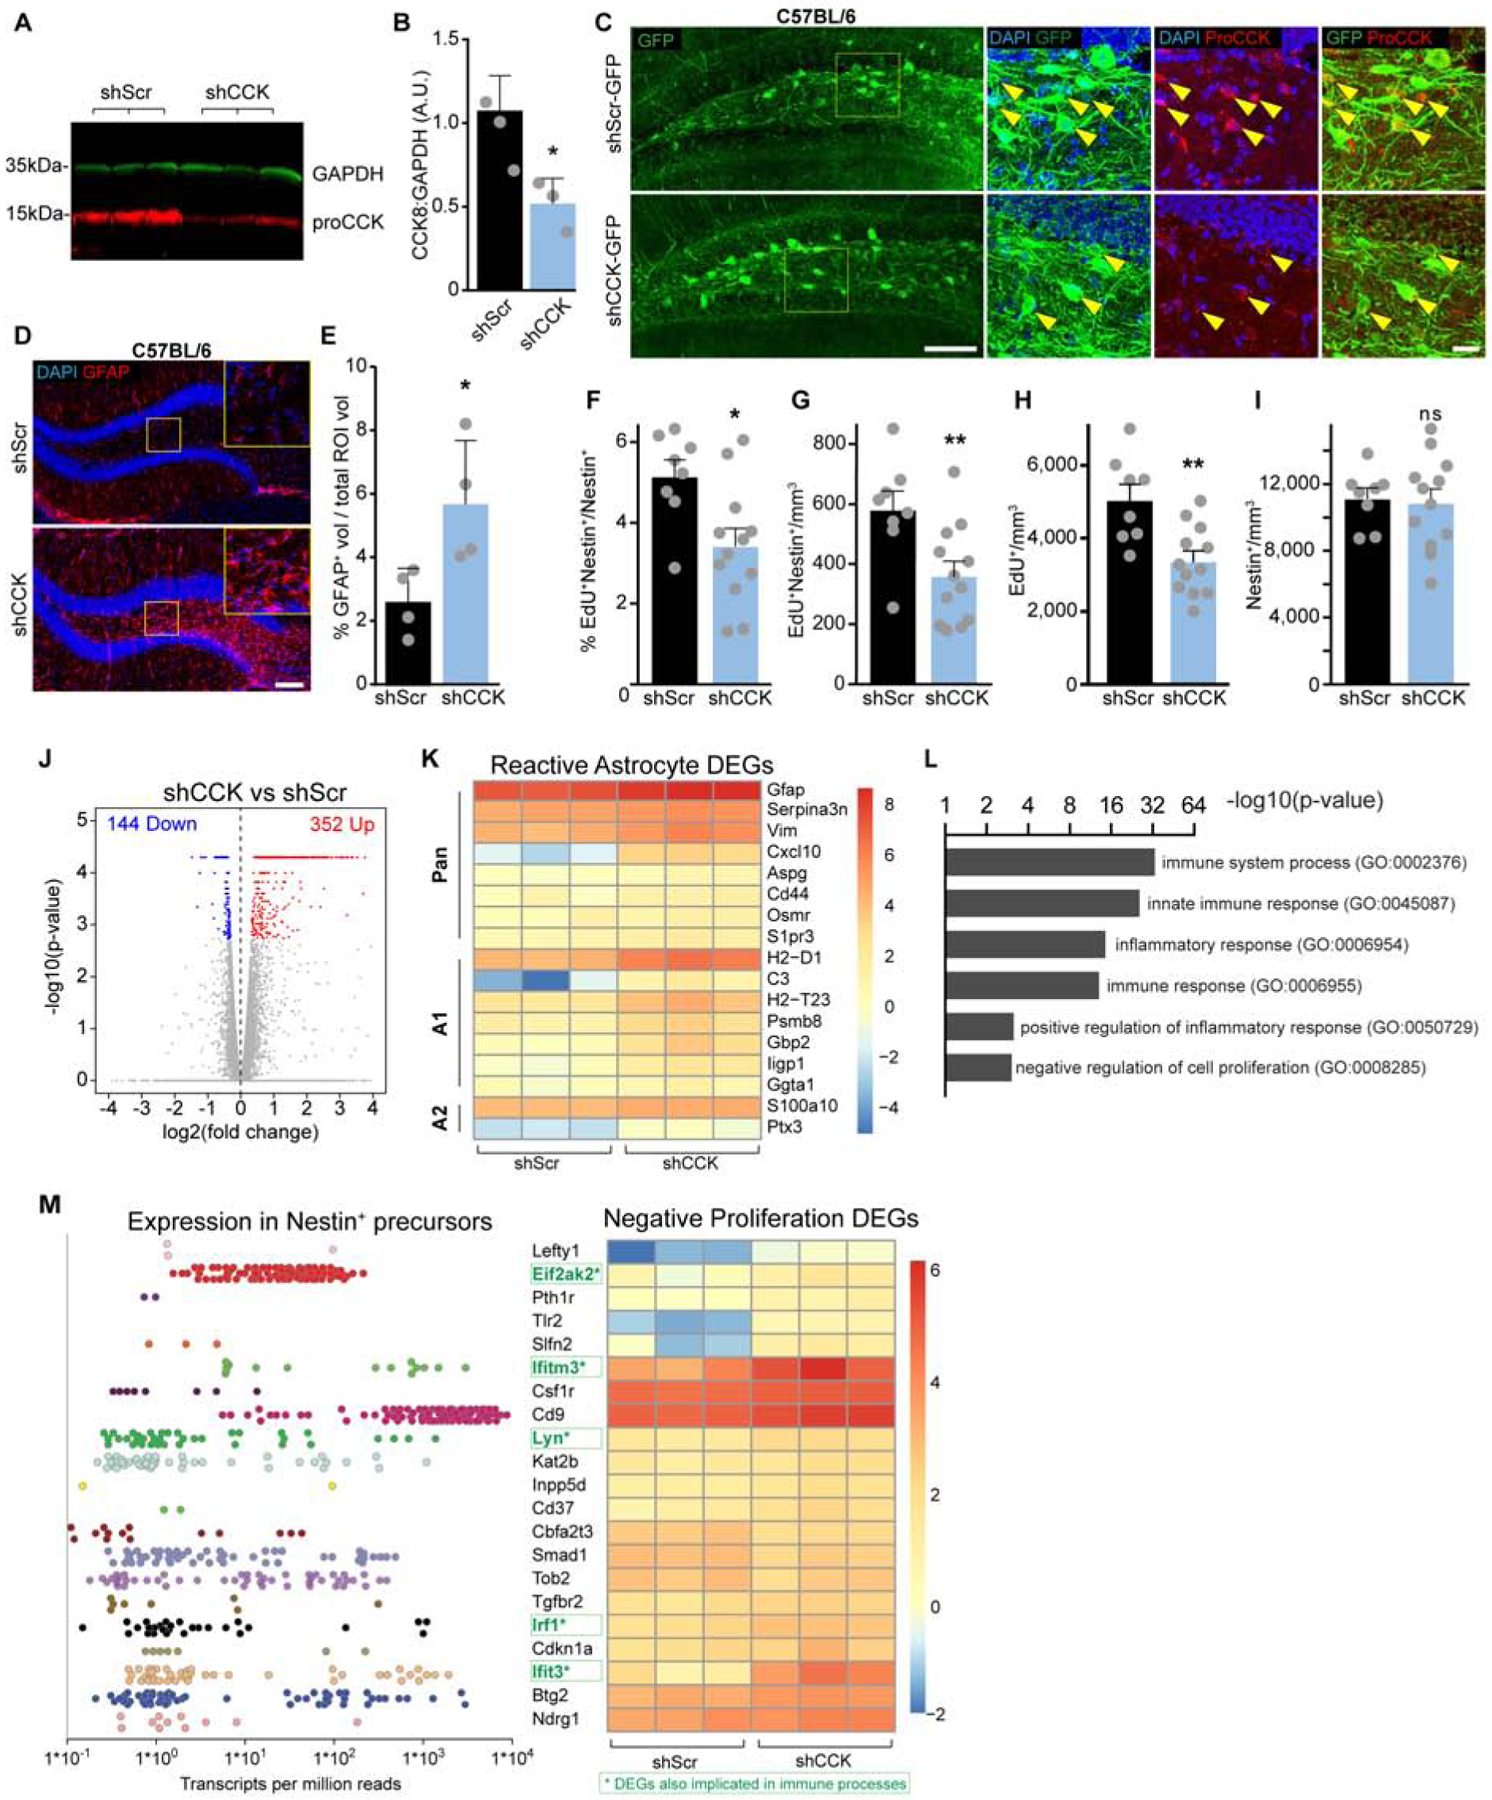
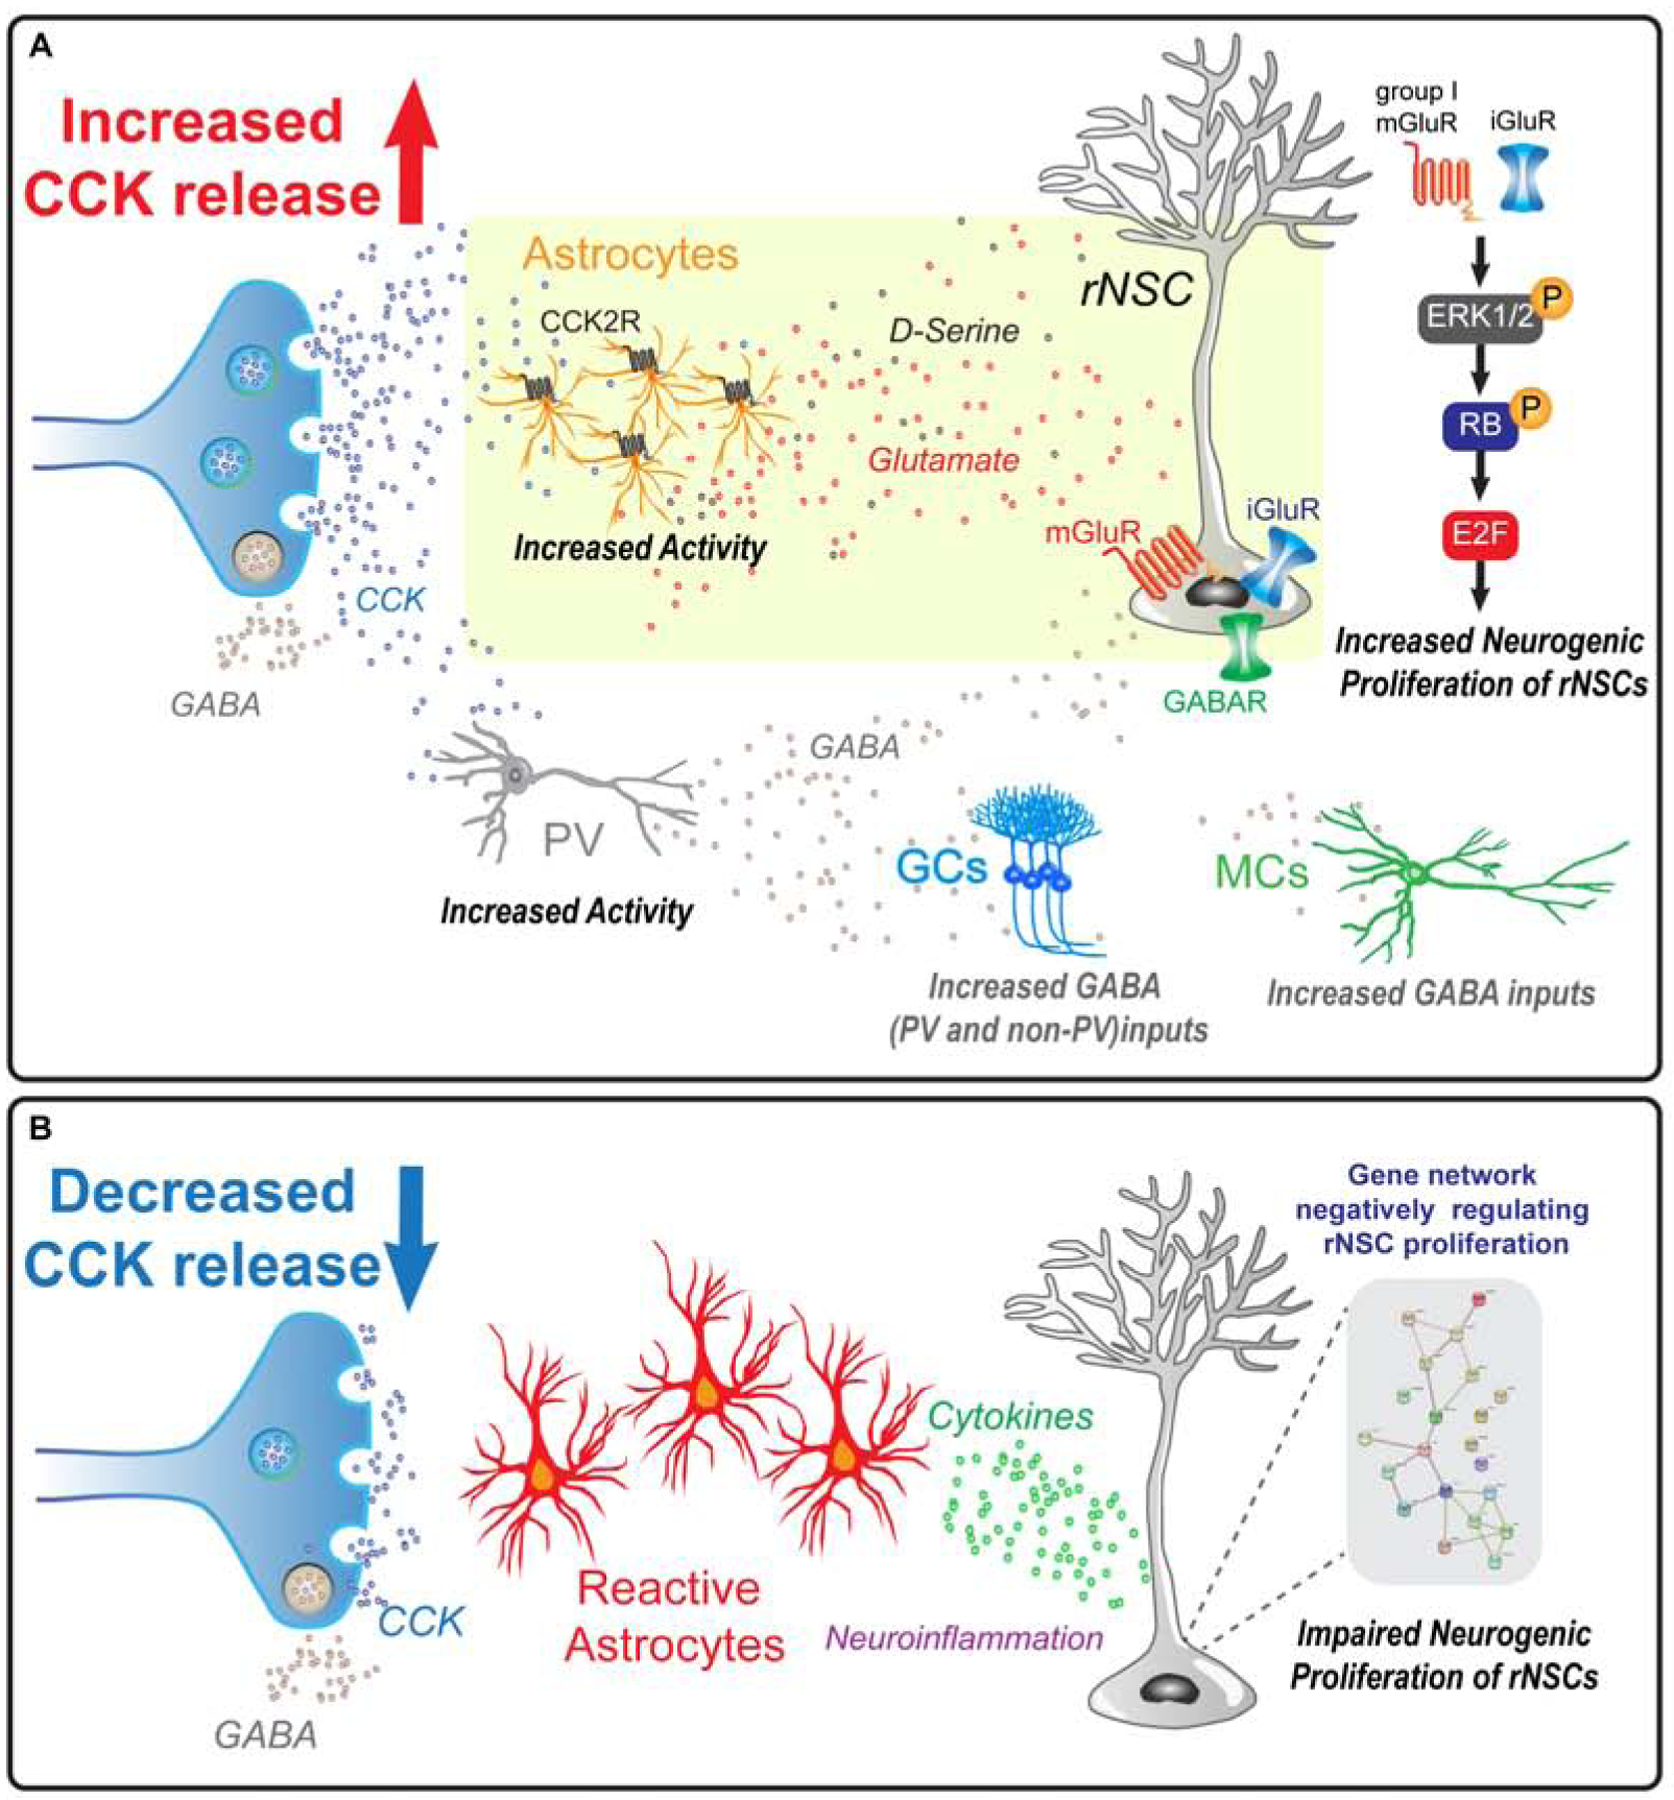
Neural stem cells (NSCs) in the dentate gyrus (DG) reside in a specialized local niche that supports their neurogenic proliferation to produce adult-born neurons throughout life. How local niche cells interact at the circuit level to ensure continuous neurogenesis from NSCs remains unknown. Here we report the role of endogenous neuropeptide cholecystokinin (CCK), released from dentate CCK interneurons, in regulating neurogenic niche cells and NSCs. Specifically, stimulating CCK release supports neurogenic proliferation of NSCs through a dominant astrocyte-mediated glutamatergic signaling cascade. In contrast, reducing dentate CCK induces reactive astrocytes, which correlates with decreased neurogenic proliferation of NSCs and upregulation of genes involved in immune processes. Our findings provide novel circuit-based information on how CCK acts on local astrocytes to regulate the key behavior of adult NSCs.

Keywords: adult neural stem cells; astrocytes; cholecystokinin; hippocampus; neurogenesis; neuroinflammation; neuropeptide.


Conflict of interest statement

Declaration of Interests The authors declare no competing interests.

Figures

Figure 1.
Figure 1.. Local CCK interneurons depolarize rNSCs through CCK2R-mediated signaling.
(A) AAV2, AAV5, or AAV8 expression of DIO-hM3Dq-mCherry in CCK-Cre mice using equivalent titers. Scale bar 200 μm. (B) Colocalization of mCherry with ProCCK in hilar CCK interneurons after AAV2 injection in CCK-Cre mice. Scale bars 100 μm, 50 μm. (C) Specificity (left) and efficiency (right) of DREADD expression in hilar CCK interneurons. Bars indicate mean ± SD for 4 animals. (D) Colocalization of GABA in hM3D+ CCK interneurons. Arrows highlight colocalized cells. Scale bar 25 μm. (E) Quantification of GABA colocalization. Bar indicates mean ± SD for 3 animals. (F-G) Whole-cell recordings in acute slice of an initially silent (F) or initially active (G) hM3Dq+ CCK interneuron upon application of 10 μM CNO. Arrows indicate start of drug application. (H) Quantification of fold increase in spiking at peak chemogenetic activation. Bars indicate means ± SEM for 4 animals. (I) hM3Dq-mCherry expression in hilar CCK interneurons near GFP+ rNSCs. Scale bar 100 μm. (J-K) Sample whole-cell recordings of GFP+ rNSCs showing (J) large depolarization due to chemogenetic activation of CCK interneurons or (K) maintained hyperpolarization in 2 μM YM022. (L) Quantification of rNSC Vm before and during CNO application in ACSF, or YM022. Bars indicate mean Vm ± SEM. p=0.02(ACSF), 0.09(YM022) by paired t-test for (9,7) cells. (M) Magnitude of depolarization due to CCK activation. p=0.02 by Wilcoxon-Mann-Whitney test for (9,7) cells from (6,6) animals. Bars indicate mean ± SEM for responding rNSCs (>10 mV; circles). Triangles = non responding rNSCs. (N) Percent of cells that depolarized by at least 10 mV. See also Figure S1.
Figure 2.
Figure 2.. CCK induced rNSC depolarization is mediated by a glutamatergic relay.
(A-C) Sample changes in rNSCs Vm to 300 nM CCK8 peptide in the presence of (A) 100 μM APV, 10 μM NBQX, 100 μM AIDA, 50 μM bicuculline, and 1 μM TTX, (B) in ACSF, or (C) in 1 μM YM022. (D) Comparison of peptide induced depolarization of rNSCs. p=(0.003,0.003) for (7,7,7) cells in (6, 4, 5) animals by Wilcoxon-Mann-Whitney test. Bars indicate mean ± SEM for rNSCs that depolarized >10 mV from baseline (circles). ANBAT = APV, NBQX, bicuculline, AIDA, TTX. (E) Percent of rNSCs in (D) that responded >10 mV to CCK8 application. (F-H) Sample recordings of rNSC Vm to chemogenetic activation of CCK interneurons during (F) GABAAR blockade, (G) combined blockade of GABAARs, iGluRs and mGluRs, and (H) when only GABAARs and iGluRs were blocked or when only GABAAR and mGluRs were blocked. Curve fits to data in red, yellow diamonds indicate delay time to Vm deflection. (I) Comparison of depolarization magnitude during CNO application under indicated conditions. One-way ANOVA showed an effect by condition F(4,41)=10.18, p=8.1*10−6, and a post hoc Dunnett analysis gave individual p-values vs ACSF of (0.95,0.018,0.002,0.0008) for (9,11,9,10,7) cells from (6,10,8,7,5) animals. Bars indicate mean ± SEM for rNSCs that depolarized >10 mV (circles). (J) Percent of rNSCs in (I) that depolarized >10 mV. (K) Times from CNO application to initiation of depolarizing event. Bars indicate mean ± SEM. One-way ANOVA showed no effect of condition; F(3,23)=1.66, p=0.2 for (6,10,5,5) responding cells from (5,9,4,4) animals. See also Figure S2.
Figure 3.
Figure 3.. CCK interneurons increase GABAergic inputs onto dentate glutamatergic neurons in a CCK2R manner.
(A) Expression of hM3Dq-mCherry in CCK cells and GCaMP6 in MCs and GCs. Yellow arrows indicate GCaMP6+ GCs, white arrows indicate GCaMP6+ MCs. Scale bars 200 μm, 50 μm. (B) Ca2+ transients in MCs before and during chemogenetic activation of CCK interneurons in ACSF, 1 μM YM022, or 50 μM bicuculline. Gap indicates a 10 min pause of image acquisition for CNO application. (C) Frequency of MC Ca2+ events due to chemogenetic activation of CCK cells in ACSF, YM022, or bicuculline. Lines and markers indicate paired measurements in individual MCs. Bars indicate mean ± SEM Ca2+ frequency. p=(1*10−5,0.27,0.30) by paired t-test for (56,52,87) MCs in (5,3,5) animals. (D) Slice-wise analysis of the percent increasing (green), decreasing (purple), or unchanging (grey) MC Ca2+ frequencies per slice due to CNO application. Stacked bars indicate means ± SEM. p=0.003(ACSF:YM022), 0.60(YM022:bic), 0.0001(ACSF:bic) increasing and 0.02(ACSF:YM022), 0.86(YM022:bic), 0.004(ACSF:bic) decreasing for (10,7,13) slices in (5,3,5) animals by unpaired t-test. (E) Area under MC Ca2+ traces during baseline and chemogenetic activation of CCK cells as in (C). p=(0.032,0.039,0.70). (F) Slice-wise analysis of MC Ca2+ area as in (D). p=0.047(ACSF:YM022), 0.81(YM022:bic), 0.047(ACSF:bic). (G) Sample Ca2+ transients in GCs as in (B). (H) Frequency data of GC Ca2+ as in (C) for (130,68,58) GCs in (5,3,3) animals. p=(0.71,0.39,0.003). (I) Slice-wise analysis of GC frequencies (H) as in (D). p=0.52(ACSF:YM022), 0.018(YM022:bic), 0.0013(ACSF:bic) increasing and 0.032(ACSF:YM022), 0.31(YM022:bic), 0.003(ACSF:bic) decreasing for (9,6,6) slices in (5,3,3) animals. (J) Area data of GC Ca2+ (H) as described in (E). p=(0.52,0.52,0.07). (K) Slice-wise analysis of GC Ca2+ area (J) as described in (F). p=0.96(ACSF:YM022), 0.39(YM022:bic), 0.43(ACSF:bic). (L) YFP expression in PV interneurons and mCherry expression in hM3Dq hilar CCK cells. Arrows indicate YFP+ PV+ cells. Scale bars 200 μm, 100 μm. (M) Cell-attached recordings of PV spiking in ACSF or 1 μM YM022. The gap in the traces indicates a pause of recording during CNO addition. (N) Quantification of fold-changes in spike rates for (7,7) cells from (5,5) animals. p=0.003 by Wilcoxon-Mann-Whitney test. (O) Hilar CCK-cell targeted expression of hM3Dq-mCherry and patch pipette for recordings of GCs. Scale bar 50 μm. (P) Sample inward IPSCs in GCs in ACSF, CNO, CNO + 200 nM ω-agotoxin TK, or CNO + 50 μM bicuculine, using high chloride internal solution. (Q) Quantification of mean ± SEM IPSC frequencies for (12,7) GCs at baseline, during CNO, and then in CNO + ago. p=(0.007,0.048) by paired t-test in (10,6) animals. (R) Fold change in GC IPSC frequency for cells in (Q). p=3*10−5 by unpaired t-test. See also Figure S3.
Figure 4.
Figure 4.. Dentate astrocytes respond to CCK activity and are capable of inducing rNSC depolarization.
(A) Expression of hM3Dq-mCherry in CCK cells and GCaMP6-LCK in astrocytes. Arrows highlight hM3Dq+ processes adjacent to GFAP+ astrocyte. Scale bars 100 μm, 20 μm. (B) Sample astrocyte Ca2+ transients evoked by CCK interneuron activation. The gap in traces indicates a 10 min pause of image acquisition for CNO addition. (C) Astrocyte Ca2+ frequencies due to activation of CCK cells in ACSF, 1 μM YM022, or 50 μM bicuculline + 1 μM CPG. Lines and markers indicate paired measurements of individual ROIs. Bars indicate mean ± SEM Ca2+ frequency for (282, 278, 219) ROIs in (3, 3, 3) animals. p=(1.3*10−12,0.49,1.8*10−9) by paired t-test. (D) Area under Ca2+ traces in (C). p=(0.083,0.47,0.50) by paired t-test. (E) Astrocyte Ca2+ events frequencies to 300 nM CCK8 peptide while in 1 μM TTX for 142 ROIs from 3 animals. p=0.014 by paired t-test. (F) Area under Ca2+ traces in (E). p=0.03 by paired t-test. (G) Astrocytic targeting of hM3Dq for chemogenetic stimulation. Arrows highlight colocalized expression in GFAP+ cells. Scale bars 100 μm, 20 μm. (H) Sample astrocyte Ca2+ transients in hM3D+ astrocytes due to CNO application. The gap in traces indicates a 10 min pause of image acquisition for CNO addition. (I) Frequencies of astrocyte Ca2+ due to chemogenetic activation of astrocytes for 166 regions from 3 animals. p=0.0006 by paired t-test. (J) Area under Ca2+ traces in (I). p=0.31 by paired t-test. (K) Expression of hM3Dq in astrocytes in Nestin-GFP mouse. Scale bar 100 μm. (L) Recording of a GFP+ mCherry rNSC during chemogenetic stimulation of astrocytes. (M) Vm of rNSCs before and during CNO application. Bars indicate mean ± SEM. p=0.006 by paired t-test for 7 cells. (N) Magnitude of CNO induced depolarization in either ACSF, or in 100 μM APV + 10 μM NBQX + 100 μM AIDA. p=0.038, by unpaired t-test for all (7,7) cells from (4,3) animals. Bars indicate mean ± SEM for rNSCs responding >10 mV (circles). Triangles = non-responders. (O) Percent of cells that depolarized >10 mV.
Fig 5.
Fig 5.. CCK induced rNSC depolarization requires astrocyte intermediates.
(A) Reduced rNSC depolarization when slices are preincubated in 100 μM FC. (B) Vm of rNSCs due to chemogenetic activation of CCK cells in FC treated slices. Bars indicate mean Vm ± SEM. p=0.02 by paired t-test for 7 cells from 4 animals. Darker blue lines = rNSCs responding >10 mV. (C) Expression of mCherry and GCaMP6-LCK in GFAP+ astrocytes for pipette targeting and BAPTA filling. Scale bars 100 μm, 20 μm. (D) Ca2+ traces in hilar astrocytes at baseline and then after BAPTA infusion into a single mCherry+ astrocyte. (E) Frequencies of nearby astrocyte Ca2+ events due to intracellular BAPTA infusion. Lines and markers indicate paired measurements in individual ROIs. Bars indicate mean ± SEM frequencies for 107 astrocytic ROIs in 3 animals. p=2.3*10−13 by paired t-test. (F) Area under Ca2+ traces in (E). p=1.9*10−5 by paired t-test. (G) CCK-Cre::Nestin-GFP animal with (top) BAPTA filling pipette on a mCherry+ astrocyte in the hilus and (bottom) recording configuration from GFP+ rNSC. Scale bar 50 μm. (H) Vm recording from a GFP+ rNSCs during CCK chemogenetic activation after high BAPTA. (I) Vm of rNSCs due to CCK activation after astrocytic BAPTA. p=0.16 by paired t-test for 7 cells in 6 animals. Darker purple lines = rNSCs responding >10 mV. (J) mRFP-p130PH and GCaMP6-LCK expression in DG astrocytes. Arrows indicate colocalization in GFAP+ astrocytes. Scale bars 100 μm, 20 μm. (K) Basal astrocyte Ca2+ frequencies in control or p130PH injected hemispheres. Bars indicate mean ± SEM frequency. p=0.11 for (275,236) astrocyte ROIs in 3 animals by unpaired t-test. (L) Area under Ca2+ traces in (K). p=0.009. (M) Frequencies of DG astrocyte Ca2+ events due to 300 nM CCK8 peptide in p130PH or control hemisphere. Baseline data is identical to (K). p=(0.005,0.11) for (275,236) astrocyte ROIs in 3 animals by paired t-test. (N) Area under Ca2+ traces in (M). p=(0.3,0.16). (O) Vm from a GFP+ rNSC from p130PH injected DG upon chemogenetic activation of CCK cells. (P) Vm of rNSCs due to CCK activation in p130PH injected DGs. p=0.13 by paired t-test for 10 cells in 5 animals. Bars indicate mean Vm ± SEM. Darker red lines = rNSCs responding >10 mV. (Q) Magnitude of depolarization due to chemogenetic CCK activation in indicted conditions. One-way ANOVA showed a significant effect of condition F(3,29)=9.01,p=0.002, and Dunnett post hoc analysis showed each are significantly reduced from ACSF. p=(0.009,0.009,0.004) for (9,7,7,10) cells from (6,4,6,5) animals. Bars indicate mean ± SEM for rNSCs responding >10 mV (circles). Triangles = non responding rNSCs. (R) Percent of cells that depolarized >10 mV. See also Figure S4.
Figure 6.
Figure 6.. CCK interneuron stimulation promotes proliferation of rNSCs via MAPK/ERK signaling and increases neurogenesis.
(A) Experimental paradigm for in vivo stimulation of CCK interneurons and c-Fos analysis. (B) DG c-Fos expression after CCK chemogenetic activation. Arrows indicate hilar mCherry+ c-Fos+ cells. Scale bars 100 μm, 20 μm. (C) Density of c-Fos labeled hilar mCherry+ cells. p=0.034 for (3,4) animals by Student’s t-test. (D) Experimental paradigm for quantification of phospho-ERK, phospho-RB, or EdU uptake in response to chemogenetic stimulation of CCK interneurons. (E) Phospho-ERK+ rNSCs in the DG 80 minutes after IP CNO. Scale bar 10 μm. Arrows highlight pERK+ Nestin+ adult rNSCs. (F) Density of pERK+ rNSCs for (4,5) animals. Bars indicate means ± SD. p=0.013 by Student’s t-test. (G) Phospho-RB+ rNSCs in the DG 5 hours after IP CNO. Scale bar 10 μm. Arrow highlights a pRB+ Nestin+ rNSC. (H) Density of pRB+ rNSCs for (5,4) animals. Bars indicate means ± SD. p=0.008 by Student’s t-test. (I) EdU uptake in rNSCs after 4 days of CNO drinking water. Scale bars 100 μm, 20 μm. Arrow highlights an EdU+ Nestin+ adult rNSC. (J-M) Proportion (J) and density (K) of proliferating adult neural stem cells in the DG, density of all proliferating cells (L), and total rNSC pool (M). Bars indicate means ± SD. p=(0.03,0.05,0.80,0.005) for (6,5) animals by Student’s t-test. (N) Experimental paradigm for quantification of neurogenic proliferation in response to in vivo chemogenetic activation of CCK interneurons. (O) DCX+ adult-born immature neurons after 3 weeks of CNO drinking water. Scale bars 100 μm, 20 μm. Arrows indicate DCX+ EdU+ cells. (P-Q) Density (P) of DCX+ EdU+ immature neurons and rNSC pool (Q) after in vivo chemogenic stimulation of CCK interneurons. Bars indicate means ± SD; p=(0.047,0.29) for (4,6) animals by Student’s t-test. See also Figure S5.
Figure 7.
Figure 7.. Reduced dentate CCK induces reactive astrocytes and decreases rNSCs proliferation potentially via neuroinflammatory-related gene profiles.
(A-B) Western blot and densitometry of hippocampal lysates 1 month after injection of shCCK or shScr AAVs. p=0.02 from (3,3) animals by Student’s t-test. (C) Reduced CCK immunofluorescence in the hilus of shCCK treated animals. Arrows indicate targeted GFP+ hilar cells. Scale bars 100 μm, 20 μm. (D) GFAP reactivity after knockdown of DG CCK. Scale bar 100 μm. (E) Quantification of %GFAP immunofluorescence per volume for (4,4) animals. p=0.03 by unpaired t-test. (F-I) Proportion (F) and density (G) of proliferating rNSCs, density (H) of total proliferating cells, and total (I) rNSC pool after shCCK. Bars indicate means ± SD. p=(0.011,0.009,0.002,0.81) for (8,12) animals by Student’s t-test. (J) Volcano plot of fold changes in gene expression due to shCCK, highlighting upregulated and downregulated DEGs. (K) Heatmap of 17 DEGs related to reactive astrocyte states from 3 animals in each treatment group. Pan-reactive, type A1, and type A2 reactive astrocyte genes are indicated. Color indicates direction and relative magnitude of FPKMs. (L) Gene Ontology terms identified from analysis of all 496 DEGs identifying immune processes and negative regulation of proliferation. (M) Transcript expression in rNSCs (based on Shin et al 2015) and heatmap of 21 DEGs related to negative control of proliferation. Color indicates direction and relative magnitude of FPKMs. Green highlighted genes are additionally implicated in immune processes. See also Figure S6.
Figure 8.
Figure 8.. Model of dentate CCK interneuron regulation of rNSCs through differential astrocyte states.
(A) Dentate CCK terminals, via CCK2Rs, induce glutamate release from astrocytes, which activate iGluRs and mGluRs on rNSCs and induce intracellular signaling cascades including phosphorylation of ERK1/2, translocation to the nucleus, hyperphosphorylation of RB, and unbinding of transcription factor E2F. Unbound E2F can drive transcription of genes that promote cell cycle progression. PV interneurons, meanwhile are excited by CCK, and contribute to GABAergic inhibition of local glutamatergic circuitry. (B) Conversely, reduced CCK levels reflect pathogenic states, and result in immune activation, neuroinflammation, and reactive astrocyte states, leading to inactivation of rNSCs likely through cytokine signaling and gene expression changes that negatively regulate proliferation.

Comment in

References

    1. Acsady L, Katona I, Martinez-Guijarro FJ, Buzsaki G, and Freund TF (2000). Unusual target selectivity of perisomatic inhibitory cells in the hilar region of the rat hippocampus. The Journal of neuroscience : the official journal of the Society for Neuroscience 20, 6907–6919. - PMC - PubMed
    1. Aprea J, and Calegari F (2012). Bioelectric state and cell cycle control of Mammalian neural stem cells. Stem Cells Int 2012, 816049. - PMC - PubMed
    1. Araque A, Sanzgiri RP, Parpura V, and Haydon PG (1998). Calcium elevation in astrocytes causes an NMDA receptor-dependent increase in the frequency of miniature synaptic currents in cultured hippocampal neurons. The Journal of neuroscience : the official journal of the Society for Neuroscience 18, 6822–6829. - PMC - PubMed
    1. Arey RN, Enwright JF 3rd, Spencer SM, Falcon E, Ozburn AR, Ghose S, Tamminga C, and McClung CA (2014). An important role for cholecystokinin, a CLOCK target gene, in the development and treatment of manic-like behaviors. Molecular psychiatry 19, 342–350. - PMC - PubMed
    1. Armbruster BN, Li X, Pausch MH, Herlitze S, and Roth BL (2007). Evolving the lock to fit the key to create a family of G protein-coupled receptors potently activated by an inert ligand. Proceedings of the National Academy of Sciences of the United States of America 104, 5163–5168. - PMC - PubMed

Publication types