. 2020 Oct 1;80(1):164-174.e4.
doi: 10.1016/j.molcel.2020.08.006. Epub 2020 Aug 11.

Growth Factor Receptor Signaling Inhibition Prevents SARS-CoV-2 Replication

Affiliations

Growth Factor Receptor Signaling Inhibition Prevents SARS-CoV-2 Replication

Kevin Klann et al. Mol Cell. .

Abstract

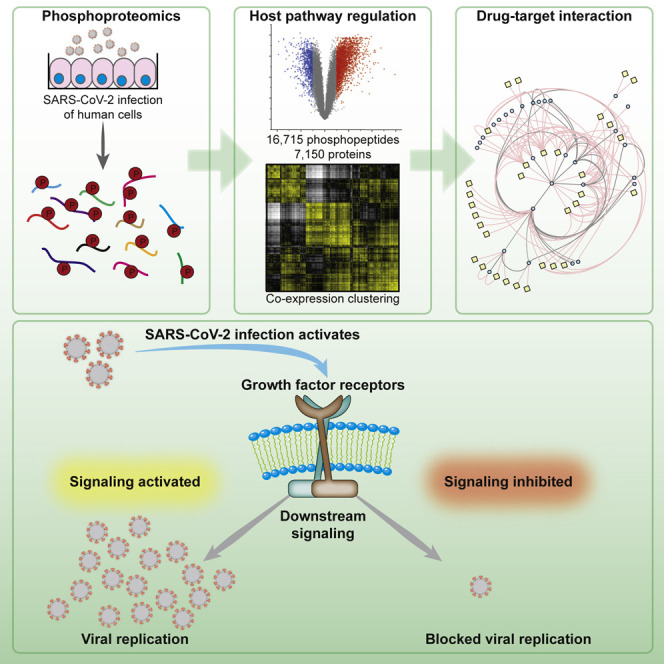
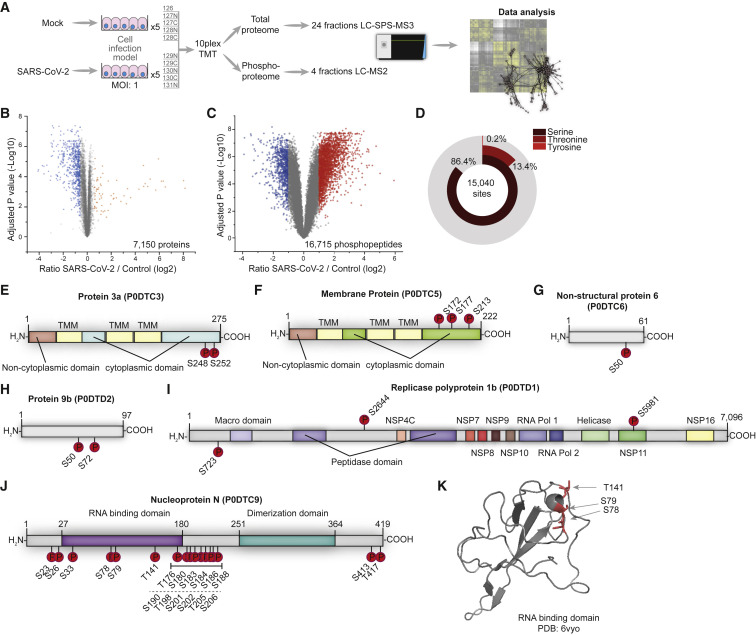
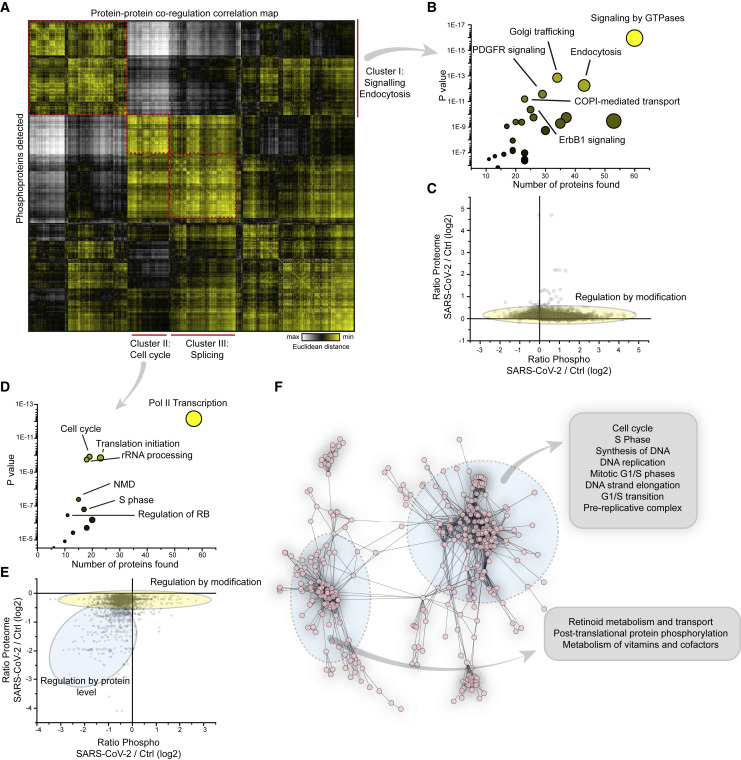
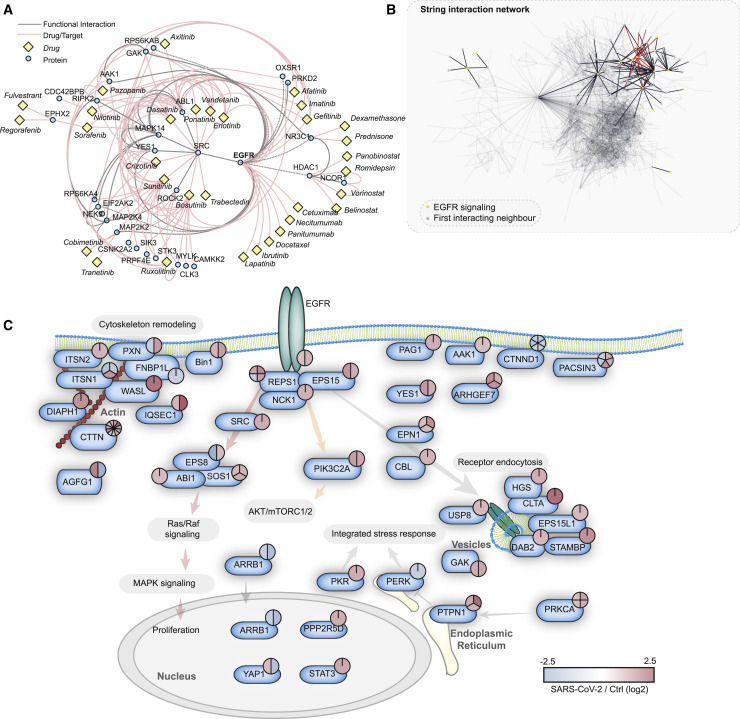
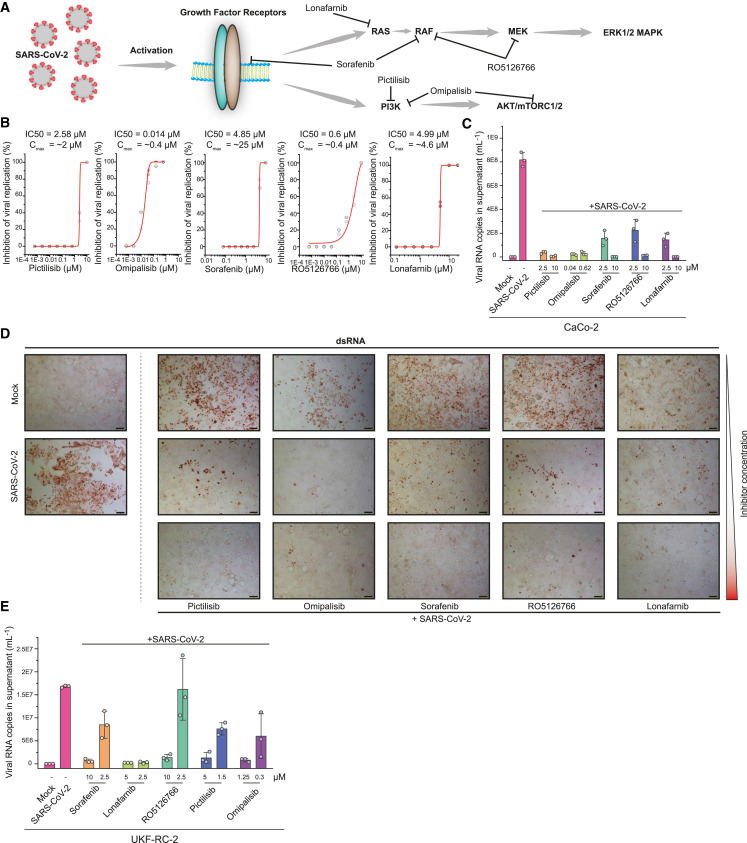
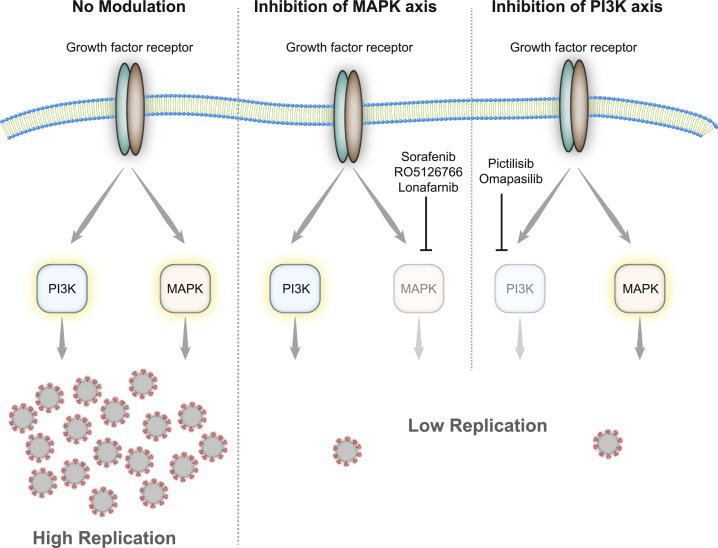
SARS-CoV-2 infections are rapidly spreading around the globe. The rapid development of therapies is of major importance. However, our lack of understanding of the molecular processes and host cell signaling events underlying SARS-CoV-2 infection hinders therapy development. We use a SARS-CoV-2 infection system in permissible human cells to study signaling changes by phosphoproteomics. We identify viral protein phosphorylation and define phosphorylation-driven host cell signaling changes upon infection. Growth factor receptor (GFR) signaling and downstream pathways are activated. Drug-protein network analyses revealed GFR signaling as key pathways targetable by approved drugs. The inhibition of GFR downstream signaling by five compounds prevents SARS-CoV-2 replication in cells, assessed by cytopathic effect, viral dsRNA production, and viral RNA release into the supernatant. This study describes host cell signaling events upon SARS-CoV-2 infection and reveals GFR signaling as a central pathway essential for SARS-CoV-2 replication. It provides novel strategies for COVID-19 treatment.

Keywords: COVID-19; PI3K; RAS; SARS-CoV-2; TMT; drug repurposing; phosphoproteomics; proteomics; signaling; viral replication.


Conflict of interest statement

Declaration of Interests The authors filed a patent application on the use of GFR signaling inhibitors for the treatment of COVID-19.

Figures

None
Graphical abstract
Figure 1
Figure 1
Phosphoproteomic Profiling of SARS-CoV-2-Infected Cells (A) Experimental scheme. Caco-2 cells were infected with SARS-CoV-2 for 1 h (MOI 1), washed, and incubated for an additional 24 h. Proteins were extracted and prepared for bottom-up proteomics. All 10 conditions were multiplexed using TMT10 reagents. A total of 250 μg pooled samples were used for whole-cell proteomics (24 fractions) and the remainder (~1 mg) enriched for phosphopeptides by Fe-NTA. Phosphopeptides were fractionated into 8 fractions and concatenated into 4 fractions. All of the samples were measured on an Orbitrap Fusion Lumos. (B) Volcano plot showing fold changes (FCs) of infected versus mock cells for all quantified phosphopeptides. p values were calculated using an unpaired, 2-sided Student’s t test with equal variance assumed and adjusted using the Benjamini-Hochberg false discovery rate (FDR) method (N = 5 biological replicates). Orange or blue points indicate significantly increased or decreased phosphopeptides, respectively. (C) Volcano plot showing differences between SARS-CoV-2 and mock-infected cells in total protein levels for all quantified proteins. p values were calculated using an unpaired, 2-sided Student’s t test with equal variance assumed and adjusted using the Benjamini-Hochberg FDR method (N = 5). Orange or blue points indicate significantly increased or decreased phosphopeptides, respectively. (D) Distribution of phosphorylation sites identified across modified amino acids. See also Figure S1 and Tables S1 and S2. (E–K) Domain structures of SARS-CoV-2 proteins predicted by InterPro. Identified phosphorylation sites are indicated. Protein 3a (E), membrane protein M (F), non-structural protein 6 (G), protein 9b (H), replicase polyprotein 1b (I), and nucleoprotein N (J). (K) X-ray structure of the RNA-binding domain (PDB: 6vyo, residues 47–173), with identified phosphorylation sites marked in red. See also Figure S1 and Tables S1, S2, and S3.
Figure 2
Figure 2
Correlation of Co-regulated Proteins Identifies Cellular Signaling Pathways Modulated upon Infection (A) Correlation map of all detected phosphoproteins indicating Euclidean distance between proteins. To determine correlation, Z scores of phosphopeptides and total protein levels were added and all of the peptide values for 1 protein collapsed into an average Z score. Correlation clustering was performed by Euclidean distance on combined Z scores for all conditions. The red dashed line indicates the main clusters found and identified. (B) Reactome pathway enrichment of proteins found in cluster I in (A). Shown are the number of proteins identified in the respective cluster versus the statistical significance of enrichment. The circles are increasingly sized according to the number of proteins found in the pathway. (C) Scatterplot showing FCs of phosphopeptides compared to FCs of total protein levels. The yellow oval indicates peptides for which phosphorylation is not driven by changes in protein abundance. (D) Reactome pathways found enriched in cluster II in (A); analyses and presentation as in (B). (E) Scatterplot showing correlation between FCs of phosphopeptides compared to FCs of total proteins levels. Two subsets of phosphopeptides were detected: one was mainly regulated by differential modification (indicated in yellow), the other by changes in protein abundance. (F) STRING network analysis of proteins decreased in total protein levels (Figure 1C). The inserts indicate pathways found in the network. See also Figures S2 and S3 and Tables S1, S2, S4, and S7.
Figure 3
Figure 3
Drug-Target Phosphoprotein Network Analysis Identifies Growth Factor Signaling as Central Hub for Possible Intervention by Repurposed Drugs (A) Proteins significantly increased in phosphorylation (FC > 1, FDR < 0.05) were subjected to ReactomeFI pathway analysis and overlaid with a network of US Food and Drug Administration (FDA)-approved drugs. The network was filtered for drugs and drug targets only, to identify pathways that could be modulated by drug repurposing. The red lines indicate drug-target interactions, and the gray lines protein-protein interactions. The identified drugs are represented with yellow rectangles, while proteins are represented by blue circles. (B) Search across all proteins with significant phosphorylation changes upon SARS-CoV-2 infection for proteins related to the EGFR pathway. The STRING network highlights all of the proteins annotated for EGFR signaling and their direct interaction neighbors. The red lines indicate direct EGFR interactions, the black lines indicate interactions between pathway members, and the gray lines represent filtered interactions to represent the whole network. (C) Pathway representation of proteins identified in (B) to be direct functional interactors of EGFR, according to the STRING interaction database (confidence cutoff 0.9). The phosphorylation changes of all significantly regulated sites are indicated by color-coded pie charts. Red indicates upregulation and blue indicates downregulation. See also Figure S4.
Figure 4
Figure 4
Inhibition of Growth Factor Receptor Downstream Signaling Prevents SARS-CoV-2 Replication (A) Schematic representation of growth factor signaling pathways activated upon SARS-CoV-2 infection. The inhibitors tested are indicated and their targets are shown. (B) Viral replication assay. The percentage inhibition of cytopathic effects (CPEs) is plotted versus compound concentration (N = 3 biological replicates for all compounds). The gray dots indicate replicate measurements, and the red lines indicate dose-response curve fits. (C) Quantification of viral RNA in the supernatant of Caco-2 cells. The supernatants of control cells, infected cells (MOI 0.01), and infected cells treated either with pictilisib, omipalisib, sorafenib, RO5126766, or lorafenib at the indicated concentrations were analyzed by qPCR for viral genome. N = 3; bar indicates the mean of replicates, error bars indicate SDs. (D) Microscopy images showing staining for double-stranded RNA (dsRNA) to determine viral dsRNA production and CPE. Mock- or SARS-CoV-2 infected cells are shown at left. SARS-CoV-2-infected cells were treated with different concentrations of inhibitors (as indicated) and imaged after 24 h. Pictilibsib: 0.625, 2.5, and 10 μM; omipalisib: 0.01, 0.625, and 2.5 μM; sorafenib: 2.5, 5, and 10 μM; RO5126766: 2.5, 5, and 10 μM; lonafarnib: 0.6, 2.5, and 10 μM. N = 3 technical replicates, 1 representative image is shown; 2 more areas of the same well are shown in Figure S4. Scale bar represents 100 μm. (E) Quantification of viral RNA in the supernatant of UKF-RC-2 cells. Supernatant of control cells, SARS-CoV-2-infected cells (MOI 0.1) untreated or treated with pictilisib, omipalisib, sorafenib, RO5126766, or lorafenib at indicated concentrations were analyzed by qPCR for viral genome. N = 3 biological replicates; bar indicates the mean of replicates and the error bars indicate SDs. See also Figure S5.
Figure 5
Figure 5
Effect of Growth Factor Signaling on SARS-CoV-2 Replication Upon infection, growth factor signaling is activated and leads, among others, to the induction of phosphatidylinositol 3-kinase (PI3K) and mitogen-activated protein kinase (MAPK) signaling events. The inhibition of either axis of the 2 (by sorafenib, RP5126766, lonafarnib, pictilisib, or omapalisib) leads to the decreased replication of SARS-CoV-2 inside the host cell.

References

    1. Baturcam E., Vollmer S., Schlüter H., Maciewicz R.A., Kurian N., Vaarala O., Ludwig S., Cunoosamy D.M. MEK inhibition drives anti-viral defence in RV but not RSV challenged human airway epithelial cells through AKT/p70S6K/4E-BP1 signalling. Cell Commun. Signal. 2019;17:78. - PMC - PubMed
    1. Beerli C., Yakimovich A., Kilcher S., Reynoso G.V., Fläschner G., Müller D.J., Hickman H.D., Mercer J. Vaccinia virus hijacks EGFR signalling to enhance virus spread through rapid and directed infected cell motility. Nat. Microbiol. 2019;4:216–225. - PMC - PubMed
    1. Blom N., Gammeltoft S., Brunak S. Sequence and structure-based prediction of eukaryotic protein phosphorylation sites. J. Mol. Biol. 1999;294:1351–1362. - PubMed
    1. Blom N., Sicheritz-Pontén T., Gupta R., Gammeltoft S., Brunak S. Prediction of post-translational glycosylation and phosphorylation of proteins from the amino acid sequence. Proteomics. 2004;4:1633–1649. - PubMed
    1. Bojkova D., Klann K., Koch B., Widera M., Krause D., Ciesek S., Cinatl J., Münch C. Proteomics of SARS-CoV-2-infected host cells reveals therapy targets. Nature. 2020;583:469–472. - PMC - PubMed

Publication types

MeSH terms