. 2020 Sep 1;32(9):108086.
doi: 10.1016/j.celrep.2020.108086.

Most Commonly Mutated Genes in High-Grade Serous Ovarian Carcinoma Are Nonessential for Ovarian Surface Epithelial Stem Cell Transformation

Affiliations

Most Commonly Mutated Genes in High-Grade Serous Ovarian Carcinoma Are Nonessential for Ovarian Surface Epithelial Stem Cell Transformation

Robert Joseph Yamulla et al. Cell Rep. .

Abstract

High-grade serous ovarian carcinoma (HGSOC) is the fifth leading cause of cancer-related deaths of women in the United States. Disease-associated mutations have been identified by the Cancer Genome Atlas Research Network. However, aside from mutations in TP53 or the RB1 pathway that are common in HGSOC, the contributions of mutation combinations are unclear. Here, we report CRISPR mutagenesis of 20 putative HGSOC driver genes to identify combinatorial disruptions of genes that transform either ovarian surface epithelium stem cells (OSE-SCs) or non-stem cells (OSE-NSs). Our results support the OSE-SC theory of HGSOC initiation and suggest that most commonly mutated genes in HGSOC have no effect on OSE-SC transformation initiation. Our results indicate that disruption of TP53 and PTEN, combined with RB1 disruption, constitutes a core set of mutations driving efficient transformation in vitro. The combined data may contribute to more accurate modeling of HGSOC development.

Keywords: CRISPR/Cas9; mutagenesis; ovarian cancer; stem cells; tumor drivers.


Conflict of interest statement

Declaration of Interests The authors declare no competing interests.

Figures

Figure 1.
Figure 1.. Strategy for Identifying HGSOC Tumor Suppressor Combinations
A total of 60 constructs were made in the vector LentiCRISPRv2, constituting the “minilibrary.” OSE-NSs or OSE-SCs were transduced with functionally validated LentiCRISPRs and then plated in soft agar. Individual transformants/colonies were isolated and individually cultured. Genome-integrated LentiCRISPRs from each transformant were identified by sequencing, and overrepresented combinations were later validated in directed soft agar transformation assays. OSE-SCs, ovarian surface epithelium stem cells; OSE-NSs, ovarian surface epithelium non-stem cells; NGS, next-generation sequencing.
Figure 2.
Figure 2.. OSE-SCs (ALDH+) Transform More Frequently Than OSE-NSs (ALDH) Despite SimilarViral Transduction Rates
(A) Percent transformation of OSE-SCs, OSE-NSs, and unsorted OSE cells following LentiCRISPRv2 minilibrary transduction. OSE-SCs transformed more frequently than OSE-NSs and unsorted OSE cells. Unsorted OSE cells transformed more frequently than OSE-NSs (5 technical replicates, Standard error of the mean [SEM] error bars). (B and C) FUGW-mCherry (mCherry-expressing lentivirus) transduction efficiency in OSE-SCs and OSE-NSs detected by flow cytometry. Flow cytometry was used to count mCherry+ cells following transduction with equal concentrations of FUGW-mCherry lentivirus. Percentages indicate the percentage of total cells that are mCherry+. The dark gray lines represent cell counts of untransduced cells. The red line represents cell counts of FUGW-mCherry-transduced cells. OSE-SCs and OSE-NSs gained mCherry fluorescence at similar rates following lentiviral transduction.
Figure 3.
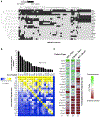
Figure 3.. Identification of Genome-Integrated LentiCRISPRs and Overrepresented Target Gene Combinations in OSE-SCs
(A) Genome-integration and hierarchical clustering of LentiCRISPRv2 constructs in OSE-SC samples. Hierarchical clustering was performed on both sample similarity and gene targeting. (B) Overall percent gene targeting and co-targeting frequency. Significance (p < 0.05) for single integration overall was assessed using χ2 (degrees of freedom [df] = 19) and is indicated with an asterisk. The heatmap displays co-integration frequency of each gene present on the x axis with a gene shown on the y axis. (C) Overrepresentation of co-targeted genes in sample subgroups. Over-or underrepresentation was determined using χ2 analyses. χ2 values corresponding to p ≤ 0.05 (df = 19) are colored in green. Red coloration indicates that co-integration may have occurred by chance and that the p ≥ 0.05.
Figure 4.
Figure 4.. Targeted OSE-SC-Transformation Assay and Validation of Overrepresented LentiCRISPR Combinations
A baseline level of adhesion-independent growth was first assessed y induction of specific “core mutations” by LentiCRISPRv2 targeting. Additional minilibrary target genes were then mutated (using LentiCRISPRv2) alongside core mutations to assess whether they act synergistically to promote adhesion independent growth. ANOVA post hoc analyses were used to assess differences between means. The p values for group means greater than the baseline are shown. Colony counts that are significantly lower than baseline rates (p < 0.05) are labeled with an obelisk (†). SEM error bars. n = 6 for all cases unless otherwise specified. (A) Targeted transduction of Trp53, Rb1, Pten, and Cdkn2a LentiCRISPRs in OSE-SCs. Significantly greater rates of OSE-SC transformation versus OSE-SC transduced with Trp53 LentiCRISPRs alone occurred when all four genes were targeted together or by mutagenesis of Trp53, Rb1 (or Cdkn2a), and Pten. B) Targeted transduction of Trp53, Cdkn2a, and Pten LentiCRISPRs plus putative transformation enhancers. Only the addition of Ankrd11 or Wwox LentiCRISPRs to Trp53, Cdkn2a, and Pten LentiCRISPRs significantly enhanced colony formation versus Trp53−/Cdkn2a−/Pten− OSE-SCs. The addition of Fancd2 or Rad51c significantly decreased colony count. (C) Targeted transduction of Brca2 LentiCRISPRs and Brca2-associated LentiCRISPRs. Fancd2 mutations functioned synergistically with Brca2, Trp53, and Rb1 mutations to significantly enhance colony formation versus Trp53−/Rb1−/Brca2− or Trp53−/Rb1− OSE-SCs. (D) Targeted mutagenesis of Rad51c LentiCRISPRs and Rad51c-associated LentiCRISPRs. Fat3 mutagenesis alongside Trp53, Cdkn2a, Pten, and Rad51c significantly increased colony count compared to Trp53−/Rb1−/Pten−/Rad51c− OSE-SCs.
Figure 5.
Figure 5.. Identification of Genome-Integrated LentiCRISPRs Overrepresented Target Gene Combinations in OSE-NSs
(A) Percent gene-targeting frequency in all 11 OSE-NS colonies obtained. (B) Genome integration and hierarchical clustering of LentiCRISPRv2 constructs in OSE-SC samples. The binary color scale shows whether a gene is targeted by at least one LentiCRISPR in each individual sample. Light gray indicates that a given gene was not targeted, and dark gray indicates that a gene was targeted by at least one LentiCRISPRv2 construct. Hierarchical clustering was performed on both sample similarity and gene targeting, resulting in several clusters of co-targeted genes and similar transformants.
Figure 6.
Figure 6.. Model of Mutations Necessary for Efficient In Vitro OSE-SC Transformation
Random mutagenesis assays and targeted experiments revealed minimal requirements for adhesion-independent growth and mutations that enhance transformation. The blue box contains genes that are minimal requirements for transformation or cause transformation at low efficiency. The addition of mutations shown in the yellow box cause significant degrees of transformation. The addition of further mutations in genes shown in the green box allow for the highest rates of transformation. Genes listed in the red box inhibit transformation. However, two exceptions exist. Brca2 and Fancd2 (marked with a single asterisk) co-mutagenesis alongside Trp53 and Rb1 result in efficient OSE-SC transformation. Similarly, Rad51c (marked with two asterisks) and Fat3 plus Trp53, Cdkn2a, and Pten caused efficient transformation.

References

    1. Adler E, Mhawech-Fauceglia P, Gayther SA, and Lawrenson K (2015). PAX8 expression in ovarian surface epithelial cells. Hum. Pathol 46,948–956. - PMC - PubMed
    1. Auersperg N (2013). Ovarian surface epithelium as a source of ovarian cancers: unwarranted speculation or evidence-based hypothesis? Gynecol. Oncol 130,246–251. - PubMed
    1. Auersperg N, Wong AS, Choi KC, Kang SK, and Leung PC (2001). Ovarian surface epithelium: biology, endocrinology, and pathology. Endocr. Rev 22, 255–288. - PubMed
    1. Auersperg N, Woo MMM, and Gilks CB (2008). The origin of ovarian carcinomas: a developmental view. Gynecol. Oncol 110, 452–454. - PubMed
    1. Bobbs AS, Cole JM, and Cowden Dahl KD (2015). Emerging and evolving ovarian cancer animal models. Cancer Growth Metastasis 8, 29–36. - PMC - PubMed

Publication types