. 2020 Sep 1;32(9):108080.
doi: 10.1016/j.celrep.2020.108080.

Cell Cycle Checkpoints Cooperate to Suppress DNA- and RNA-Associated Molecular Pattern Recognition and Anti-Tumor Immune Responses

Affiliations

Cell Cycle Checkpoints Cooperate to Suppress DNA- and RNA-Associated Molecular Pattern Recognition and Anti-Tumor Immune Responses

Jie Chen et al. Cell Rep. .

Abstract

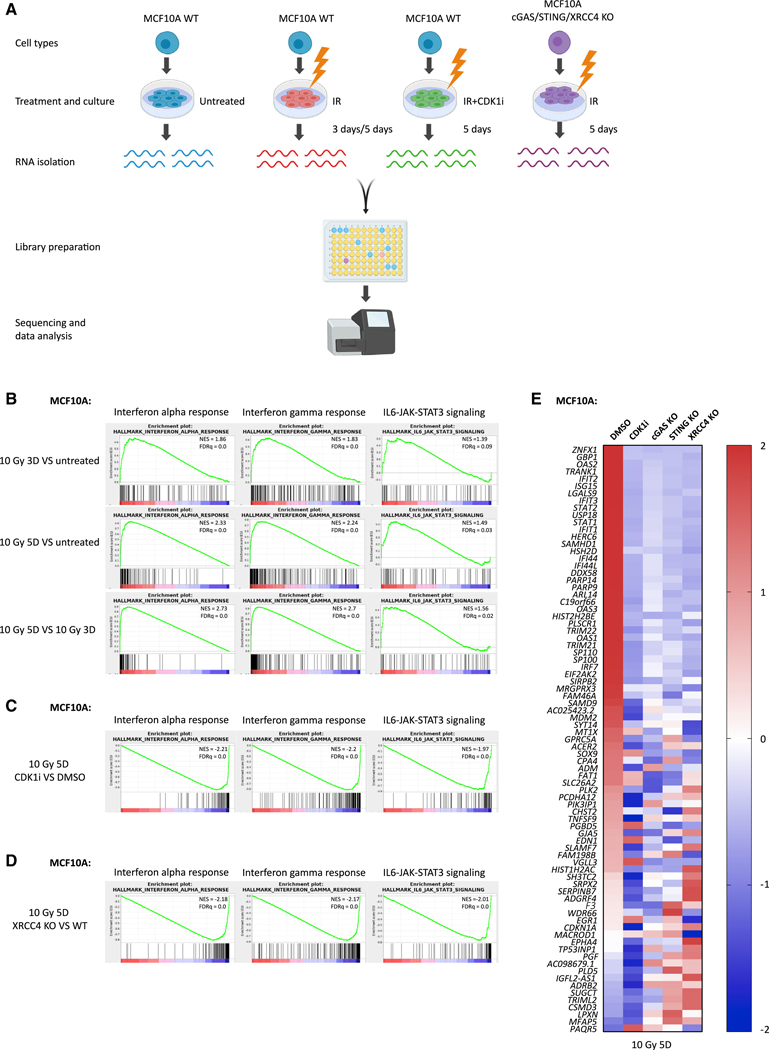
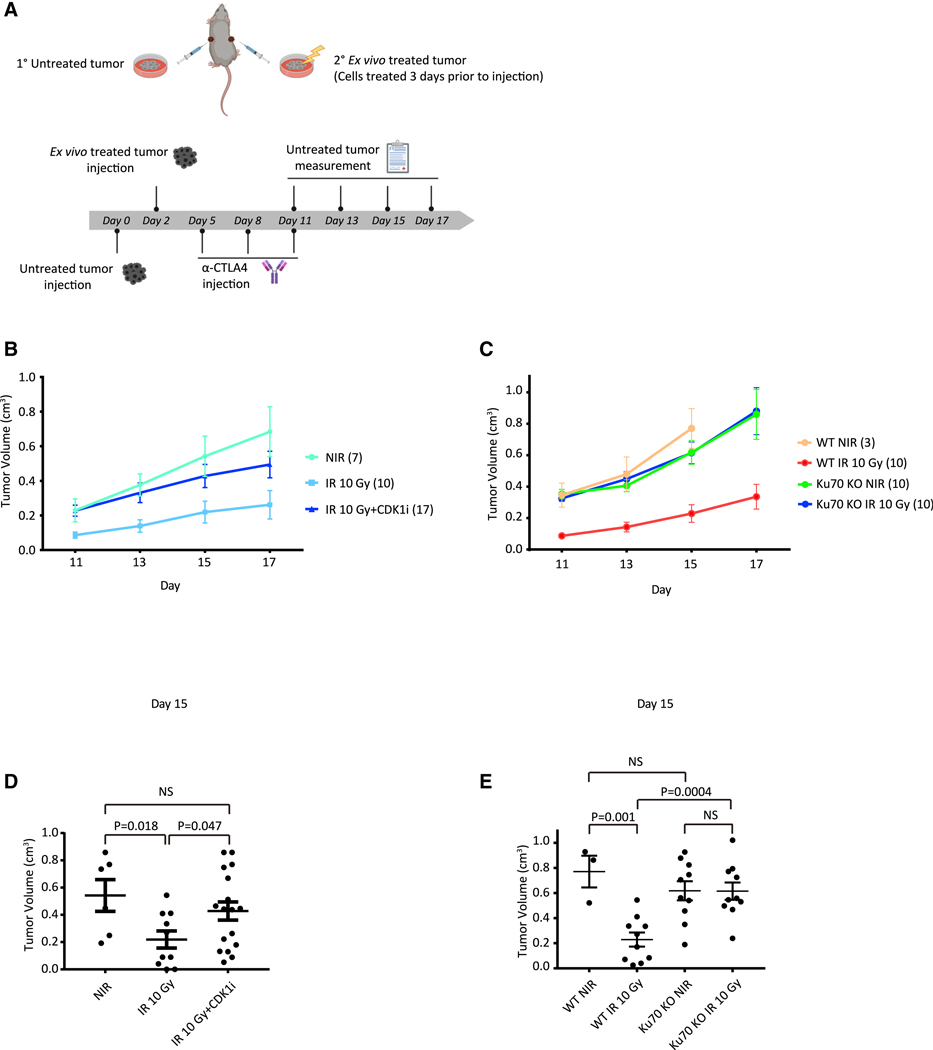
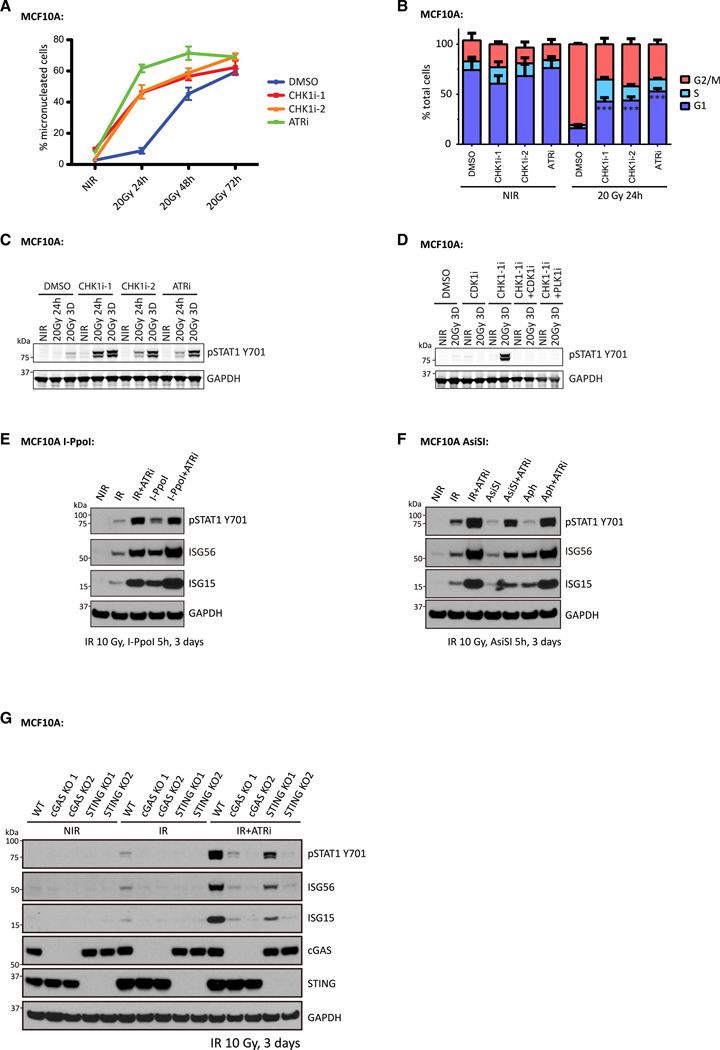
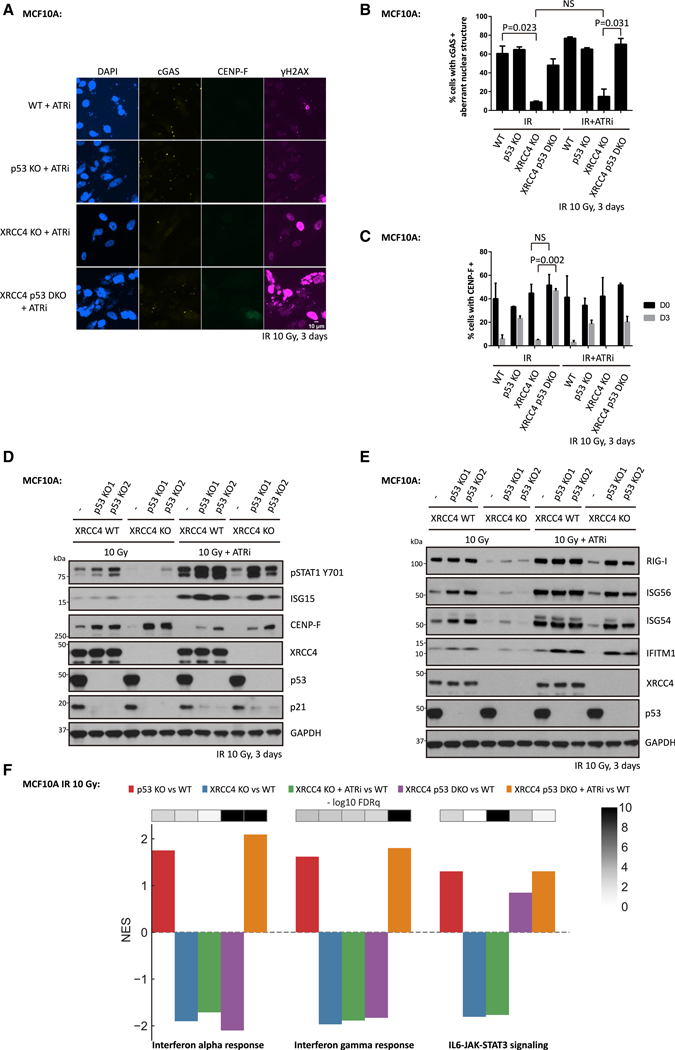
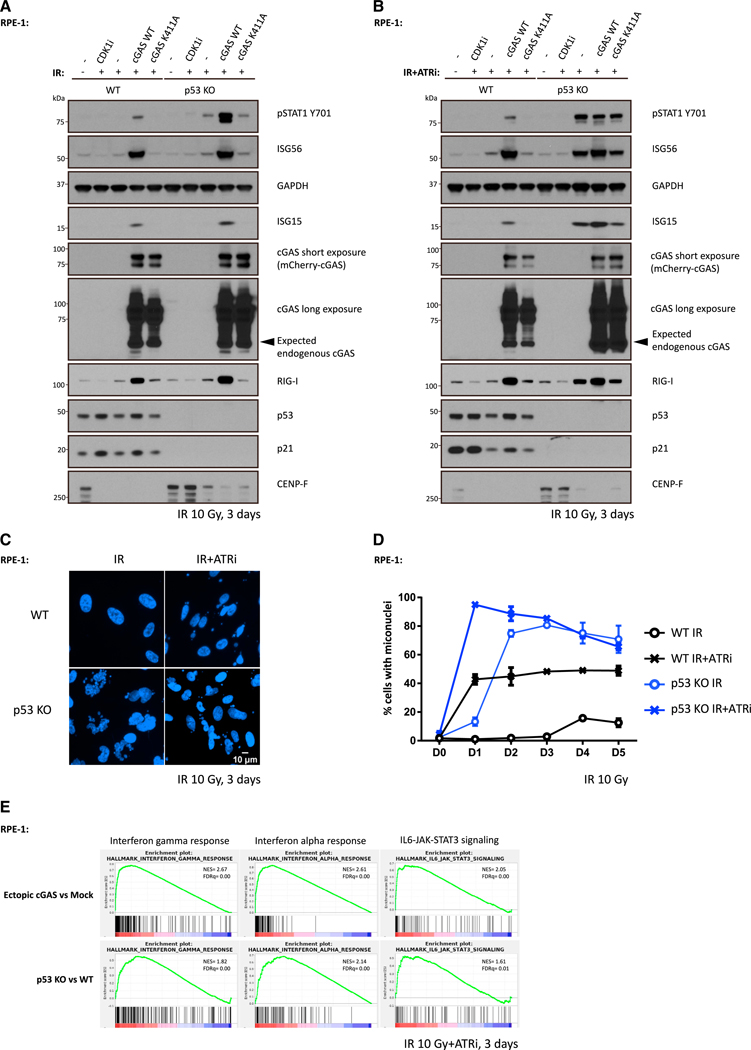
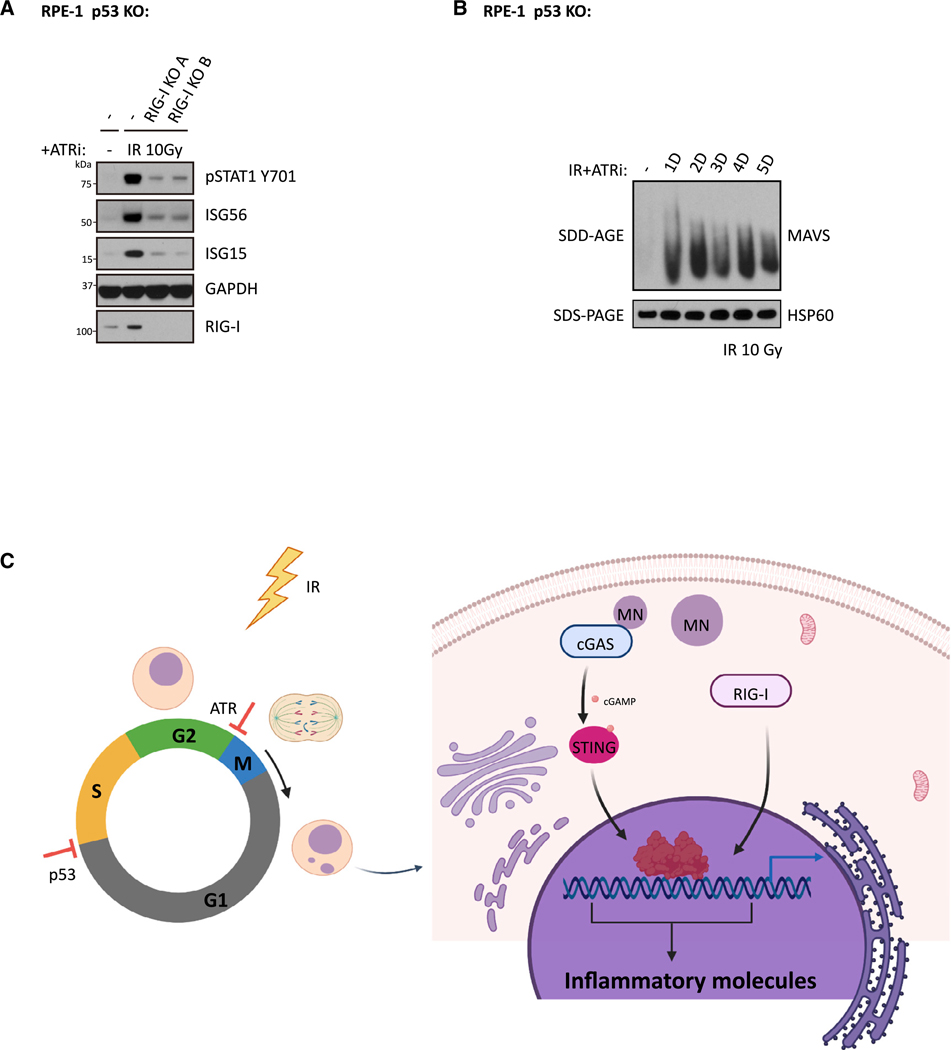
The DNA-dependent pattern recognition receptor, cGAS (cyclic GMP-AMP synthase), mediates communication between the DNA damage and the immune responses. Mitotic chromosome missegregation stimulates cGAS activity; however, it is unclear whether progression through mitosis is required for cancercell-intrinsic activation of anti-tumor immune responses. Moreover, it is unknown whether cell cycle checkpoint disruption can restore responses in cancer cells that are recalcitrant to DNAdamage-induced inflammation. Here, we demonstrate that prolonged cell cycle arrest at the G2-mitosis boundary from either excessive DNA damage or CDK1 inhibition prevents inflammatory-stimulated gene expression and immune-mediated destruction of distal tumors. Remarkably, DNAdamage-induced inflammatory signaling is restored in a RIG-I-dependent manner upon concomitant disruption of p53 and the G2 checkpoint. These findings link aberrant cell progression and p53 loss to an expanded spectrum of damage-associated molecular pattern recognition and have implications for the design of rational approaches to augment anti-tumor immune responses.

Keywords: ATR; DNA damage; RIG-I; anti-tumor immune response; cGAS; cell cycle checkpoint; inflammatory signaling; p53.


Conflict of interest statement

Declaration of Interests The authors declare no competing interests.

Figures

Figure 1.
Figure 1.. G2/M Cell Cycle Arrest or c-NHEJ Deficiency Suppresses IR-Induced Inflammatory Signaling
(A) Scheme showing the library preparation workflow for RNA-seq. Created with BioRender. (B–D) Gene set enrichment analysis (GSEA) of RNA-seq data in MCF10A cells to identify enriched biological pathways at 3 days after 10 Gy versus untreated cells, 5 days after 10 Gy versus untreated cells, and 5 days versus 3 days after 10 Gy (B); 5 days after 10 Gy with CDK1i versus 5 days after 10 Gy with DMSO (C); and 5 days after 10 Gy in XRCC4 KO versus 5 days after 10 Gy in WT (D), respectively. Significant GSEA enrichment score curves were noted for interferon-α response, interferon-γ response, and IL6-JAK-STAT3 signaling. The green curve in the displayed GSEA thumbnails represents the enrichment score curve. Genes on the far left (red) correlated with treatment condition, and genes on the far right (blue) correlated with the control condition. The vertical black lines indicate the position of each gene in the studied gene set. The normalized enrichment score (NES) and false discovery rate (FDRq) are shown for each pathway. (E) Heatmap showing the Z score of FPKM expressions in control, CDK1i, cGAS KO, STING KO, and XRCC4 KO MCF10A cells for genes differentially expressed at 5 days after 10-Gy treatment (fold change > 2; p value < 1e10). See also Figure S1.
Figure 2.
Figure 2.. Progression of the Irradiated Tumor Cells through Mitosis Is Required for Systemic Anti-tumor Immune Responses
(A) Scheme showing B16 melanoma model. Created with BioRender. (B and C) Growth of WT B16 cells (untreated tumors) after injection of B16 WT cells with no treatment, 10-Gy irradiation, or 10-Gy irradiation with CDK1i treatment (B), and WT B16 cells or Ku70 KO B16 cells with no treatment or 10-Gy irradiation (C) 3 days before implantation, respectively. All mice were administrated with anti-CTLA-4 antibody (9H10) as described in (A). Animal numbers are indicated in parentheses of treatment groups. (D and E) Statistic of tumor volumes at day 15 as measured in (B) and (C). Statistical significance is compared using a two-tailed t test. Error bars are SEM of biological replicates.
Figure 3.
Figure 3.. Disruption of the IR-Induced G2/M Checkpoint Enhances Inflammatory Signaling Activation in MCF10A Cells
(A) MCF10A cells were irradiated or left untreated with or without the indicated treatments, followed by fixation at the indicated times. Cells with micronuclei were quantified. Mean values and SEM are plotted (n = 3). (B) MCF10A cells irradiated or left untreated with or without indicated inhibitors were fixed and subjected to cell cycle analysis by flow cytometry. Mean values and SEM are plotted (n = 3). (C and D) MCF10A cells irradiated with the indicated dose or left untreated in the presence of the indicated inhibitors were collected at the specified time point for western blot. (E) MCF10A I-PpoI cells were left untreated (NIR), irradiated with 10 Gy (IR), or treated with 4-OHT and shield-1 for 5 h (I-PpoI), and then maintained in medium with or without ATR inhibitor for 3 days before collection for western blot analysis. (F) MCF10A AsiSI cells were left untreated (NIR), irradiated with 10 Gy (IR), induced with 4-OHT and shield-1 for 5 h(AsiSI), or cultured in the presence of aphidicolin (Aph), and then maintained in medium with or without ATR inhibitor for 3 days before collection for western blot analysis. For Aph-treated cells, 2.5 μM aphidicolin was included in the medium until cell collection 3 days later. (G) MCF10A cells left untreated or irradiated with 10 Gy were maintained for 3 days in the presence or absence of ATR inhibitor before collection for western blot analysis.
Figure 4.
Figure 4.. Disruption of p53 and ATR Restores IR-Induced Inflammatory Signaling in c-NHEJ-Deficient MCF10A Cells
(A–C) WT cells, p53 KO cells, XRCC4 KO cells, or XRCC4 P53 DKO (double knockout) cells were irradiated with 10 Gy (IR), and then maintained in medium with or without ATR inhibitor for 3 days before fixation for immunofluorescence staining. Mean values and SEM are plotted (n = 3). (D and E) WT cells, p53 KO cells, XRCC4 KO cells or XRCC4 P53 DKO cells were irradiated with 10 Gy and then cultured for 3 days in the presence or absence of ATR inhibitor before collection for western blot analysis. (F) Bar plot showing the normalized enrichment score (NES) and false discovery rate (FDRq) for the identified enriched biological pathways in MCF10A cells 3 days after 10 Gy irradiation. See also Figure S2 and S3.
Figure 5.
Figure 5.. p53 Loss Cooperates with ATR Inhibition to Activate cGAS-Independent Inflammatory Signaling
(A and B) WT cells or p53 KO cells were irradiated with 10 Gy and cultured in medium with (A) or without (B) ATR inhibitor followed by collection for western blot analysis 3 days later. (C and D) WT cells or p53 KO cells were irradiated with 10 Gy and maintained in medium with or without ATR inhibitor before fixation at indicated time. Cells with micronuclei were qualified (D), and representative images for cells with micronuclei 3 days after IR are shown in (C). Mean values and SEM (n = 2) are plotted. (E) RNA-seq data of ectopic cGAS versus mock and p53 KO versus WT were interrogated by gene set enrichment analysis (GSEA) to identify enriched biological pathways in RPE-1 cells 3 days after 10 Gy irradiation in the presence of ATR inhibitor, respectively. Significant GSEA enrichment score curves were noted for interferon-a response, interferon-g response, and IL6-JAK-STAT3 signaling. In GSEA thumbnails, the green curve represents the enrichment score curve. Genes on the far left (red) correlated with former cells, and genes on the far right (blue) correlated with latter cells. The vertical black lines indicate the position of each gene in the studied gene set. The normalized enrichment score (NES) and false discovery rate (FDR) are shown for each pathway. See also Figure S4.
Figure 6.
Figure 6.. RIG-I Mediates Inflammatory Signaling in RPE-1 p53 KO Cells after IR and ATRi Treatment
(A) RPE-1 p53 KO cells and RPE-1 p53 RIG-I DKO cells were irradiated with 10 Gy in the presence of ATRi and maintained for 3 days before collection for western blot analysis. (B) RPE-1 p53 KO cells were irradiated with 10 Gy and subjected to culture in medium with ATRi for indicated time before crude mitochondria isolation. Equal amounts of isolated crude mitochondria were loaded into 1.5% vertical agarose gels with 0.1% SDS for SDD-PAGE analysis. (C) Scheme showing a working model of this study. Created with BioRender. See also Figure S5.

References

    1. Ablasser A, and Hur S. (2020). Regulation of cGAS- and RLR-mediated immunity to nucleic acids. Nat. Immunol. 21, 17–29. - PubMed
    1. Ablasser A, Bauernfeind F, Hartmann G, Latz E, Fitzgerald KA, and Hornung V. (2009). RIG-I-dependent sensing of poly(dA:dT) through the induction of an RNA polymerase III-transcribed RNA intermediate. Nat. Immunol. 10, 1065–1072. - PMC - PubMed
    1. Abraham RT (2001). Cell cycle checkpoint signaling through the ATM and ATR kinases. Genes Dev. 15, 2177–2196. - PubMed
    1. Bakhoum SF, Ngo B, Laughney AM, Cavallo JA, Murphy CJ, Ly P, Shah P, Sriram RK, Watkins TBK, Taunk NK, et al. (2018). Chromosomal instability drives metastasis through a cytosolic DNA response. Nature 553, 467–472. - PMC - PubMed
    1. Barlow C, Brown KD, Deng CX, Tagle DA, and Wynshaw-Boris A. (1997). Atm selectively regulates distinct p53-dependent cell-cycle checkpoint and apoptotic pathways. Nat. Genet. 17, 453–456. - PubMed

Publication types